
Top Crypto Losers: Worldcoin, Chiliz, Hyperliquid lead losses as market bleeds $1.75 billion
Bởi Vishal Dixit
Ngày xuất bản: 30 Jan 2026 | Ngày chỉnh sửa: 30 Jan 2026


BÀI VIẾT PHỔ BIẾN

Worldcoin (WLD), Chiliz (CHZ), and Hyperliquid (HYPE) posted heavy losses over the last 24 hours as Bitcoin (BTC) dropped below $82,000 on Friday, triggering a $1.75 billion wipeout and mirroring the bearish tremors in the US stock market.
- Worldcoin is down 5% on Friday, extending Thursday’s 18% decline.
- Chiliz falls below the $0.0500 psychological level after a 16% drop on Thursday, holding at the 50-day EMA.
- Hyperliquid drops below $30 with a 7% loss on Friday, adding to the 10% loss from the previous day.
Worldcoin (WLD), Chiliz (CHZ), and Hyperliquid (HYPE) posted heavy losses over the last 24 hours as Bitcoin (BTC) dropped below $82,000 on Friday, triggering a $1.75 billion wipeout and mirroring the bearish tremors in the US stock market. An intense flush of highly leveraged positions deepens losses in the crypto market amid uncertainty about US President Donald Trump's decision on the next US Federal Reserve (Fed) Chair.
Bitcoin eyes $80,000 amid $1.75 billion market liquidation
Bitcoin is trading below $82,000, down 3% intraday at press time on Friday, extending the 5% decline from the previous day. The correction phase breaks below the support trendline connecting the November 22 and January 25 lows, marking a bearish breakdown of a channel pattern.
The major crypto is approaching the $80,600 support level, which helped drive a rebound on November 21, as FXStreet anticipated.
If BTC slips below $80,600, it could extend the decline toward the 1.272 Fibonacci extension level at $75,887, which is measured from the November 21 low at $80,600 to the January 14 high at $97,924.
The momentum indicators on the daily chart signal a bearish bias, as the Moving Average Convergence Divergence (MACD) histogram intensifies below zero while the blue and red lines extend into negative territory. At the same time, the Relative Strength Index (RSI) at 29 enters into the oversold zone, reaffirming the rising selling pressure.
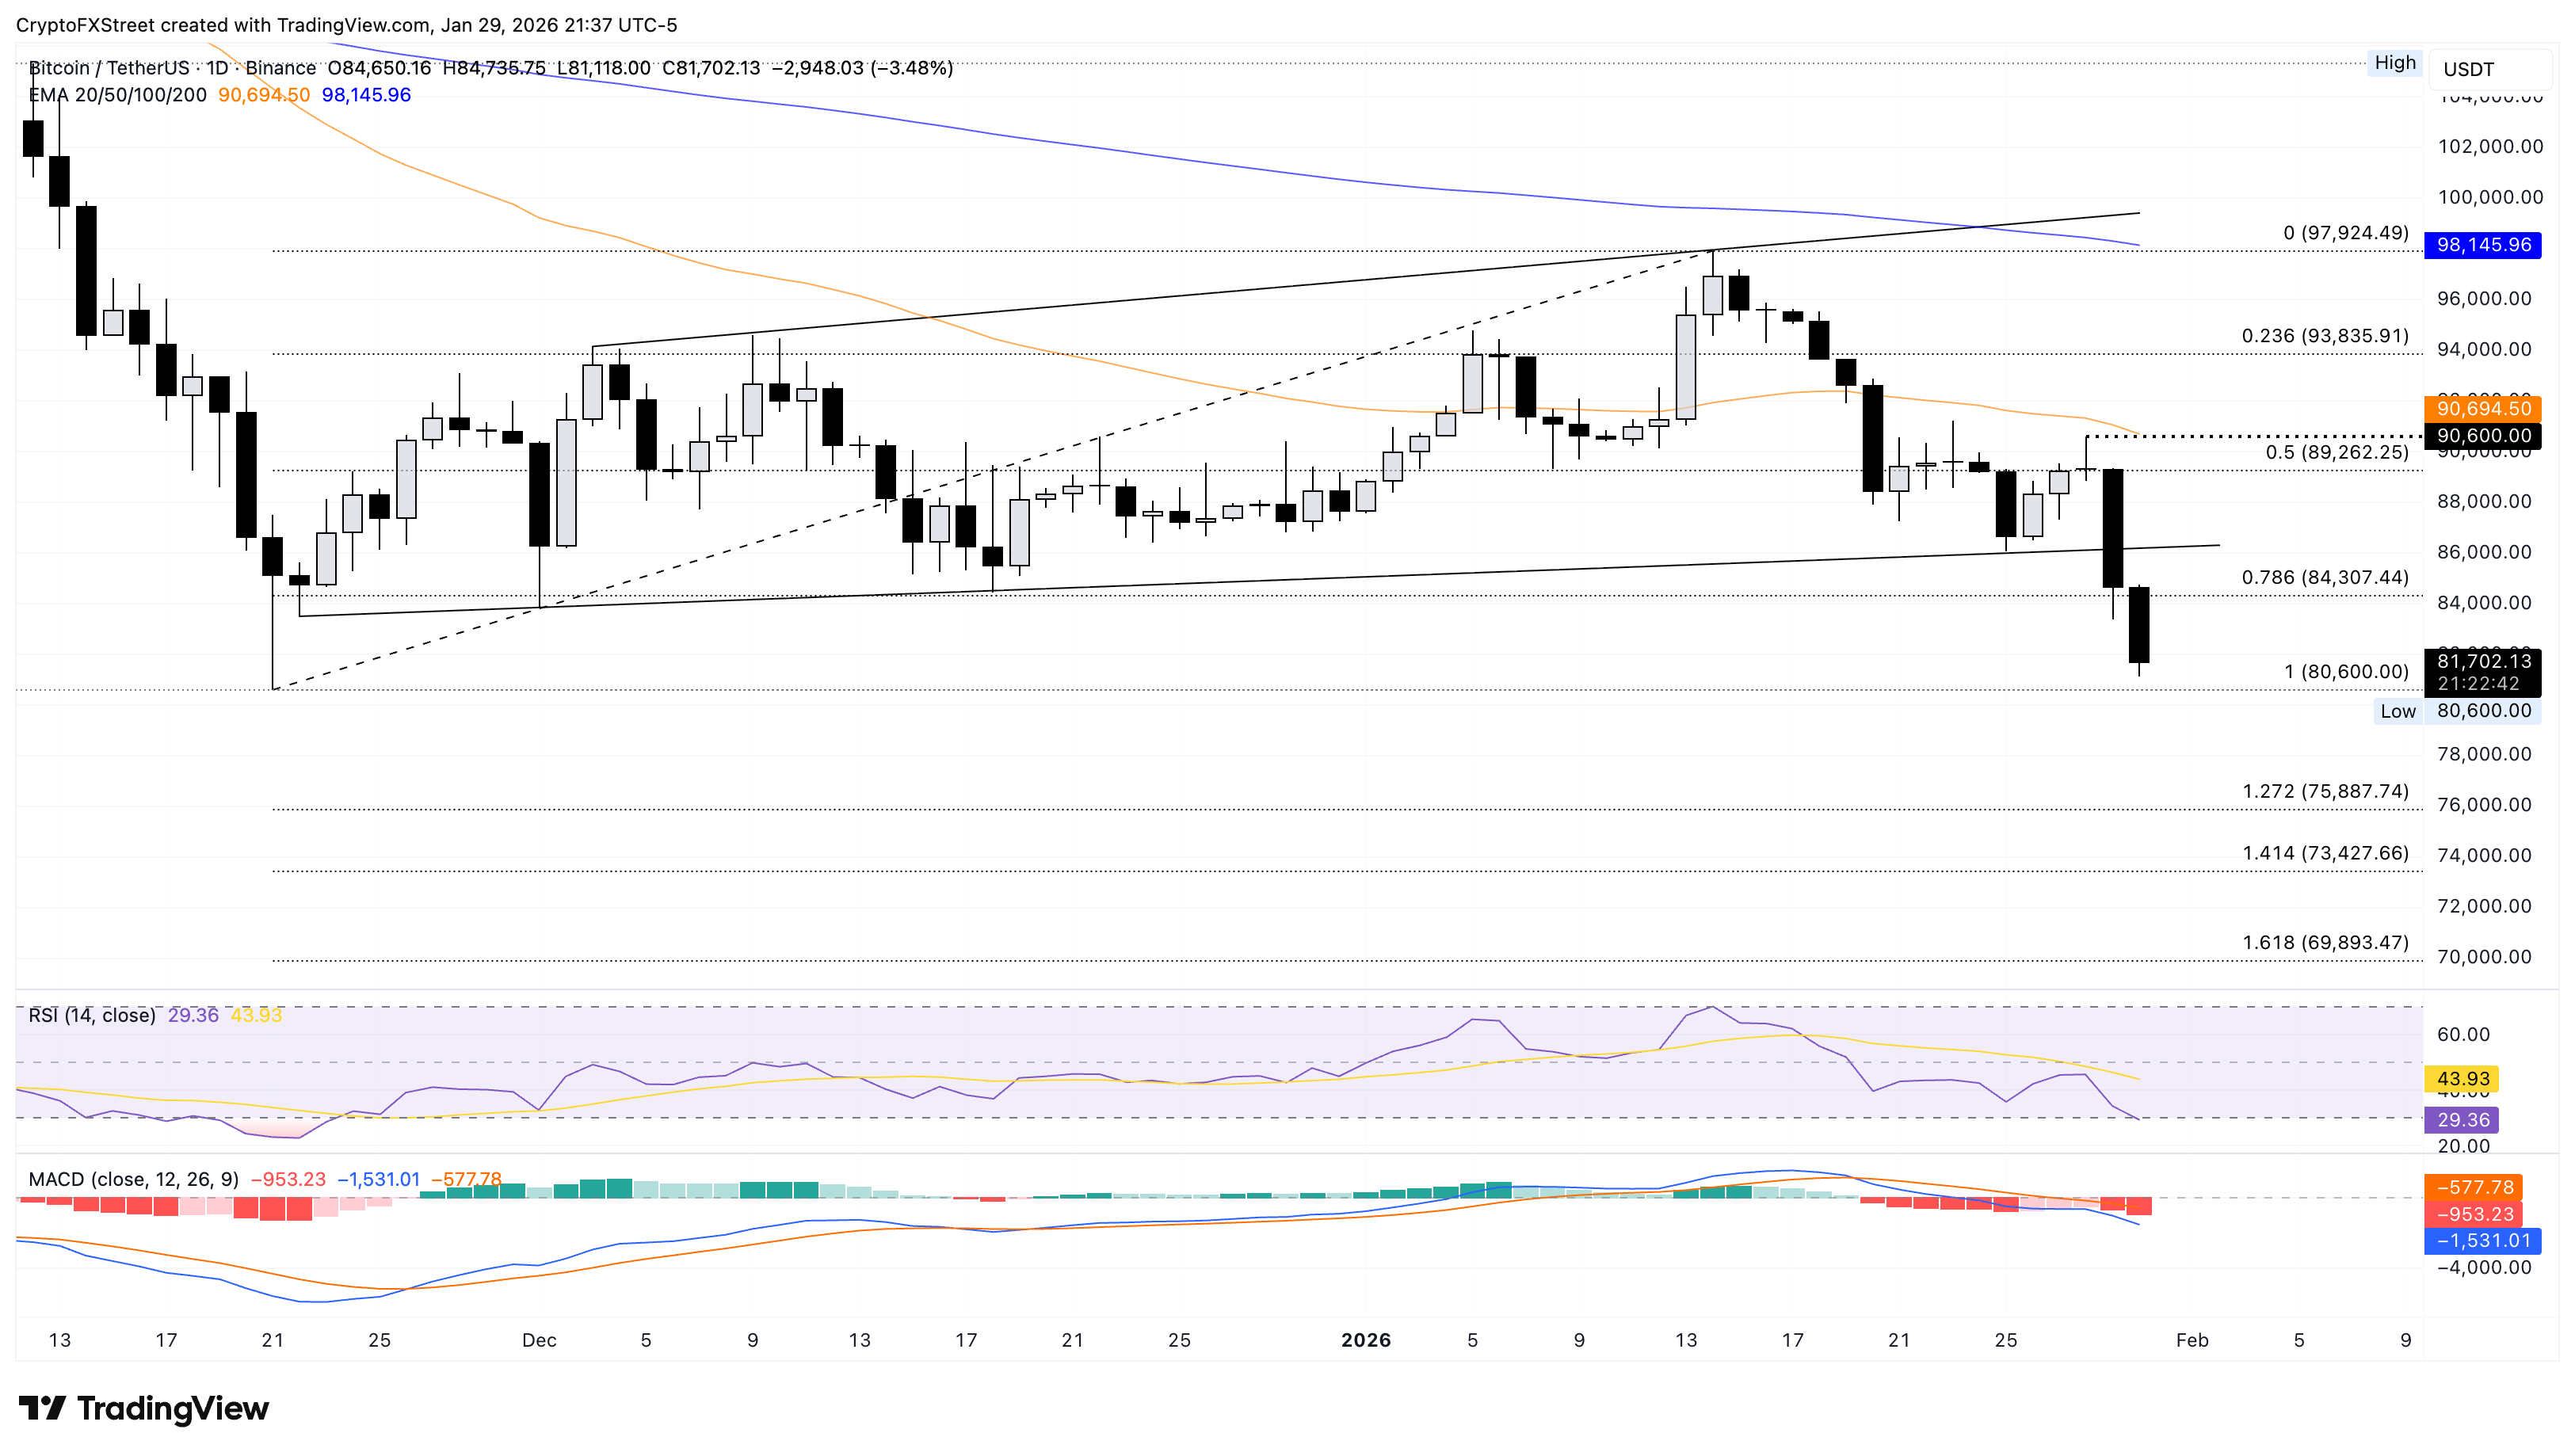
Optimistically, a potential rebound from $80,600 could retest the 78.6% Fibonacci retracement level at $84,307.
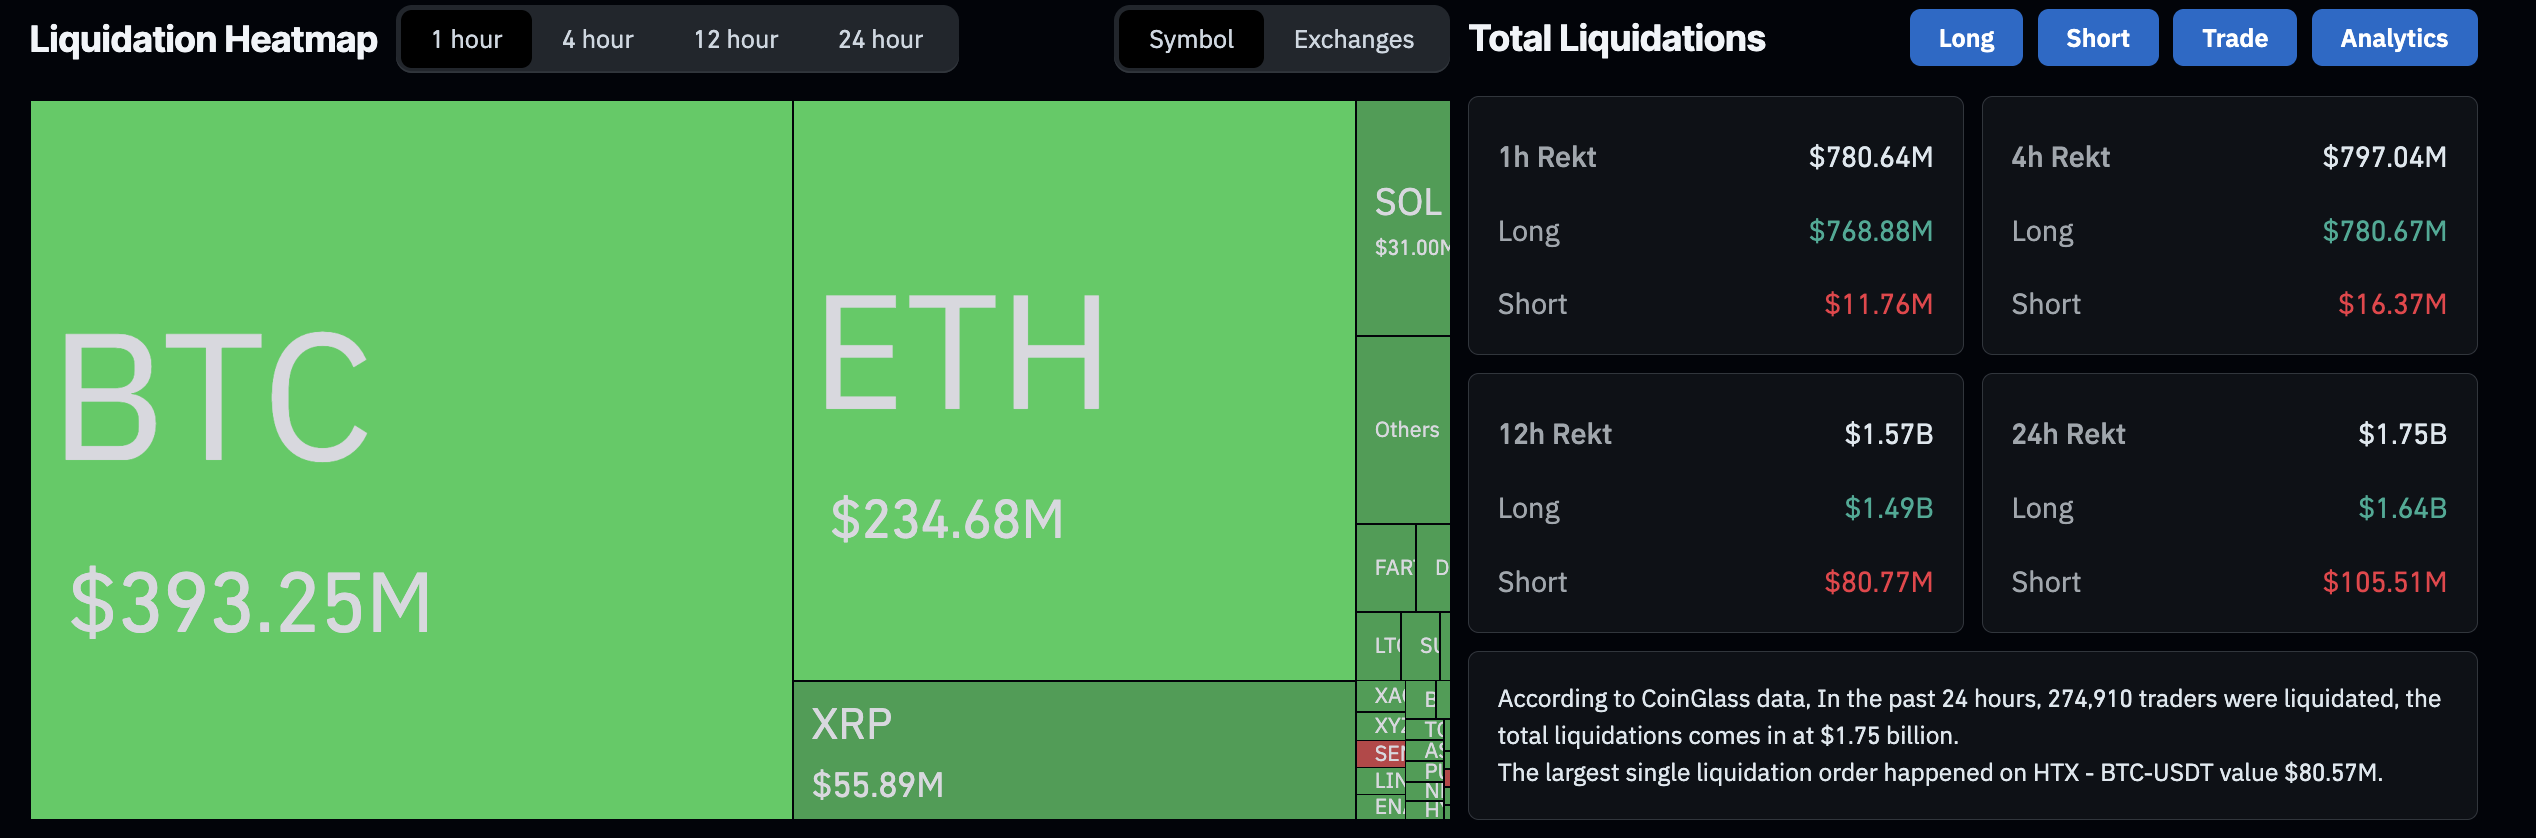
In the broader crypto market, the sudden pullback in Bitcoin triggered bearish waves, resulting in over $1.75 billion in liquidations across 274,910 traders in the last 24 hours, including over $1.64 billion in long liquidations. The largest liquidation event occurred on the HTX exchange in the BTC-USDT pair, valued at $80.57 million.
Worldcoin, Chiliz and Hyperliquid lead the losses
Worldcoin reversed 18% to the downside on Thursday, nearly erasing Wednesday’s 25% gain. At the time of writing, WLD extends the decline by 5% on Friday, teasing a bearish close to the week.
The MACD crosses below the signal line, suggesting a renewed shift toward bearish momentum. Meanwhile, the RSI at 42 remains below the midline, indicating rising supply nearly approaching oversold conditions.
The immediate support for WLD lies at the S1 Pivot Point at $0.4118, followed by a deeper zone at the S2 Pivot Point at $0.3430.
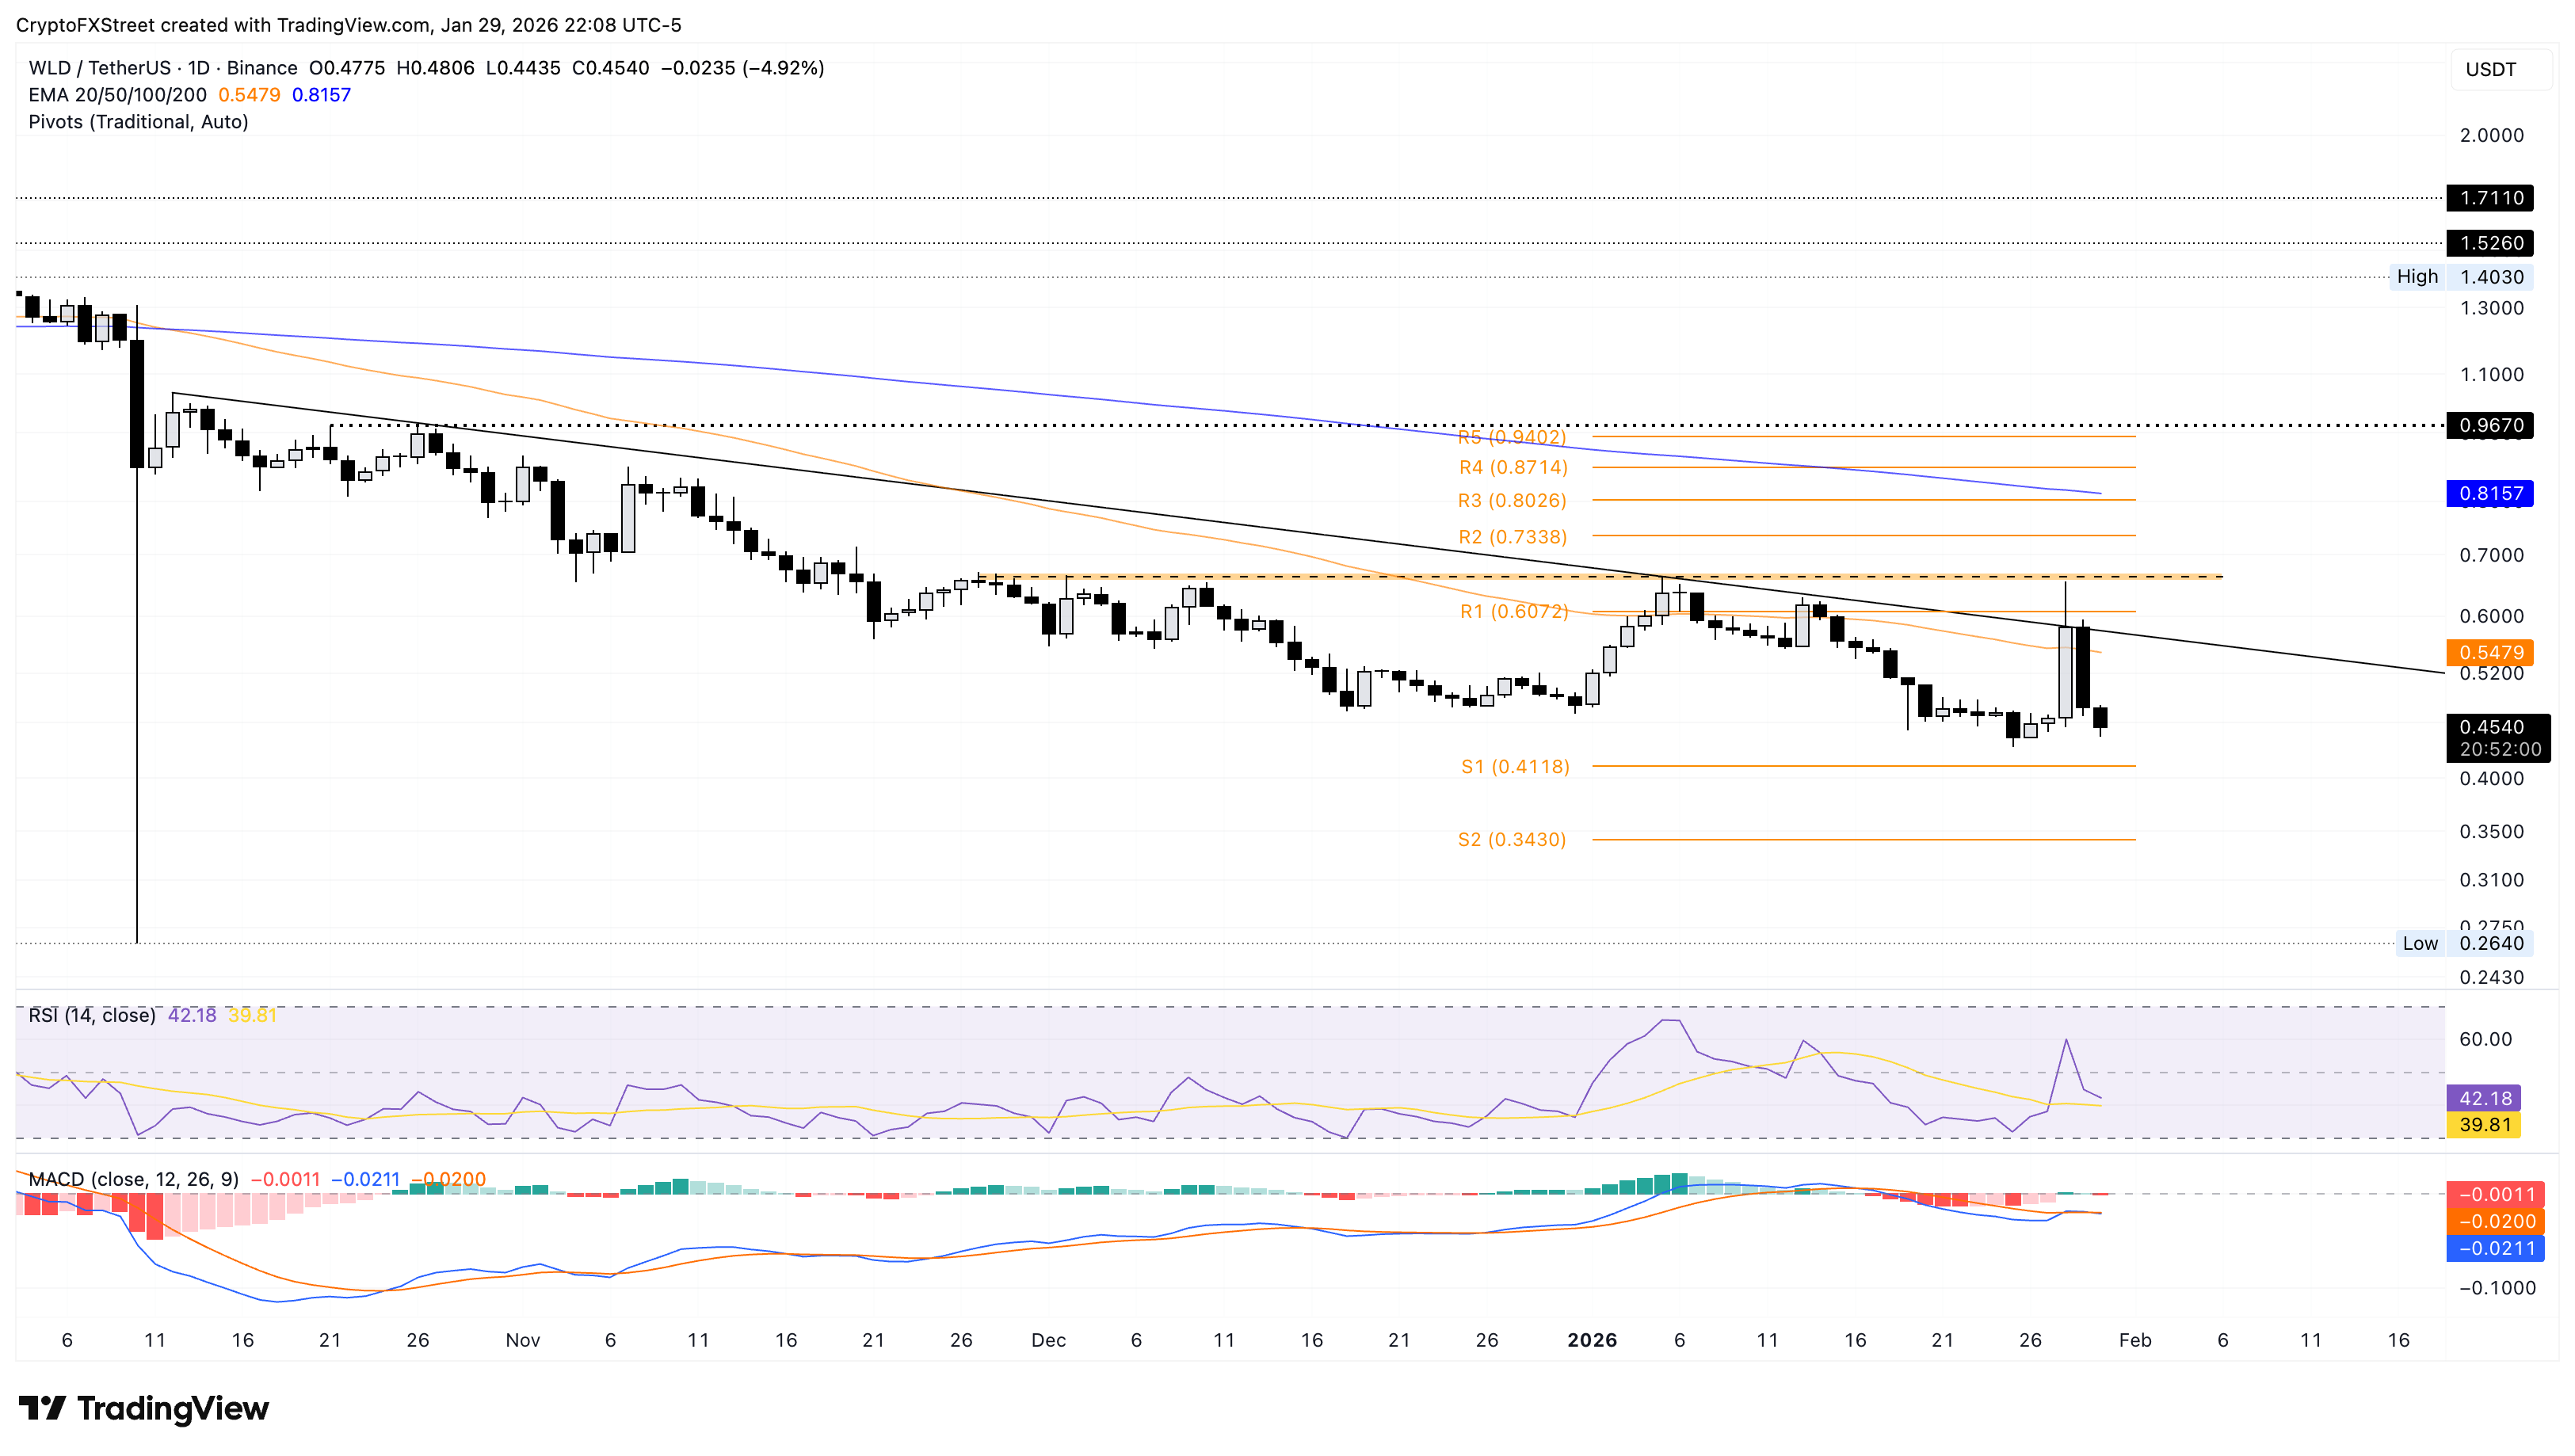
In the event of a rebound, the 50-day Exponential Moving Average (EMA) at $0.5479 remains a key resistance level.
Another top loser, Chiliz, is near its 50-day EMA at $0.0462 as of Friday, after a 16% drop the previous day. The bearish Marubozu candle on Thursday broke below the $0.0500 psychological level, reaffirming the bearish tone.
If CHZ slips below the 50-day EMA at $0.04620, it could target the support zone between the January 6 low at $0.04251 and the 200-day EMA at $0.04118.
The RSI at 45 falls below the midline, indicating selling pressure has resurfaced. Additionally, the MACD and signal line extend the decline toward the zero line as the negative histogram widens, confirming rising bearish momentum.
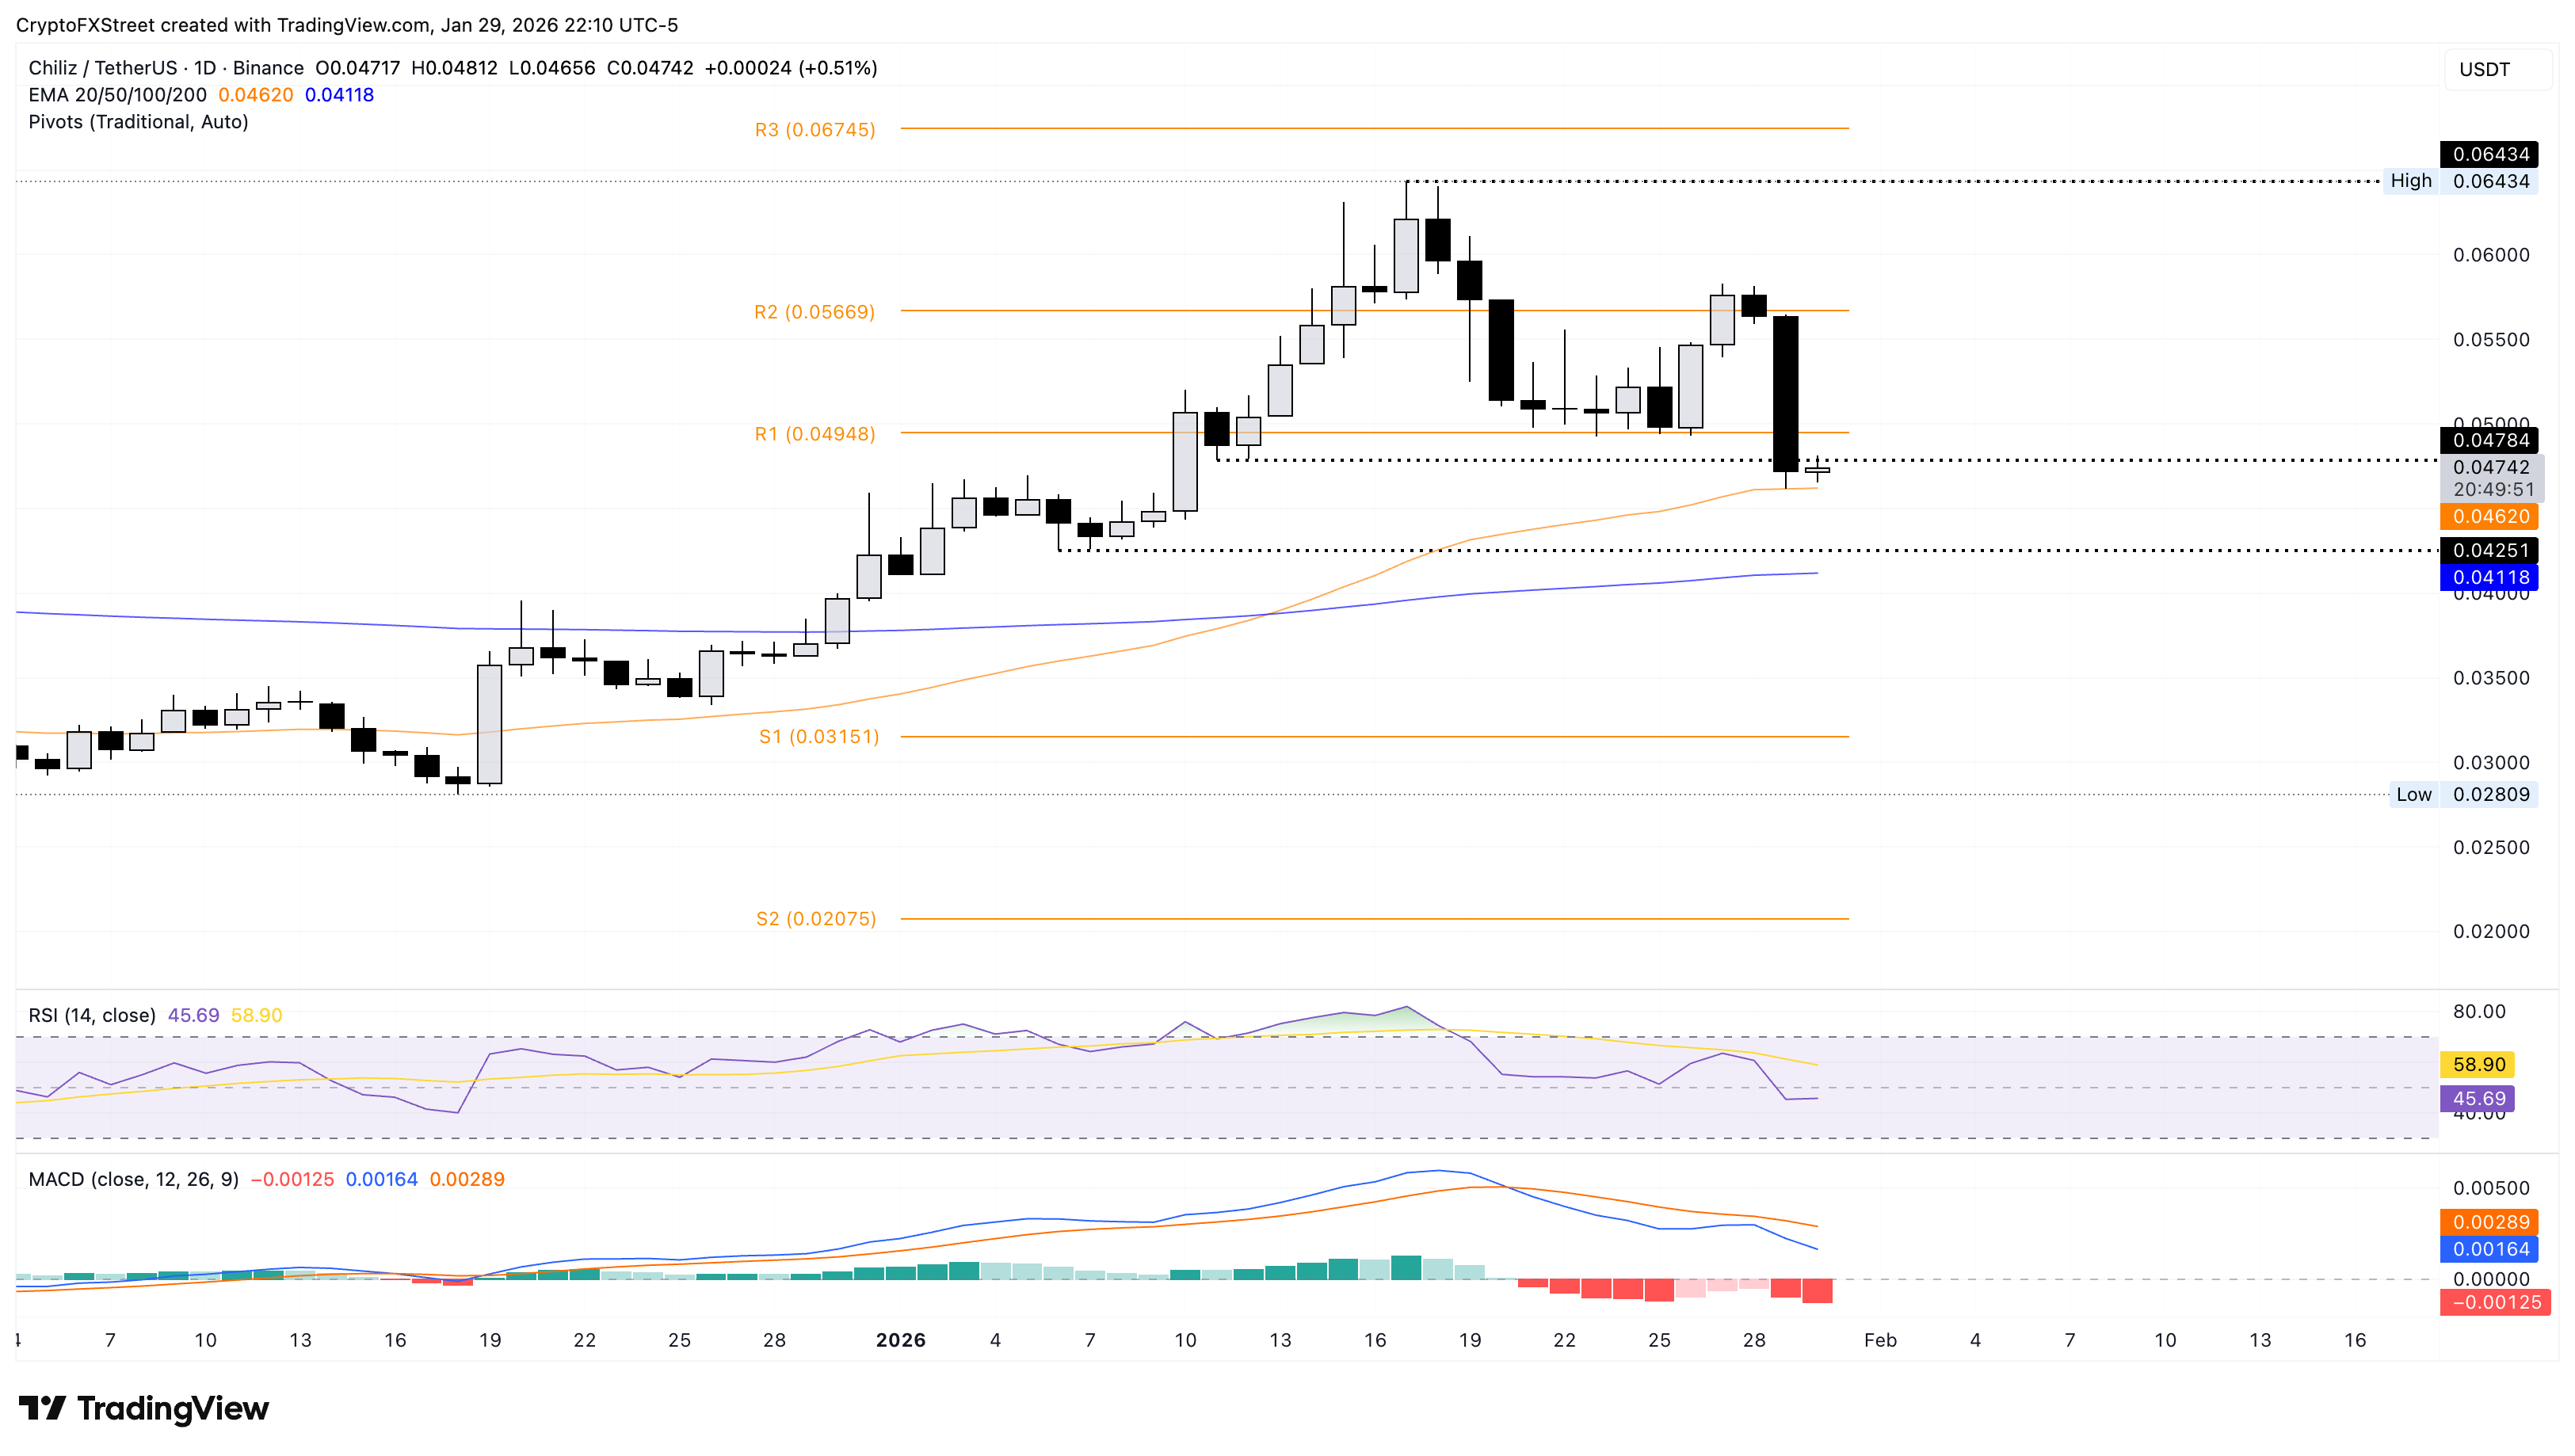
Looking up, if CHZ rebounds above $0.05000, it could extend the rally toward the R2 Pivot Point at $0.05669.
On the other hand, Hyperliquid is down 7% by press time on Friday, extending the 10% fall from the previous day. The exchange token has dropped below $30, approaching the 50-day EMA at $27.04.
The pullback risks erasing the 55% gains from the three-day rally earlier this week on its HIP-3 release. If HYPE sustains a close above $27.04, an easing in overhead pressure could rebound toward the 200-day EMA at $32.86.
However, the momentum indicators maintain a sell-side bias: the RSI at 55 shows an inverted V-shaped reversal from the overbought zone, indicating a sudden loss of buying pressure, while MACD approaches the signal line as bullish momentum wanes.
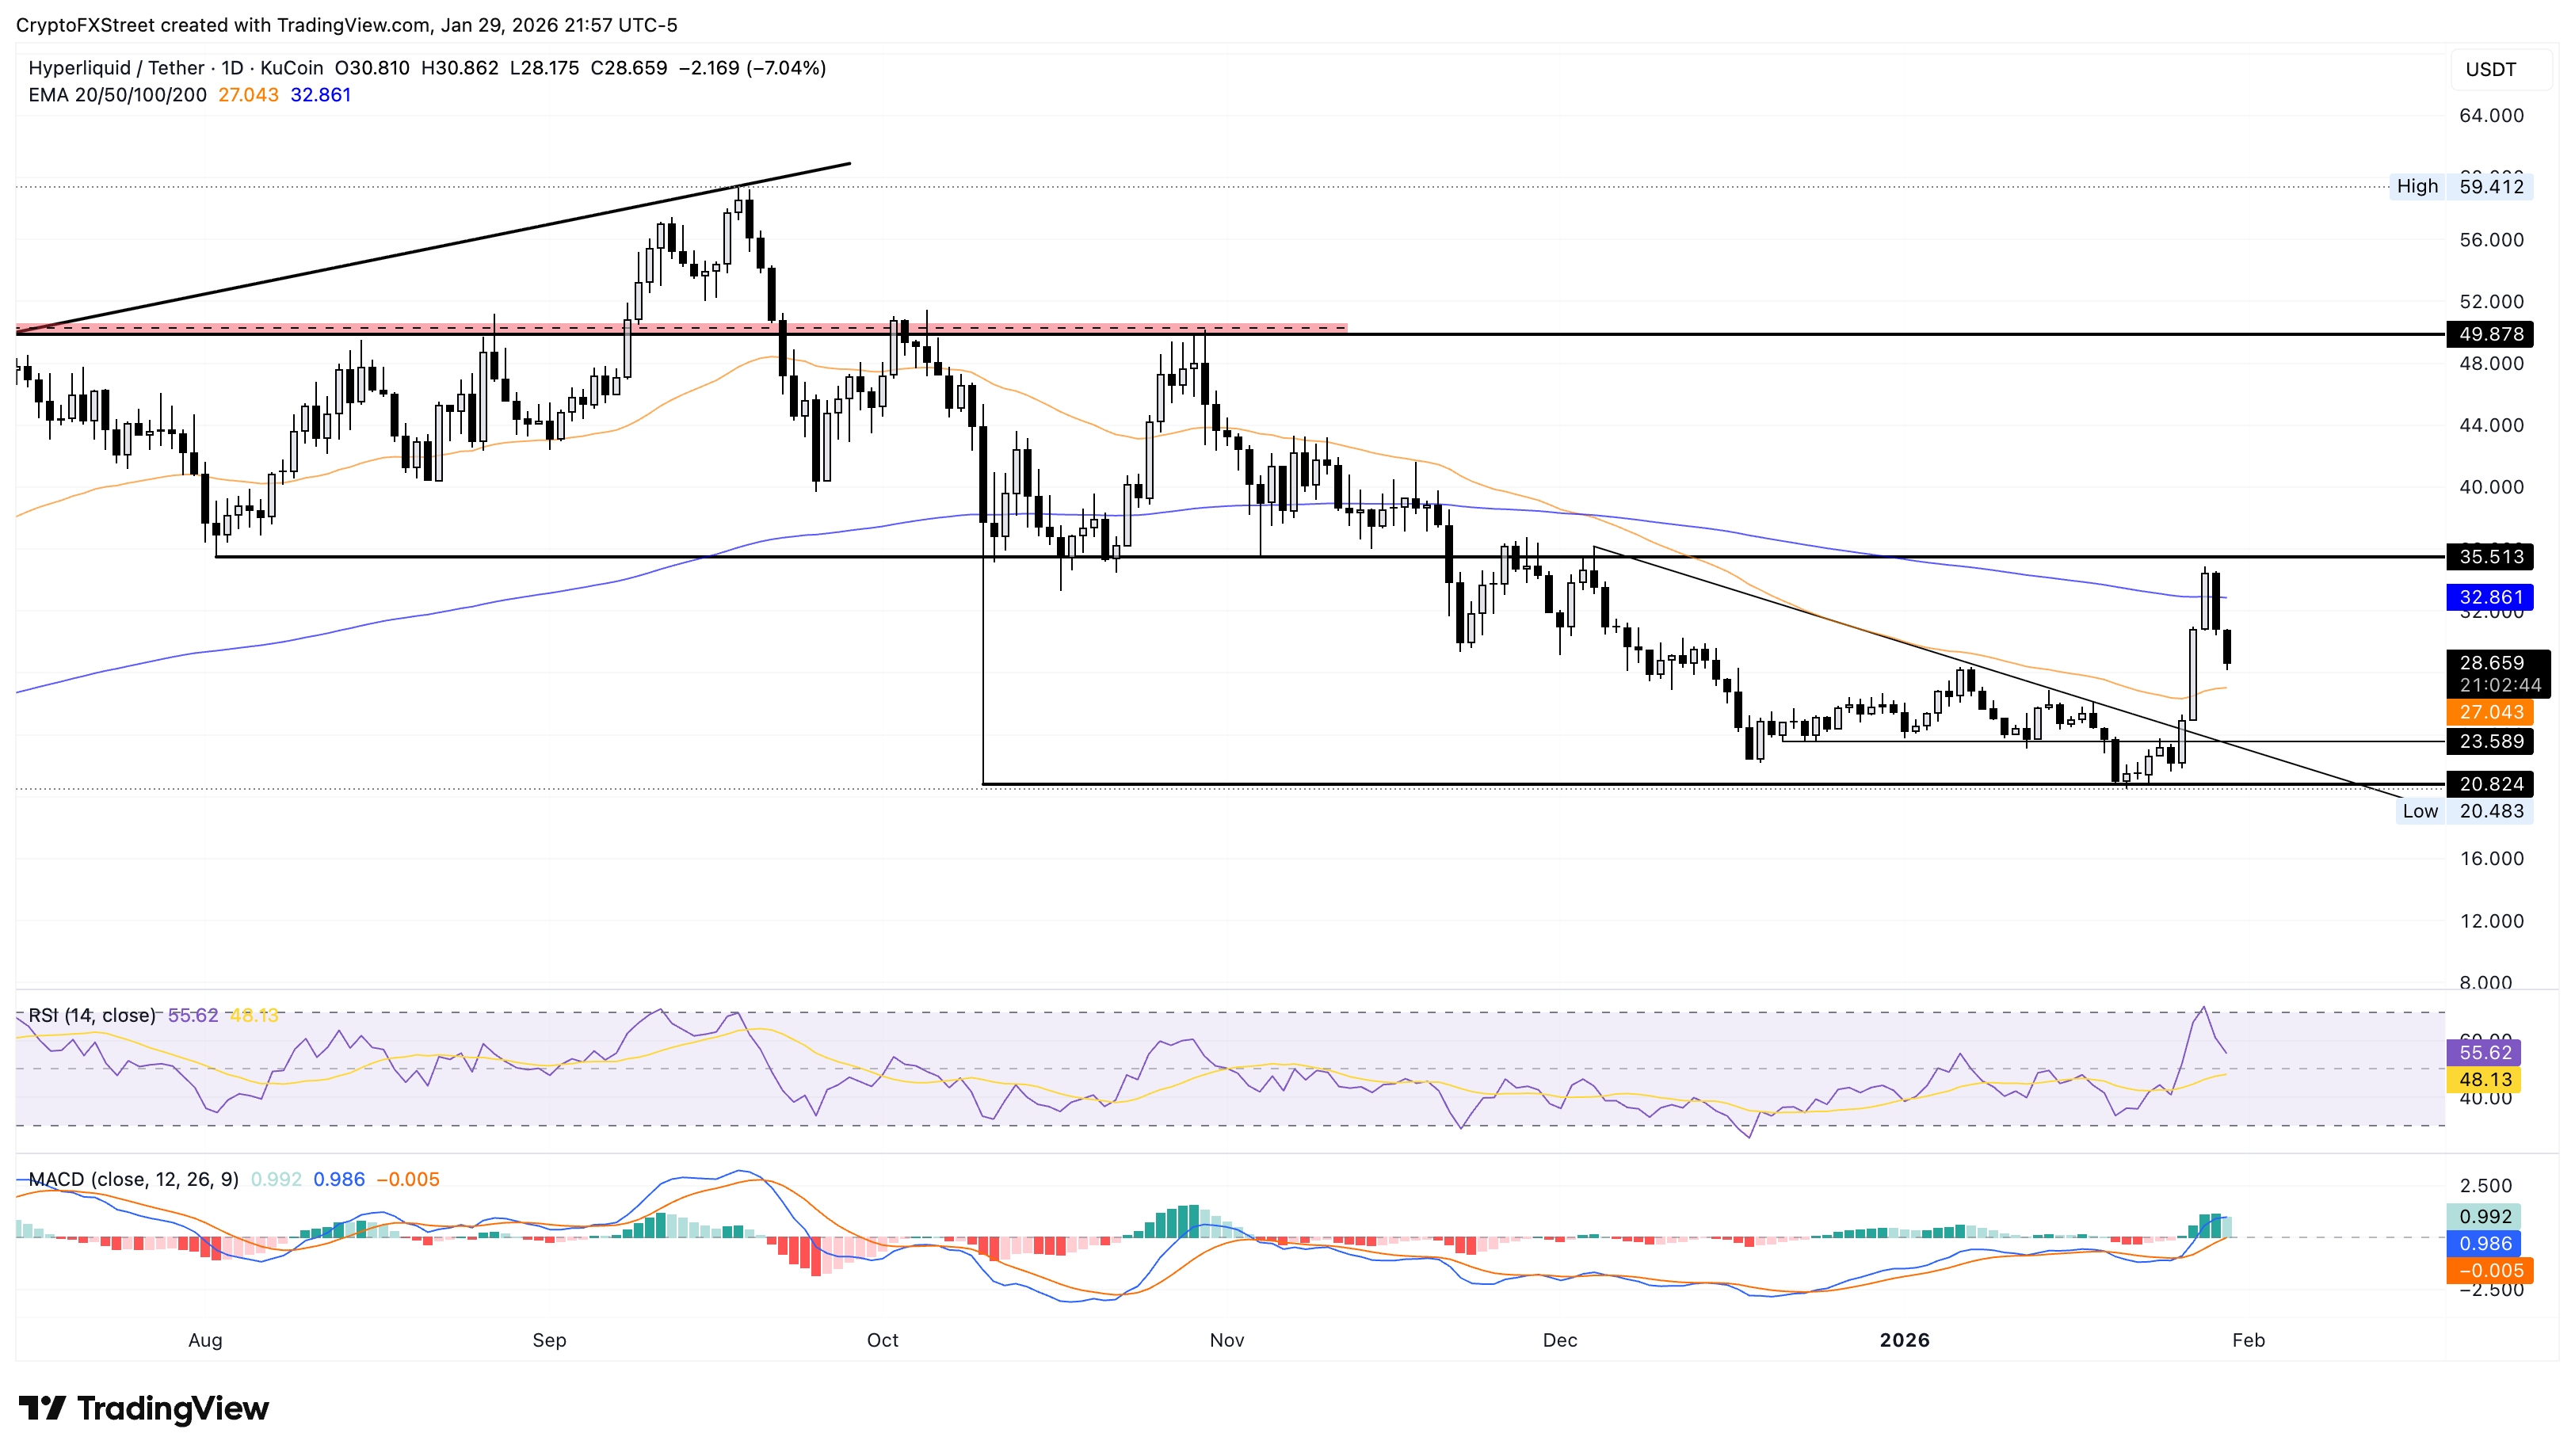
If HYPE closes the day below the 50-day EMA at $27.04, it could retest the $23.58 level marked by the December 21 low.

Hơn một triệu người dùng dựa vào FXStreet để có dữ liệu thị trường thời gian thực, công cụ biểu đồ, góc nhìn chuyên gia và tin tức Forex. Lịch kinh tế toàn diện và các hội thảo web giáo dục giúp nhà giao dịch luôn cập nhật và đưa ra quyết định có tính toán. FXStreet có khoảng 60 nhân sự, chia giữa trụ sở Barcelona và nhiều khu vực toàn cầu.
Đọc thêm


