
USD/CAD Price Forecast: Bulls take control after clearing 1.3700-1.3750 resistance zone
Bởi Vishal Chaturvedi
Đã cập nhật: 25 Mar 2026


BÀI VIẾT PHỔ BIẾN

USD/CAD edges higher on Wednesday, extending gains for a second straight session as a broadly stronger US Dollar (USD) keeps the Canadian Dollar (CAD) under sustained pressure.
- USD/CAD extends gains toward 1.3800 as broad US Dollar strength keeps the Loonie under pressure
- Geopolitical tensions and Iran’s rejection of a US ceasefire plan sustain safe-haven demand for the Greenback.
- Technical breakout above key resistance zone strengthens bullish momentum, with momentum indicators pointing to further upside.
USD/CAD edges higher on Wednesday, extending gains for a second straight session as a broadly stronger US Dollar (USD) keeps the Canadian Dollar (CAD) under sustained pressure.
At the time of writing, the pair is trading around 1.3806, its highest level since January 22.
The Greenback continues to draw support from escalating Middle East tensions. In the latest developments, Iran has rejected a US-backed ceasefire proposal and poured cold water on Washington’s 15-point plan, saying any deal would be on its own terms.
At the same time, Oil prices remain volatile, holding above pre-conflict levels despite a recent pullback. Given Canada’s status as a major crude exporter, elevated Oil prices typically support the commodity-linked Loonie. However, the broader strength in the USD and persistent risk aversion are currently outweighing that support, keeping USD/CAD biased to the upside.
USD/CAD technical analysis
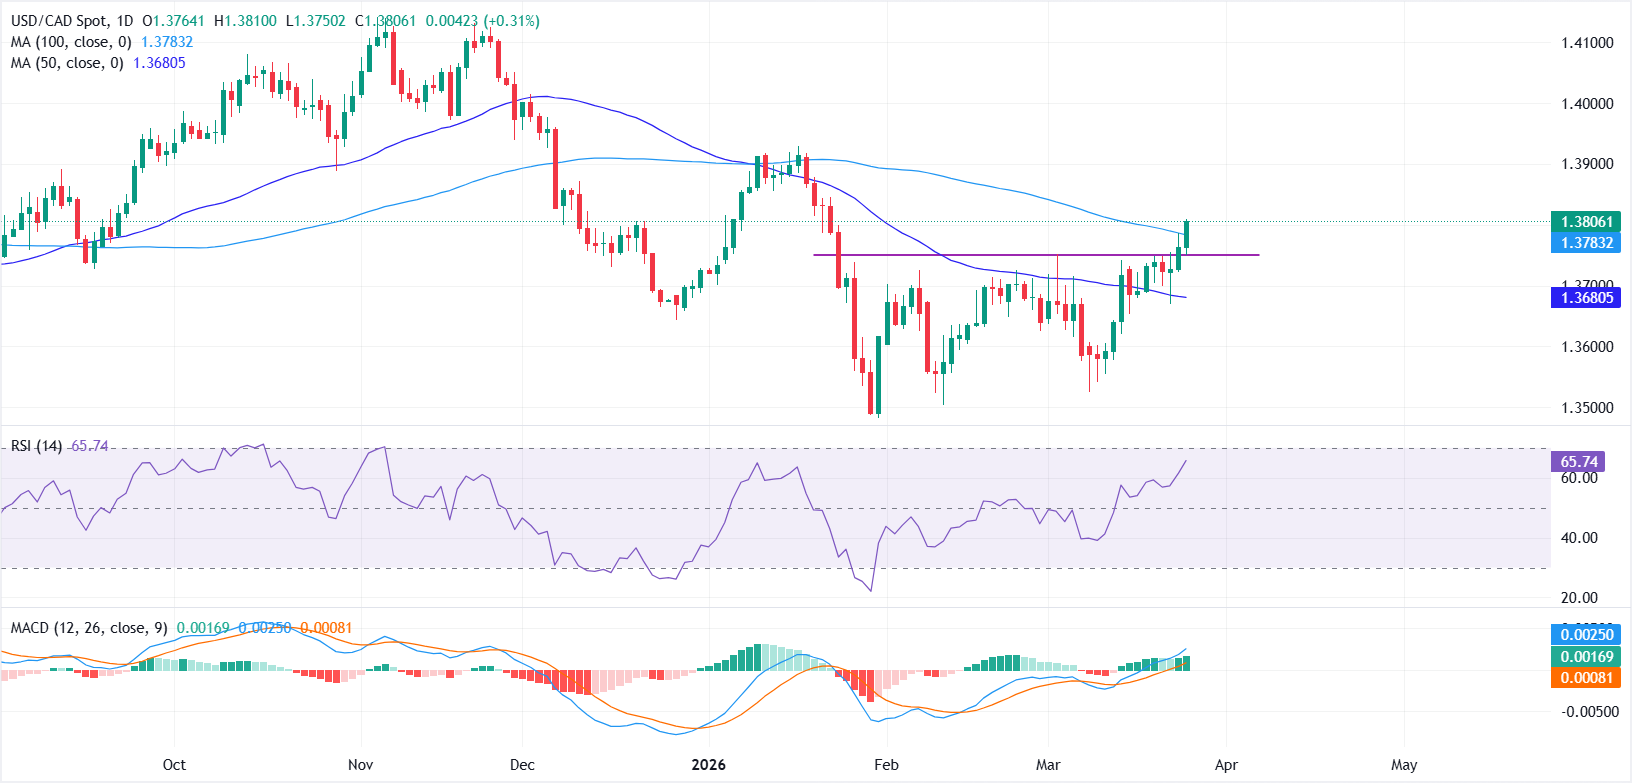
From a technical perspective, USD/CAD is showing strengthening momentum after breaking above the 50-day Simple Moving Average (SMA) at 1.3680 and clearing the 1.3700-1.3750 resistance zone, which had capped upside attempts since early February.
The latest leg higher has pushed the pair above the 100-day SMA at 1.3783, signaling a potential shift toward a more bullish near-term bias.
The Relative Strength Index (RSI) at 65 moves away from its midline and approaches overbought territory, signaling firm upside momentum rather than exhaustion at this stage.
The Moving Average Convergence Divergence (MACD) line holds above its Signal line in positive territory, and the positive histogram persists, which reinforces the view that buying pressure dominates the current leg higher.
On the upside, a sustained move above the 100-day SMA could pave the way for initial resistance at 1.3850, which aligns closely with the January 22 high, followed by the 1.3900 psychological level.
US Dollar Price Today
The table below shows the percentage change of US Dollar (USD) against listed major currencies today. US Dollar was the strongest against the Australian Dollar.
| USD | EUR | GBP | JPY | CAD | AUD | NZD | CHF | |
|---|---|---|---|---|---|---|---|---|
| USD | 0.27% | 0.21% | 0.35% | 0.31% | 0.48% | 0.26% | 0.37% | |
| EUR | -0.27% | -0.06% | 0.09% | 0.04% | 0.21% | -0.01% | 0.10% | |
| GBP | -0.21% | 0.06% | 0.15% | 0.10% | 0.27% | 0.06% | 0.17% | |
| JPY | -0.35% | -0.09% | -0.15% | -0.04% | 0.14% | -0.09% | 0.02% | |
| CAD | -0.31% | -0.04% | -0.10% | 0.04% | 0.18% | -0.03% | 0.06% | |
| AUD | -0.48% | -0.21% | -0.27% | -0.14% | -0.18% | -0.21% | -0.11% | |
| NZD | -0.26% | 0.00% | -0.06% | 0.09% | 0.03% | 0.21% | 0.10% | |
| CHF | -0.37% | -0.10% | -0.17% | -0.02% | -0.06% | 0.11% | -0.10% |
The heat map shows percentage changes of major currencies against each other. The base currency is picked from the left column, while the quote currency is picked from the top row. For example, if you pick the US Dollar from the left column and move along the horizontal line to the Japanese Yen, the percentage change displayed in the box will represent USD (base)/JPY (quote).
On the downside, failure to hold above the 100-day SMA could see the pair retest the 1.3700-1.3750 zone, which has now turned into support after previously capping gains. Holding above this region keeps the bullish bias intact, while a break below would tilt the outlook back to the downside.

Hơn một triệu người dùng dựa vào FXStreet để có dữ liệu thị trường thời gian thực, công cụ biểu đồ, góc nhìn chuyên gia và tin tức Forex. Lịch kinh tế toàn diện và các hội thảo web giáo dục giúp nhà giao dịch luôn cập nhật và đưa ra quyết định có tính toán. FXStreet có khoảng 60 nhân sự, chia giữa trụ sở Barcelona và nhiều khu vực toàn cầu.
Đọc thêm


