
USD/CAD Price Forecast: Seeks trigger for fresh leg of rally above 1.3870
Bởi Sagar Dua
Đã cập nhật: 2 Jun 2026


BÀI VIẾT PHỔ BIẾN

The USD/CAD pair trades subduedly at around 1.3836 during the European trading session on Tuesday. The Loonie pair ticks lower as the US Dollar (USD) faces selling pressure despite uncertainty regarding whether the United States (US) and Iran will reach a deal soon.
- USD/CAD trades marginally lower at around 1.3836 as the US Dollar ticks down.
- Middle East tensions have renewed on reports that the US-Iran negotiations have halted.
- Investors await the US JOLTS Job Openings data for April.
The USD/CAD pair trades subduedly at around 1.3836 during the European trading session on Tuesday. The Loonie pair ticks lower as the US Dollar (USD) faces selling pressure despite uncertainty regarding whether the United States (US) and Iran will reach a deal soon.
As of writing, the US Dollar Index (DXY), which tracks the Greenback’s value against six major currencies, trades 0.1% lower to near 99.08.
The US-Iran deal uncertainty has increased, following headlines from Iran's Tasnim News agency on Monday that Tehran’s negotiating team has stopped exchanging messages with the US through mediators in response to an escalation of war crimes in Lebanon.
The US Dollar outperformed in the last few months as the Middle East crisis boosted oil prices, which prompted US inflation and forced traders to price out dovish Federal Reserve (Fed) bets. The US-Iran tensions also improved the appeal of safe-haven assets.
On the domestic front, investors await the US JOLTS Job Openings data for April, which will be published at 14:00 GMT.
USD/CAD technical analysis
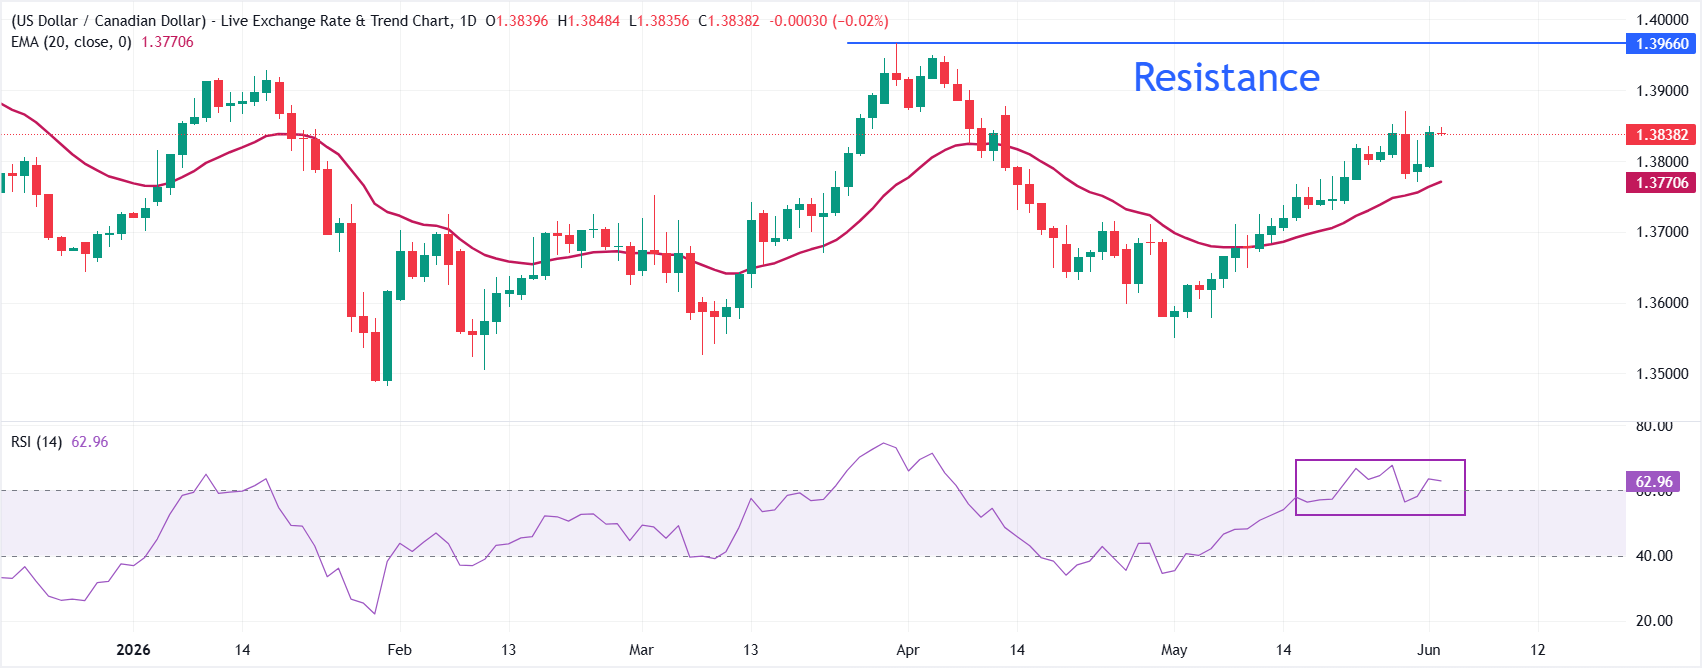
USD/CAD trades almost flat at around 1.3838 at press time. The pair holds a bullish near-term bias as price trades above the 20-day exponential moving average (EMA) at 1.3771. The short-term trend remains constructive while the pair defends this dynamic support, with the Relative Strength Index (RSI) around 63 suggesting firm but not yet overbought upside momentum.
On the downside, immediate support is located at the 20-day EMA near 1.3771, with a break below this level likely to signal a deeper corrective move towards the May 20 low at 1.3731. Looking up, the pair would resume its advance and revisit the March 31 high at 1.3967 if it manages to break above the May 28 high at 1.3870.
(The technical analysis of this story was written with the help of an AI tool.)
US Dollar FAQs
The US Dollar (USD) is the official currency of the United States of America, and the ‘de facto’ currency of a significant number of other countries where it is found in circulation alongside local notes. It is the most heavily traded currency in the world, accounting for over 88% of all global foreign exchange turnover, or an average of $6.6 trillion in transactions per day, according to data from 2022. Following the second world war, the USD took over from the British Pound as the world’s reserve currency. For most of its history, the US Dollar was backed by Gold, until the Bretton Woods Agreement in 1971 when the Gold Standard went away.
The most important single factor impacting on the value of the US Dollar is monetary policy, which is shaped by the Federal Reserve (Fed). The Fed has two mandates: to achieve price stability (control inflation) and foster full employment. Its primary tool to achieve these two goals is by adjusting interest rates. When prices are rising too quickly and inflation is above the Fed’s 2% target, the Fed will raise rates, which helps the USD value. When inflation falls below 2% or the Unemployment Rate is too high, the Fed may lower interest rates, which weighs on the Greenback.
In extreme situations, the Federal Reserve can also print more Dollars and enact quantitative easing (QE). QE is the process by which the Fed substantially increases the flow of credit in a stuck financial system. It is a non-standard policy measure used when credit has dried up because banks will not lend to each other (out of the fear of counterparty default). It is a last resort when simply lowering interest rates is unlikely to achieve the necessary result. It was the Fed’s weapon of choice to combat the credit crunch that occurred during the Great Financial Crisis in 2008. It involves the Fed printing more Dollars and using them to buy US government bonds predominantly from financial institutions. QE usually leads to a weaker US Dollar.
Quantitative tightening (QT) is the reverse process whereby the Federal Reserve stops buying bonds from financial institutions and does not reinvest the principal from the bonds it holds maturing in new purchases. It is usually positive for the US Dollar.

Hơn một triệu người dùng dựa vào FXStreet để có dữ liệu thị trường thời gian thực, công cụ biểu đồ, góc nhìn chuyên gia và tin tức Forex. Lịch kinh tế toàn diện và các hội thảo web giáo dục giúp nhà giao dịch luôn cập nhật và đưa ra quyết định có tính toán. FXStreet có khoảng 60 nhân sự, chia giữa trụ sở Barcelona và nhiều khu vực toàn cầu.
Đọc thêm


