
USD/CAD Price Forecast: Tests upper descending wedge boundary near 1.3800
Bởi Akhtar Faruqui
Ngày xuất bản: 17 Dec 2025 | Ngày chỉnh sửa: 17 Dec 2025


BÀI VIẾT PHỔ BIẾN

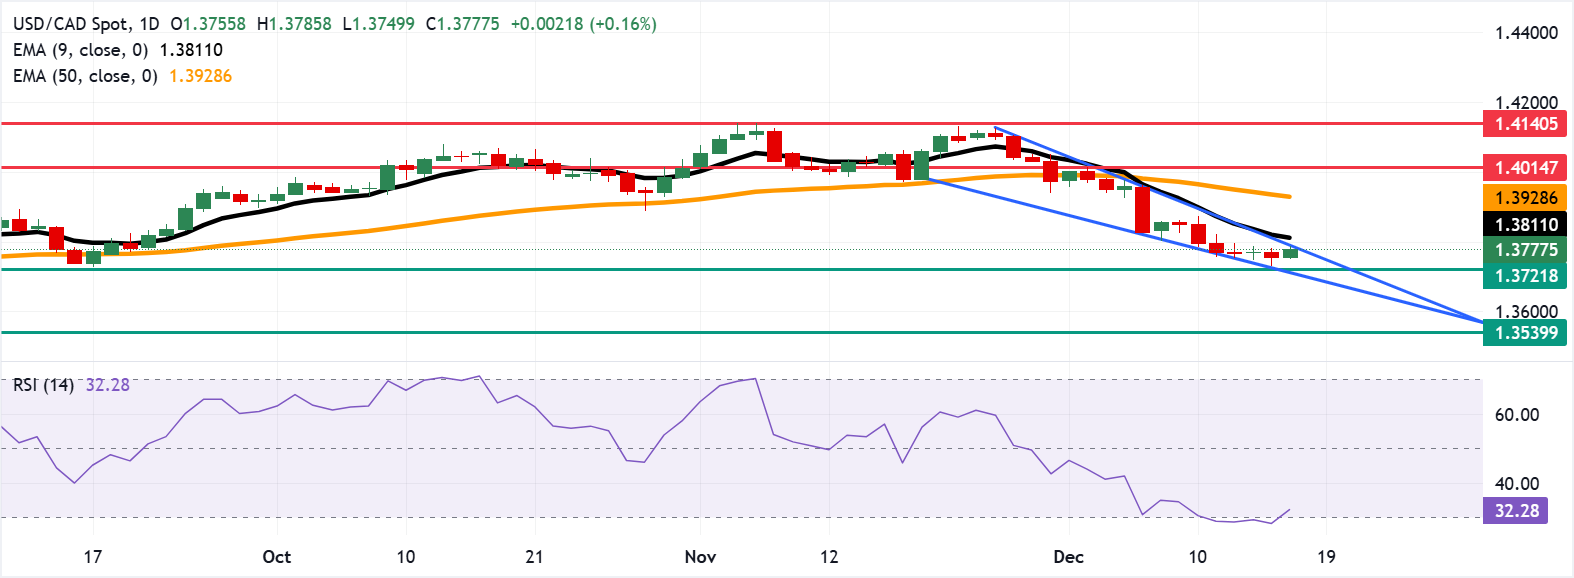
USD/CAD gains ground after registering modest losses in the previous session, trading around 1.3780 during the European hours on Wednesday. The daily chart suggests a potential upside breakout, with falling, converging trendlines forming a bullish descending wedge pattern.
- USD/CAD could find primary support at the four-month low of 1.3721.
- The 14-day RSI at 33 stays below its midline, rebounding from oversold levels but limiting upside momentum.
- The pair tests the upper descending wedge boundary near 1.3790, followed by the 1.3800.
USD/CAD gains ground after registering modest losses in the previous session, trading around 1.3780 during the European hours on Wednesday. The daily chart suggests a potential upside breakout, with falling, converging trendlines forming a bullish descending wedge pattern.
However, the USD/CAD pair stays under the descending nine-day Exponential Moving Average (EMA) and the 50-day EMA, reinforcing a bearish bias. The short-term average remains below the 50-day EMA, keeping sellers in control.
Moving averages slope lower, and price action remains capped by the nine-day EMA, signaling a persistent downtrend. A recovery through the short-term average could trigger a corrective bounce. The 14-day Relative Strength Index (RSI) at 33 remains below its midline after rebounding from oversold but capping upside momentum.
The initial support appears at the four-month low of 1.3721, followed by the lower boundary of the descending wedge around 1.3710. Further support lies at the psychological level of 1.3700. A break below this level would put downward pressure on the USD/CAD pair to navigate the region around 1.3539, the lowest level since October 2024.
On the upside, the USD/CAD pair tests the upper descending wedge boundary around 1.3790, followed by the psychological level of 1.3800 and the nine-day EMA at 1.3811. A break above this confluence resistance zone could trigger a rebound and support the pair to target the 50-day EMA at 1.3928. Further barrier lies at the three-week high of 1.4014.
Canadian Dollar Price Today
The table below shows the percentage change of Canadian Dollar (CAD) against listed major currencies today. Canadian Dollar was the weakest against the US Dollar.
| USD | EUR | GBP | JPY | CAD | AUD | NZD | CHF | |
|---|---|---|---|---|---|---|---|---|
| USD | 0.25% | 0.74% | 0.45% | 0.15% | 0.20% | 0.19% | 0.32% | |
| EUR | -0.25% | 0.50% | 0.18% | -0.10% | -0.05% | -0.06% | 0.07% | |
| GBP | -0.74% | -0.50% | -0.29% | -0.60% | -0.54% | -0.55% | -0.42% | |
| JPY | -0.45% | -0.18% | 0.29% | -0.30% | -0.25% | -0.27% | -0.13% | |
| CAD | -0.15% | 0.10% | 0.60% | 0.30% | 0.05% | 0.04% | 0.17% | |
| AUD | -0.20% | 0.05% | 0.54% | 0.25% | -0.05% | -0.01% | 0.12% | |
| NZD | -0.19% | 0.06% | 0.55% | 0.27% | -0.04% | 0.00% | 0.13% | |
| CHF | -0.32% | -0.07% | 0.42% | 0.13% | -0.17% | -0.12% | -0.13% |
The heat map shows percentage changes of major currencies against each other. The base currency is picked from the left column, while the quote currency is picked from the top row. For example, if you pick the Canadian Dollar from the left column and move along the horizontal line to the US Dollar, the percentage change displayed in the box will represent CAD (base)/USD (quote).
(The technical analysis of this story was written with the help of an AI tool.)

Hơn một triệu người dùng dựa vào FXStreet để có dữ liệu thị trường thời gian thực, công cụ biểu đồ, góc nhìn chuyên gia và tin tức Forex. Lịch kinh tế toàn diện và các hội thảo web giáo dục giúp nhà giao dịch luôn cập nhật và đưa ra quyết định có tính toán. FXStreet có khoảng 60 nhân sự, chia giữa trụ sở Barcelona và nhiều khu vực toàn cầu.
Đọc thêm


