
USD/CHF Price Analysis: Faces stiff resistance, retreats below 0.8000
Bởi Christian Borjon Valencia
Đã cập nhật: 7 Apr 2026


BÀI VIẾT PHỔ BIẾN

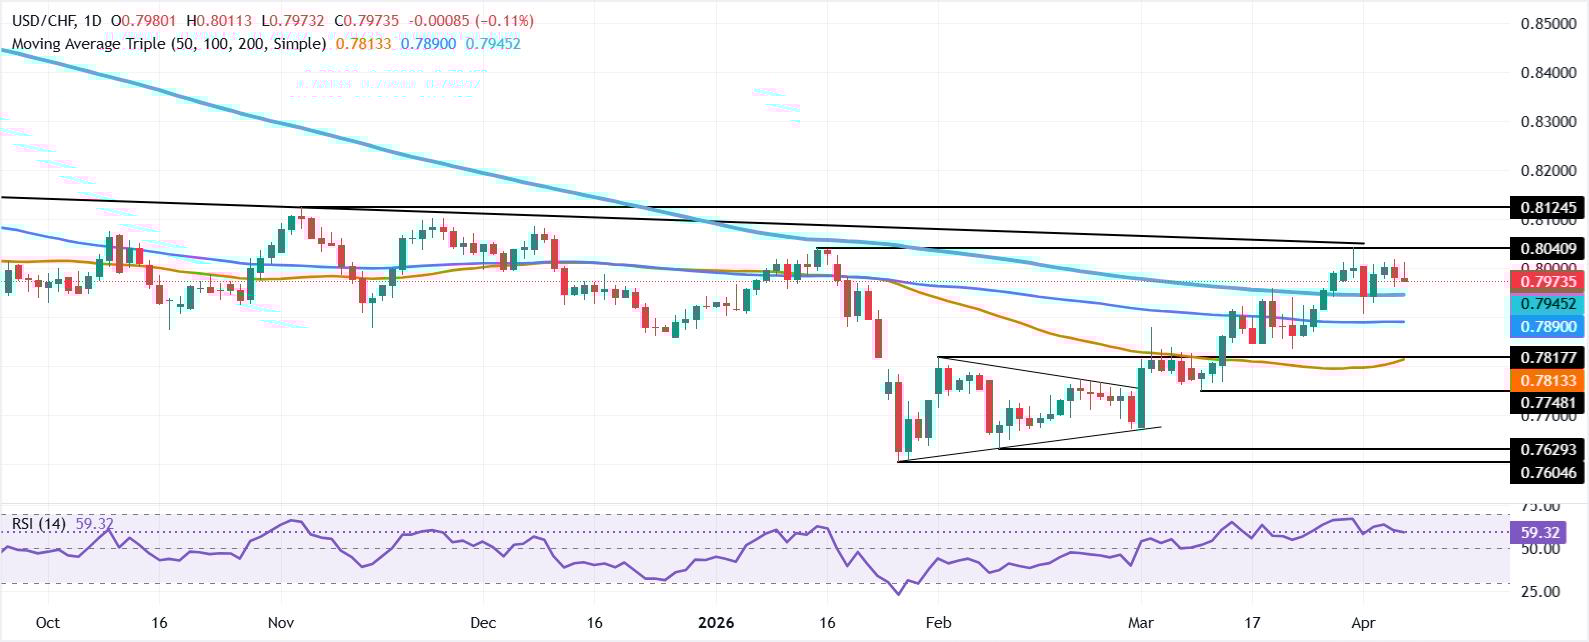
USD/CHF trims some of its earlier gains as the market mood improved on a Reuters headline that a Senior Iranian official said Tehran is reviewing positively Pakistan’s two-week ceasefire proposal, which pushed US equities higher.
- USD/CHF trims gains as risk sentiment improves on ceasefire hopes.
- RSI remains bullish, signaling buyers still control overall trend.
- Break above 0.8000 targets 0.8042 and 0.8100 resistance levels.
USD/CHF trims some of its earlier gains as the market mood improved on a Reuters headline that a Senior Iranian official said Tehran is reviewing positively Pakistan’s two-week ceasefire proposal, which pushed US equities higher. At the time of writing, the pair edges towards its opening price, up 0.08% at 0.7978.
USD/CHF Price Analysis: Technical Outlook
The USD/CHF technical picture appears constructive, but a failure to clear 0.8000 is exacerbating a pullback towards 0.7950. Price action suggests that the uptrend is intact, as the series of subsequent higher highs and higher lows remains intact, but a break below the 200-day Simple Moving Average (SMA) at 0.7941 could put the uptrend at risk. A breach of the latter will expose the 20-day SMA at 0.7918, followed by the April 1 low of 0.7904.
Conversely, if USD/CHF rises above 0.8000, this opens the door for further upside. The next area of interest will be the March 31 swing high at 0.8042, followed by the 0.8100 mark.
Momentum-wise, the Relative Strength Index (RSI) is bullish, suggesting buyers remain in charge.
USD/CHF Price Chart — Daily
Swiss Franc Price Today
The table below shows the percentage change of Swiss Franc (CHF) against listed major currencies today. Swiss Franc was the strongest against the US Dollar.
| USD | EUR | GBP | JPY | CAD | AUD | NZD | CHF | |
|---|---|---|---|---|---|---|---|---|
| USD | -0.53% | -0.47% | -0.10% | -0.15% | -0.82% | -0.30% | -0.12% | |
| EUR | 0.53% | 0.06% | 0.41% | 0.34% | -0.31% | 0.23% | 0.42% | |
| GBP | 0.47% | -0.06% | 0.36% | 0.29% | -0.32% | 0.18% | 0.37% | |
| JPY | 0.10% | -0.41% | -0.36% | -0.06% | -0.72% | -0.20% | -0.01% | |
| CAD | 0.15% | -0.34% | -0.29% | 0.06% | -0.66% | -0.15% | 0.06% | |
| AUD | 0.82% | 0.31% | 0.32% | 0.72% | 0.66% | 0.51% | 0.72% | |
| NZD | 0.30% | -0.23% | -0.18% | 0.20% | 0.15% | -0.51% | 0.21% | |
| CHF | 0.12% | -0.42% | -0.37% | 0.01% | -0.06% | -0.72% | -0.21% |
The heat map shows percentage changes of major currencies against each other. The base currency is picked from the left column, while the quote currency is picked from the top row. For example, if you pick the Swiss Franc from the left column and move along the horizontal line to the US Dollar, the percentage change displayed in the box will represent CHF (base)/USD (quote).

Hơn một triệu người dùng dựa vào FXStreet để có dữ liệu thị trường thời gian thực, công cụ biểu đồ, góc nhìn chuyên gia và tin tức Forex. Lịch kinh tế toàn diện và các hội thảo web giáo dục giúp nhà giao dịch luôn cập nhật và đưa ra quyết định có tính toán. FXStreet có khoảng 60 nhân sự, chia giữa trụ sở Barcelona và nhiều khu vực toàn cầu.
Đọc thêm


