
USD/CHF Price Forecast: Struggles at 0.7800, dives below 50-day SMA
Bởi Christian Borjon Valencia
Ngày xuất bản: 7 Mar 2026 | Ngày chỉnh sửa: 7 Mar 2026


BÀI VIẾT PHỔ BIẾN

The USD/CHF pair retreats on Friday during the North American session, down 0.53% as the Greenback weakens following a dismal jobs report, and a break to four day low beneath the 0.7800 figure.
- USD/CHF drops 0.53% to 0.7771 as weak US jobs data pressures the Dollar.
- Break below 0.7700 could expose trendline support near 0.7670 and 0.7601.
- Reclaiming 0.7800 would target 0.7878 and the 100-day SMA at 0.7905.
The USD/CHF pair retreats on Friday during the North American session, down 0.53% as the Greenback weakens following a dismal jobs report, and a break to four day low beneath the 0.7800 figure. At the time of writing, the pair trades at 0.7771, yet it remains to end the week with gains of more than 1%.
USD/CHF Price Forecast: Technical outlook
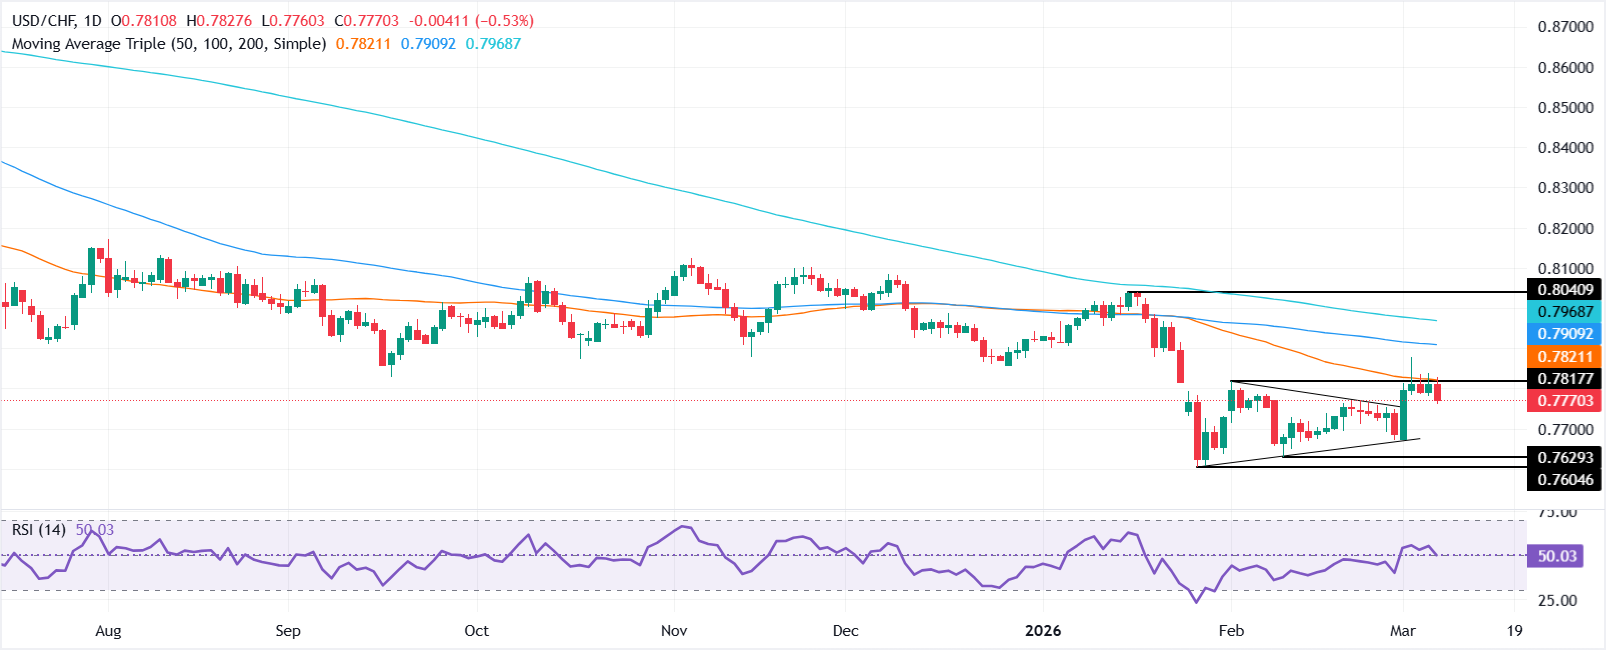
The technical picture shows USD/CHF remaining downward biased as the pair failed to clear 0.7800, opening the door for further downside. Momentum has begun to shift slightly negatively, as depicted by the Relative Strength Index (RSI), about to clear its neutral level. That said, the path of least resistance is tilted to the downside.
The first area of demand will be a support trendline drawn from current year lows of around 0.7601, which passes near the 0.7670-0.7700 range. A breach of the latter will expose the January 28 swing low of 0.7606.
On the other hand, if USD/CHF reclaims 0.7800, expect a test of the March 3 swing high at 0.7878. On further strength, the next area of interest will be the 100-day Simple Moving Average (SMA) at 0.7905.
USD/CHF Price Chart – Daily
US Dollar Price Today
The table below shows the percentage change of US Dollar (USD) against listed major currencies today. US Dollar was the strongest against the Japanese Yen.
| USD | EUR | GBP | JPY | CAD | AUD | NZD | CHF | |
|---|---|---|---|---|---|---|---|---|
| USD | 0.02% | -0.23% | 0.16% | -0.60% | -0.16% | 0.00% | -0.52% | |
| EUR | -0.02% | -0.27% | 0.15% | -0.63% | -0.19% | -0.03% | -0.55% | |
| GBP | 0.23% | 0.27% | 0.40% | -0.37% | 0.08% | 0.23% | -0.29% | |
| JPY | -0.16% | -0.15% | -0.40% | -0.77% | -0.33% | -0.19% | -0.70% | |
| CAD | 0.60% | 0.63% | 0.37% | 0.77% | 0.43% | 0.59% | 0.08% | |
| AUD | 0.16% | 0.19% | -0.08% | 0.33% | -0.43% | 0.16% | -0.36% | |
| NZD | -0.00% | 0.03% | -0.23% | 0.19% | -0.59% | -0.16% | -0.52% | |
| CHF | 0.52% | 0.55% | 0.29% | 0.70% | -0.08% | 0.36% | 0.52% |
The heat map shows percentage changes of major currencies against each other. The base currency is picked from the left column, while the quote currency is picked from the top row. For example, if you pick the US Dollar from the left column and move along the horizontal line to the Japanese Yen, the percentage change displayed in the box will represent USD (base)/JPY (quote).

Hơn một triệu người dùng dựa vào FXStreet để có dữ liệu thị trường thời gian thực, công cụ biểu đồ, góc nhìn chuyên gia và tin tức Forex. Lịch kinh tế toàn diện và các hội thảo web giáo dục giúp nhà giao dịch luôn cập nhật và đưa ra quyết định có tính toán. FXStreet có khoảng 60 nhân sự, chia giữa trụ sở Barcelona và nhiều khu vực toàn cầu.
Đọc thêm


