
USD/JPY Price Forecast: Reclaims 159.00 but RSI divergence caps upside
Bởi Christian Borjon Valencia
Đã cập nhật: 16 Apr 2026


BÀI VIẾT PHỔ BIẾN

The USD/JPY reclaims the 159.00 figure after reaching a weekly low of 158.26 amid mixed economic data in the US, strengthening the US Dollar, which rose to a two-day high of 98.29 according to the US Dollar Index (DXY). At the time of writing, the pair trades at 159.17, up 0.11%.
- USD/JPY rebounds above 159.00 after testing weekly lows near 158.26.
- RSI trends lower toward 50, signaling weakening bullish momentum.
- Break above 159.50 targets 160.00 and 160.46 resistance levels.
The USD/JPY reclaims the 159.00 figure after reaching a weekly low of 158.26 amid mixed economic data in the US, strengthening the US Dollar, which rose to a two-day high of 98.29 according to the US Dollar Index (DXY). At the time of writing, the pair trades at 159.17, up 0.11%.
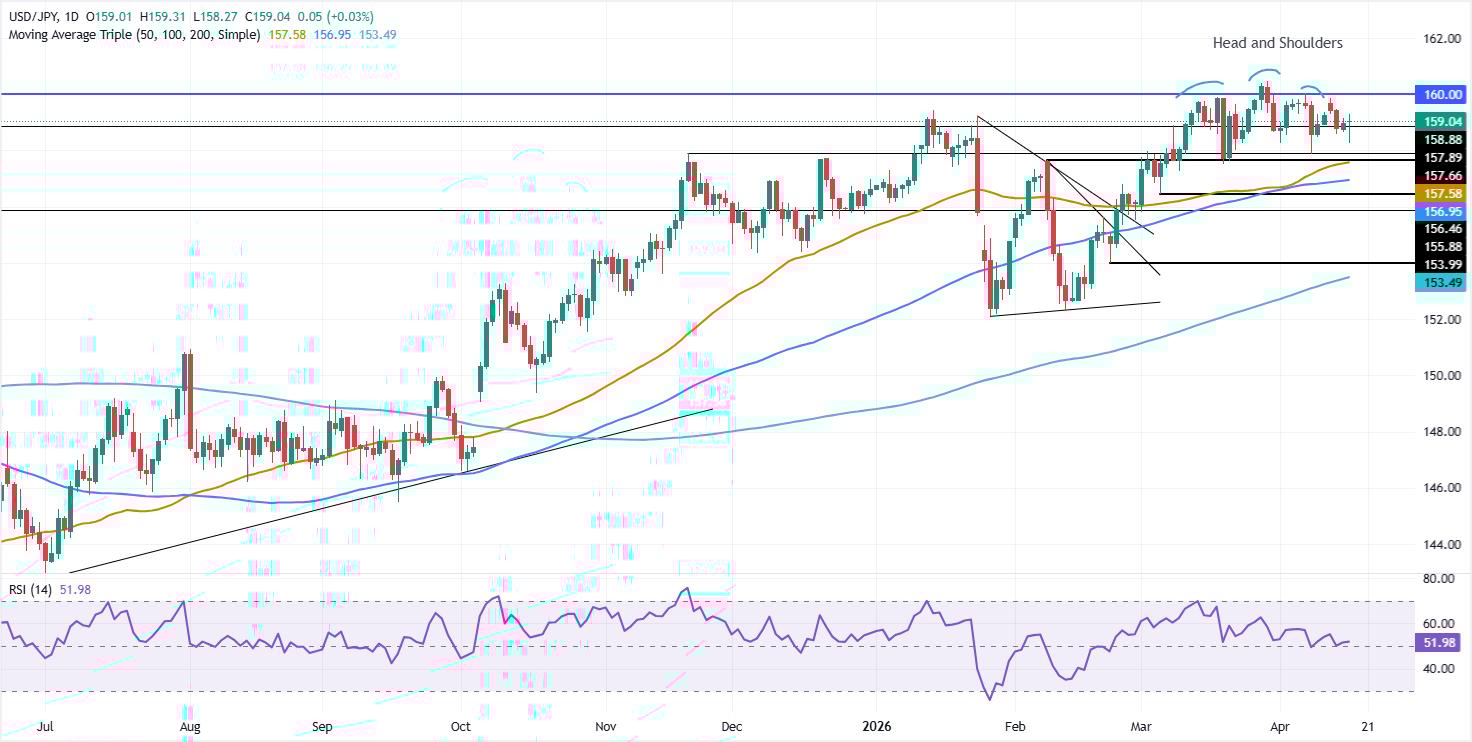
USD/JPY Price Forecast: Technical Outlook
The USD/JPY pair remains upwardly biased, but verbal intervention by Japanese authorities could prevent the pair from testing the 160.00 figure and the subsequent year-to-date (YTD) high at 160.46.
Worth noting that momentum remains bullish, according to the Relative Strength Index (RSI), but over the last sessions, it has been trending lower, about to cross below the index’s neutral level, hinting that sellers are stepping up.
However, if USD/JPY extends its gains past 159.50, a test of the 160.00 is on the cards. Once surpassed, the next area of interest would be the YTD high at 160.46, followed by July 10, 2024, at 161.81.
On the downside, the first support is 159.00, ahead of diving towards the day’s low of 158.26. Below this are the 50-day Simple Moving Average (SMA) at 157.61 and the 100-day SMA at 156.97.
USD/JPY Price Chart – Daily
Japanese Yen Price Today
The table below shows the percentage change of Japanese Yen (JPY) against listed major currencies today. Japanese Yen was the strongest against the New Zealand Dollar.
| USD | EUR | GBP | JPY | CAD | AUD | NZD | CHF | |
|---|---|---|---|---|---|---|---|---|
| USD | 0.10% | 0.19% | 0.03% | -0.30% | 0.11% | 0.39% | 0.16% | |
| EUR | -0.10% | 0.08% | -0.06% | -0.37% | 0.02% | 0.26% | 0.06% | |
| GBP | -0.19% | -0.08% | -0.13% | -0.50% | -0.08% | 0.16% | -0.03% | |
| JPY | -0.03% | 0.06% | 0.13% | -0.34% | 0.08% | 0.29% | 0.12% | |
| CAD | 0.30% | 0.37% | 0.50% | 0.34% | 0.41% | 0.66% | 0.47% | |
| AUD | -0.11% | -0.02% | 0.08% | -0.08% | -0.41% | 0.24% | 0.07% | |
| NZD | -0.39% | -0.26% | -0.16% | -0.29% | -0.66% | -0.24% | -0.20% | |
| CHF | -0.16% | -0.06% | 0.03% | -0.12% | -0.47% | -0.07% | 0.20% |
The heat map shows percentage changes of major currencies against each other. The base currency is picked from the left column, while the quote currency is picked from the top row. For example, if you pick the Japanese Yen from the left column and move along the horizontal line to the US Dollar, the percentage change displayed in the box will represent JPY (base)/USD (quote).

Hơn một triệu người dùng dựa vào FXStreet để có dữ liệu thị trường thời gian thực, công cụ biểu đồ, góc nhìn chuyên gia và tin tức Forex. Lịch kinh tế toàn diện và các hội thảo web giáo dục giúp nhà giao dịch luôn cập nhật và đưa ra quyết định có tính toán. FXStreet có khoảng 60 nhân sự, chia giữa trụ sở Barcelona và nhiều khu vực toàn cầu.
Đọc thêm


