
Zcash, Near Protocol, Hyperliquid regain bullish momentum after Arthur Hayes exit
Bởi Vishal Dixit
Đã cập nhật: 16 Jun 2026


BÀI VIẾT PHỔ BIẾN

Zcash (ZEC), NEAR Protocol, and Hyperliquid (HYPE) edge higher on Tuesday, extending their recovery so far this week. Retail and institutional demand heats up for altcoins, fueling a rebound as prices fully absorb the impact of Arthur Hayes's exit.
- Zcash, NEAR Protocol, and Hyperliquid edge higher on Tuesday, extending their short-term recovery.
- A rebound in Open Interest for ZEC, NEAR, and HYPE reflects renewed retail participation in derivatives markets.
- The recovery in Hayes’ trinity after his exit reflects further upside potential as fundamentals remain largely unchanged.
Zcash (ZEC), NEAR Protocol, and Hyperliquid (HYPE) edge higher on Tuesday, extending their recovery so far this week. Retail and institutional demand heats up for altcoins, fueling a rebound as prices fully absorb the impact of Arthur Hayes's exit.
Demand revives week for Trinity after Arthur Hayes exit
Arthur Hayes dumped all his holdings of Hyperliquid and NEAR Protocol earlier this month, followed by Zcash due to the counterfeiting vulnerability exposed in Zcash’s Orchard Shielded Pool. More than a week after his exit, these altcoins reflect a nearly synchronized V-shaped reversal.
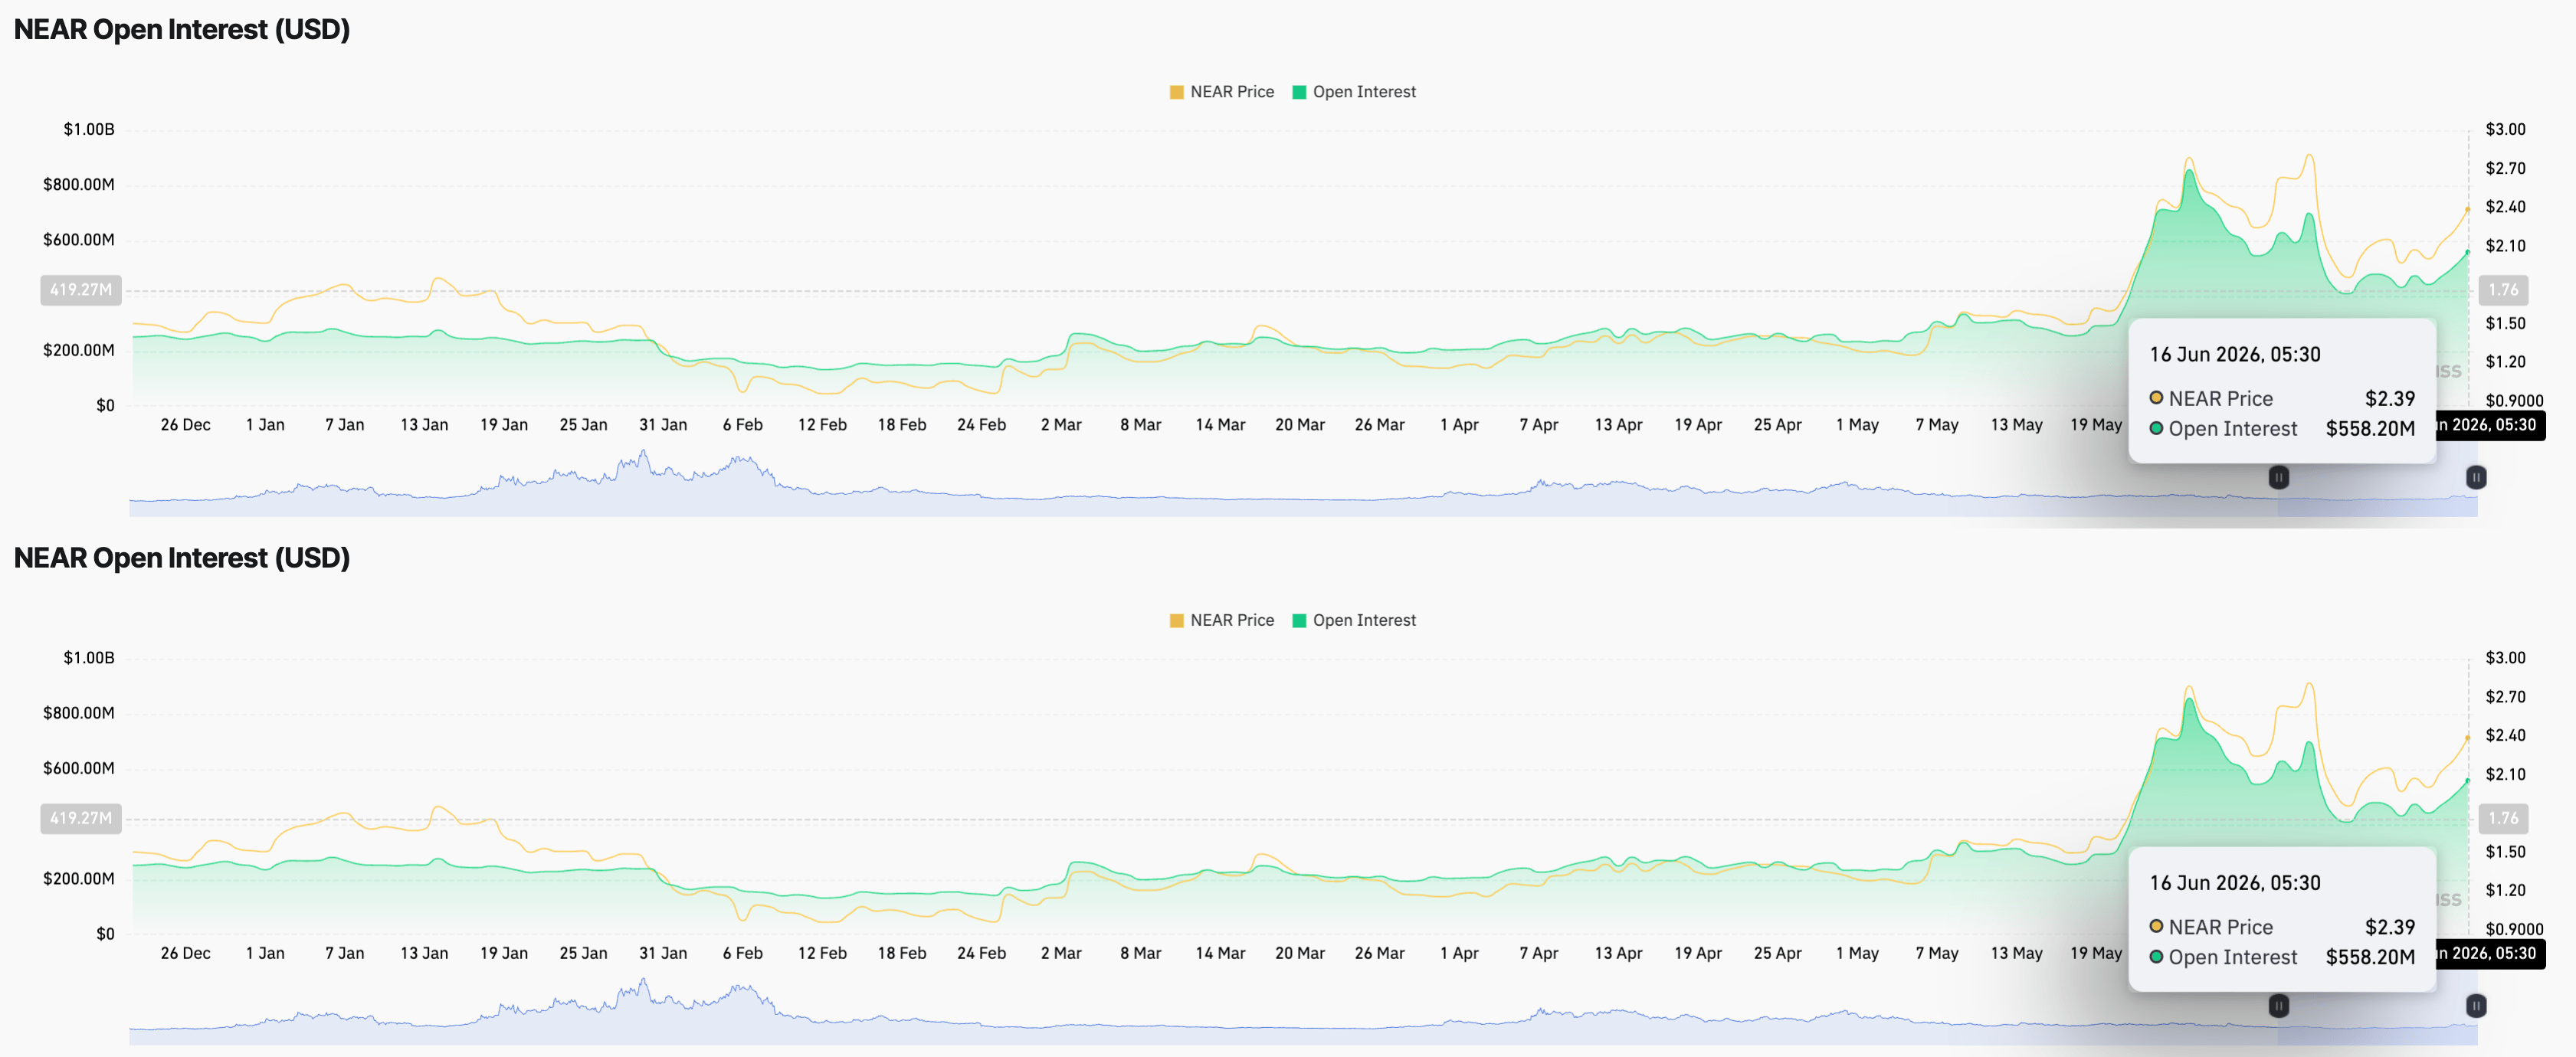
Retail interest rebuilds in the ZEC, NEAR, and HYPE futures amid the minor rebound. CoinGlass data show ZEC and NEAR Open Interest (OI) rising to $1.24 billion and $558.20 million, respectively, reflecting an upward tick in the OI charts, closing toward last month's $1.67 billion and $857.21 million peaks.
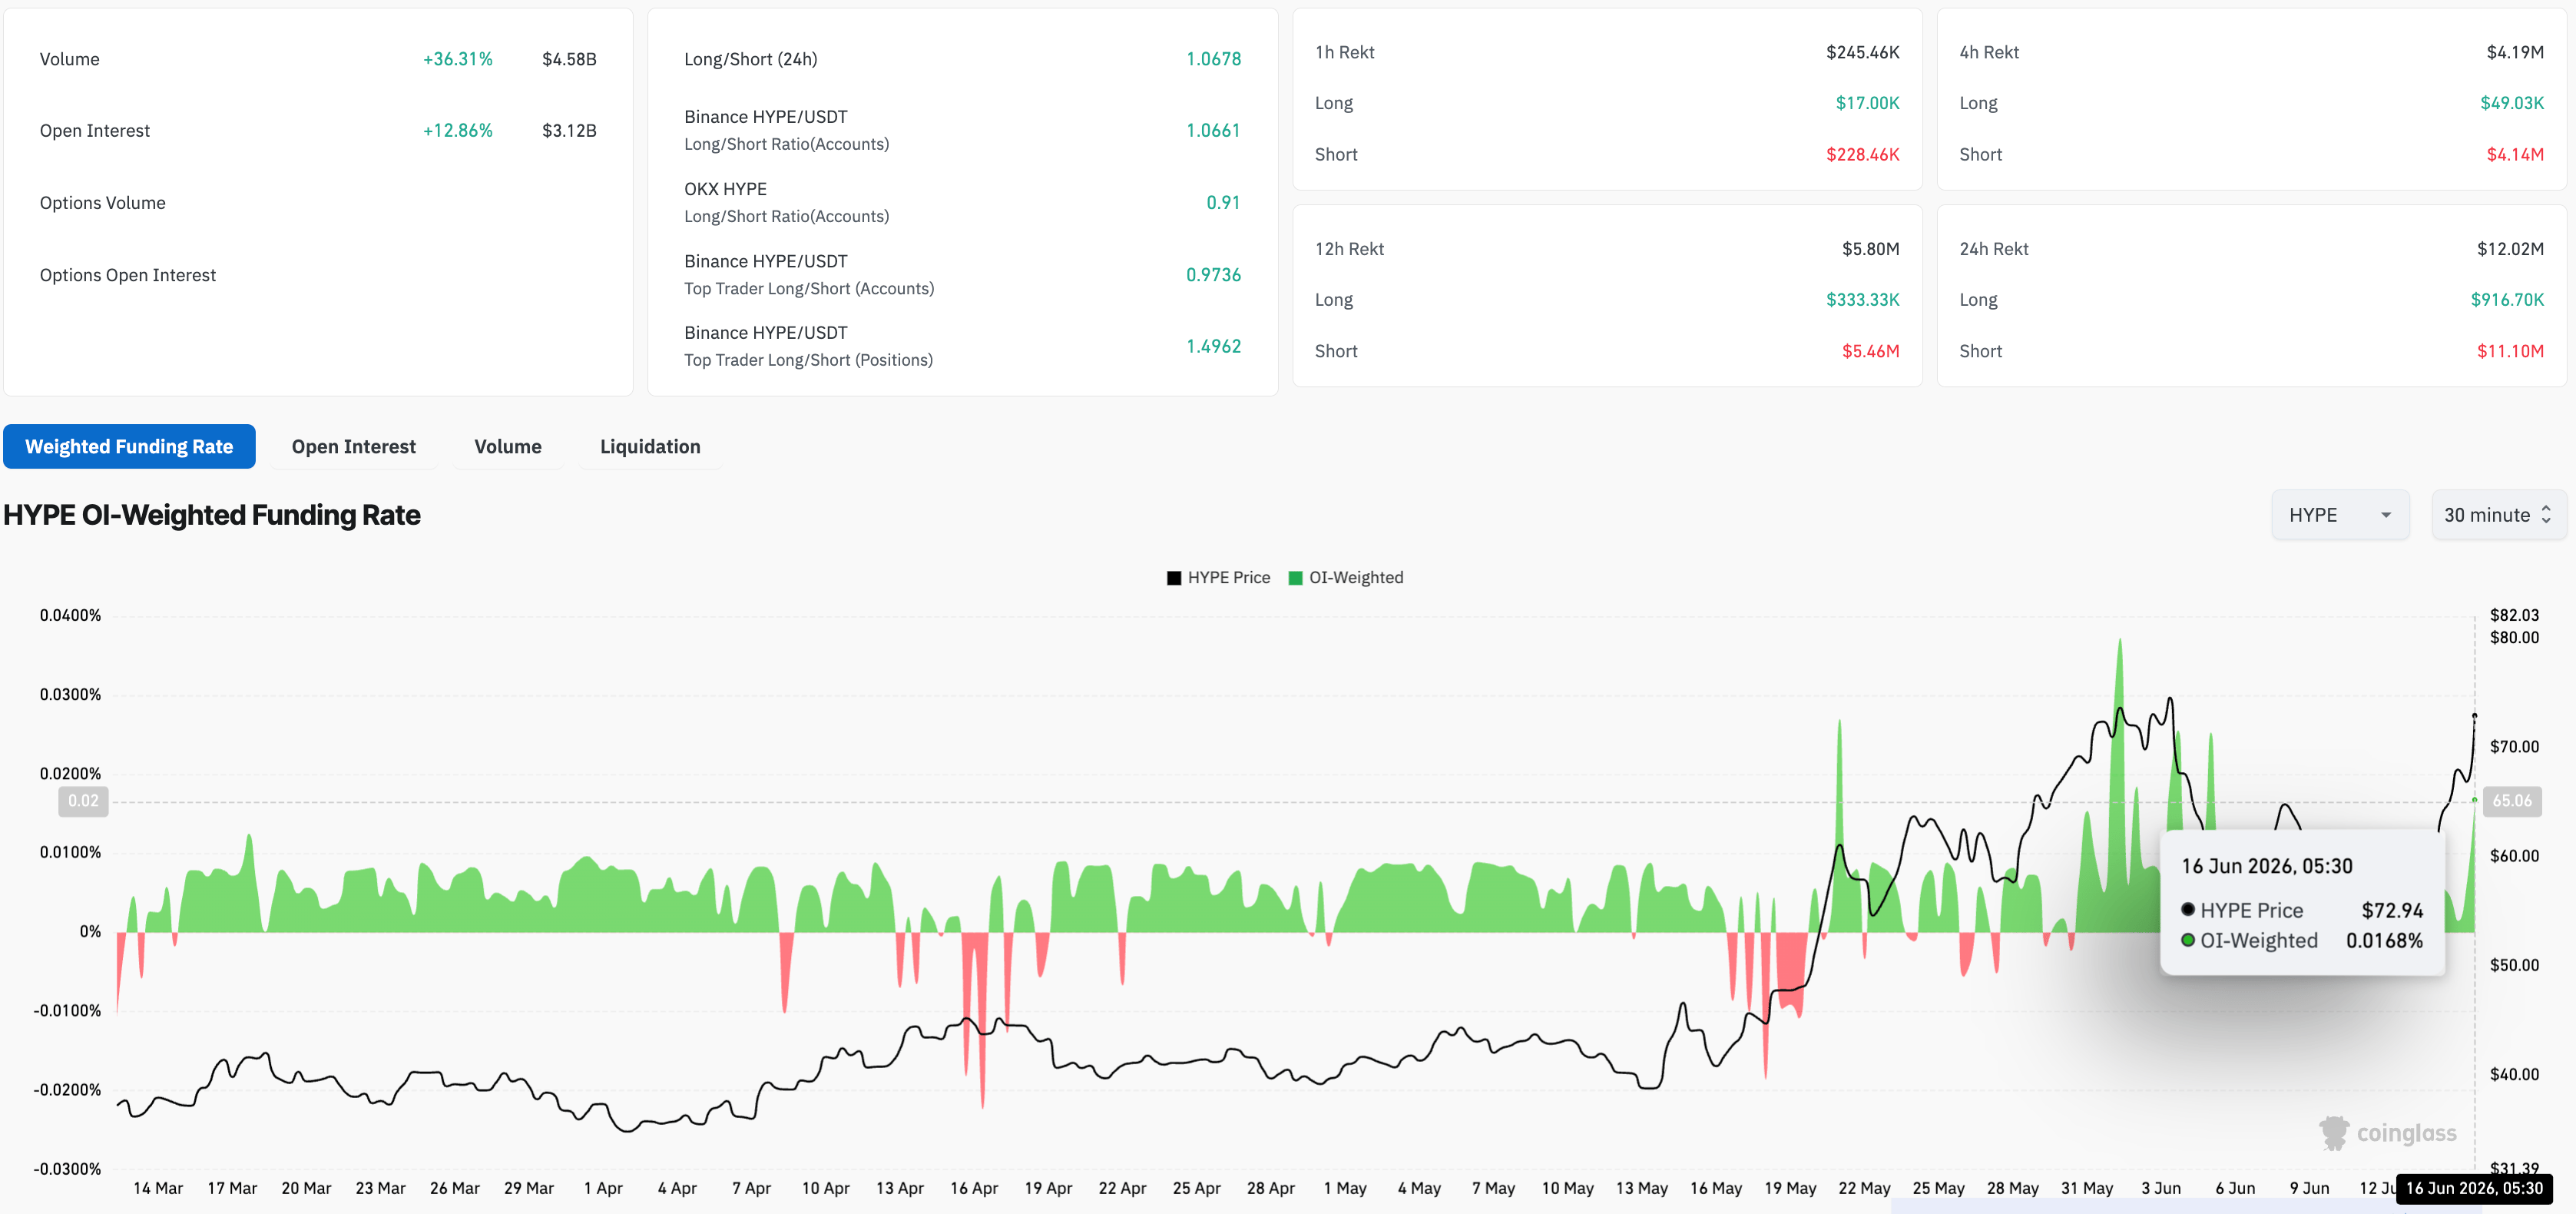
In the case of Hyperliquid, OI is up roughly 13% to $3.12 billion on Monday, while the institutional support resurfaces. SoSoValue data show that HYPE-focused ETFs recorded $17.19 million in inflows, supporting its 4% gains on Monday.
Zcash extends steady recovery above $500
Zcash hovers above $500 at press time on Tuesday, holding a constructive bullish bias as it remains well above the 50-, 100-, and 200-day Exponential Moving Averages (EMAs) clustered between roughly $375 and $480.
The 78.6% Fibonacci retracement at $595, measured over the downswing from $690 to $250, now underpins the advance as nearby resistance. A decisive close above this zone could open the path toward the $800 mark.
Momentum gradually gains strength on the daily chart, with the Moving Average Convergence Divergence (MACD) crossing above the signal line, while the Relative Strength Index (RSI) at 54 hint that positive momentum is building without yet reaching overbought conditions.
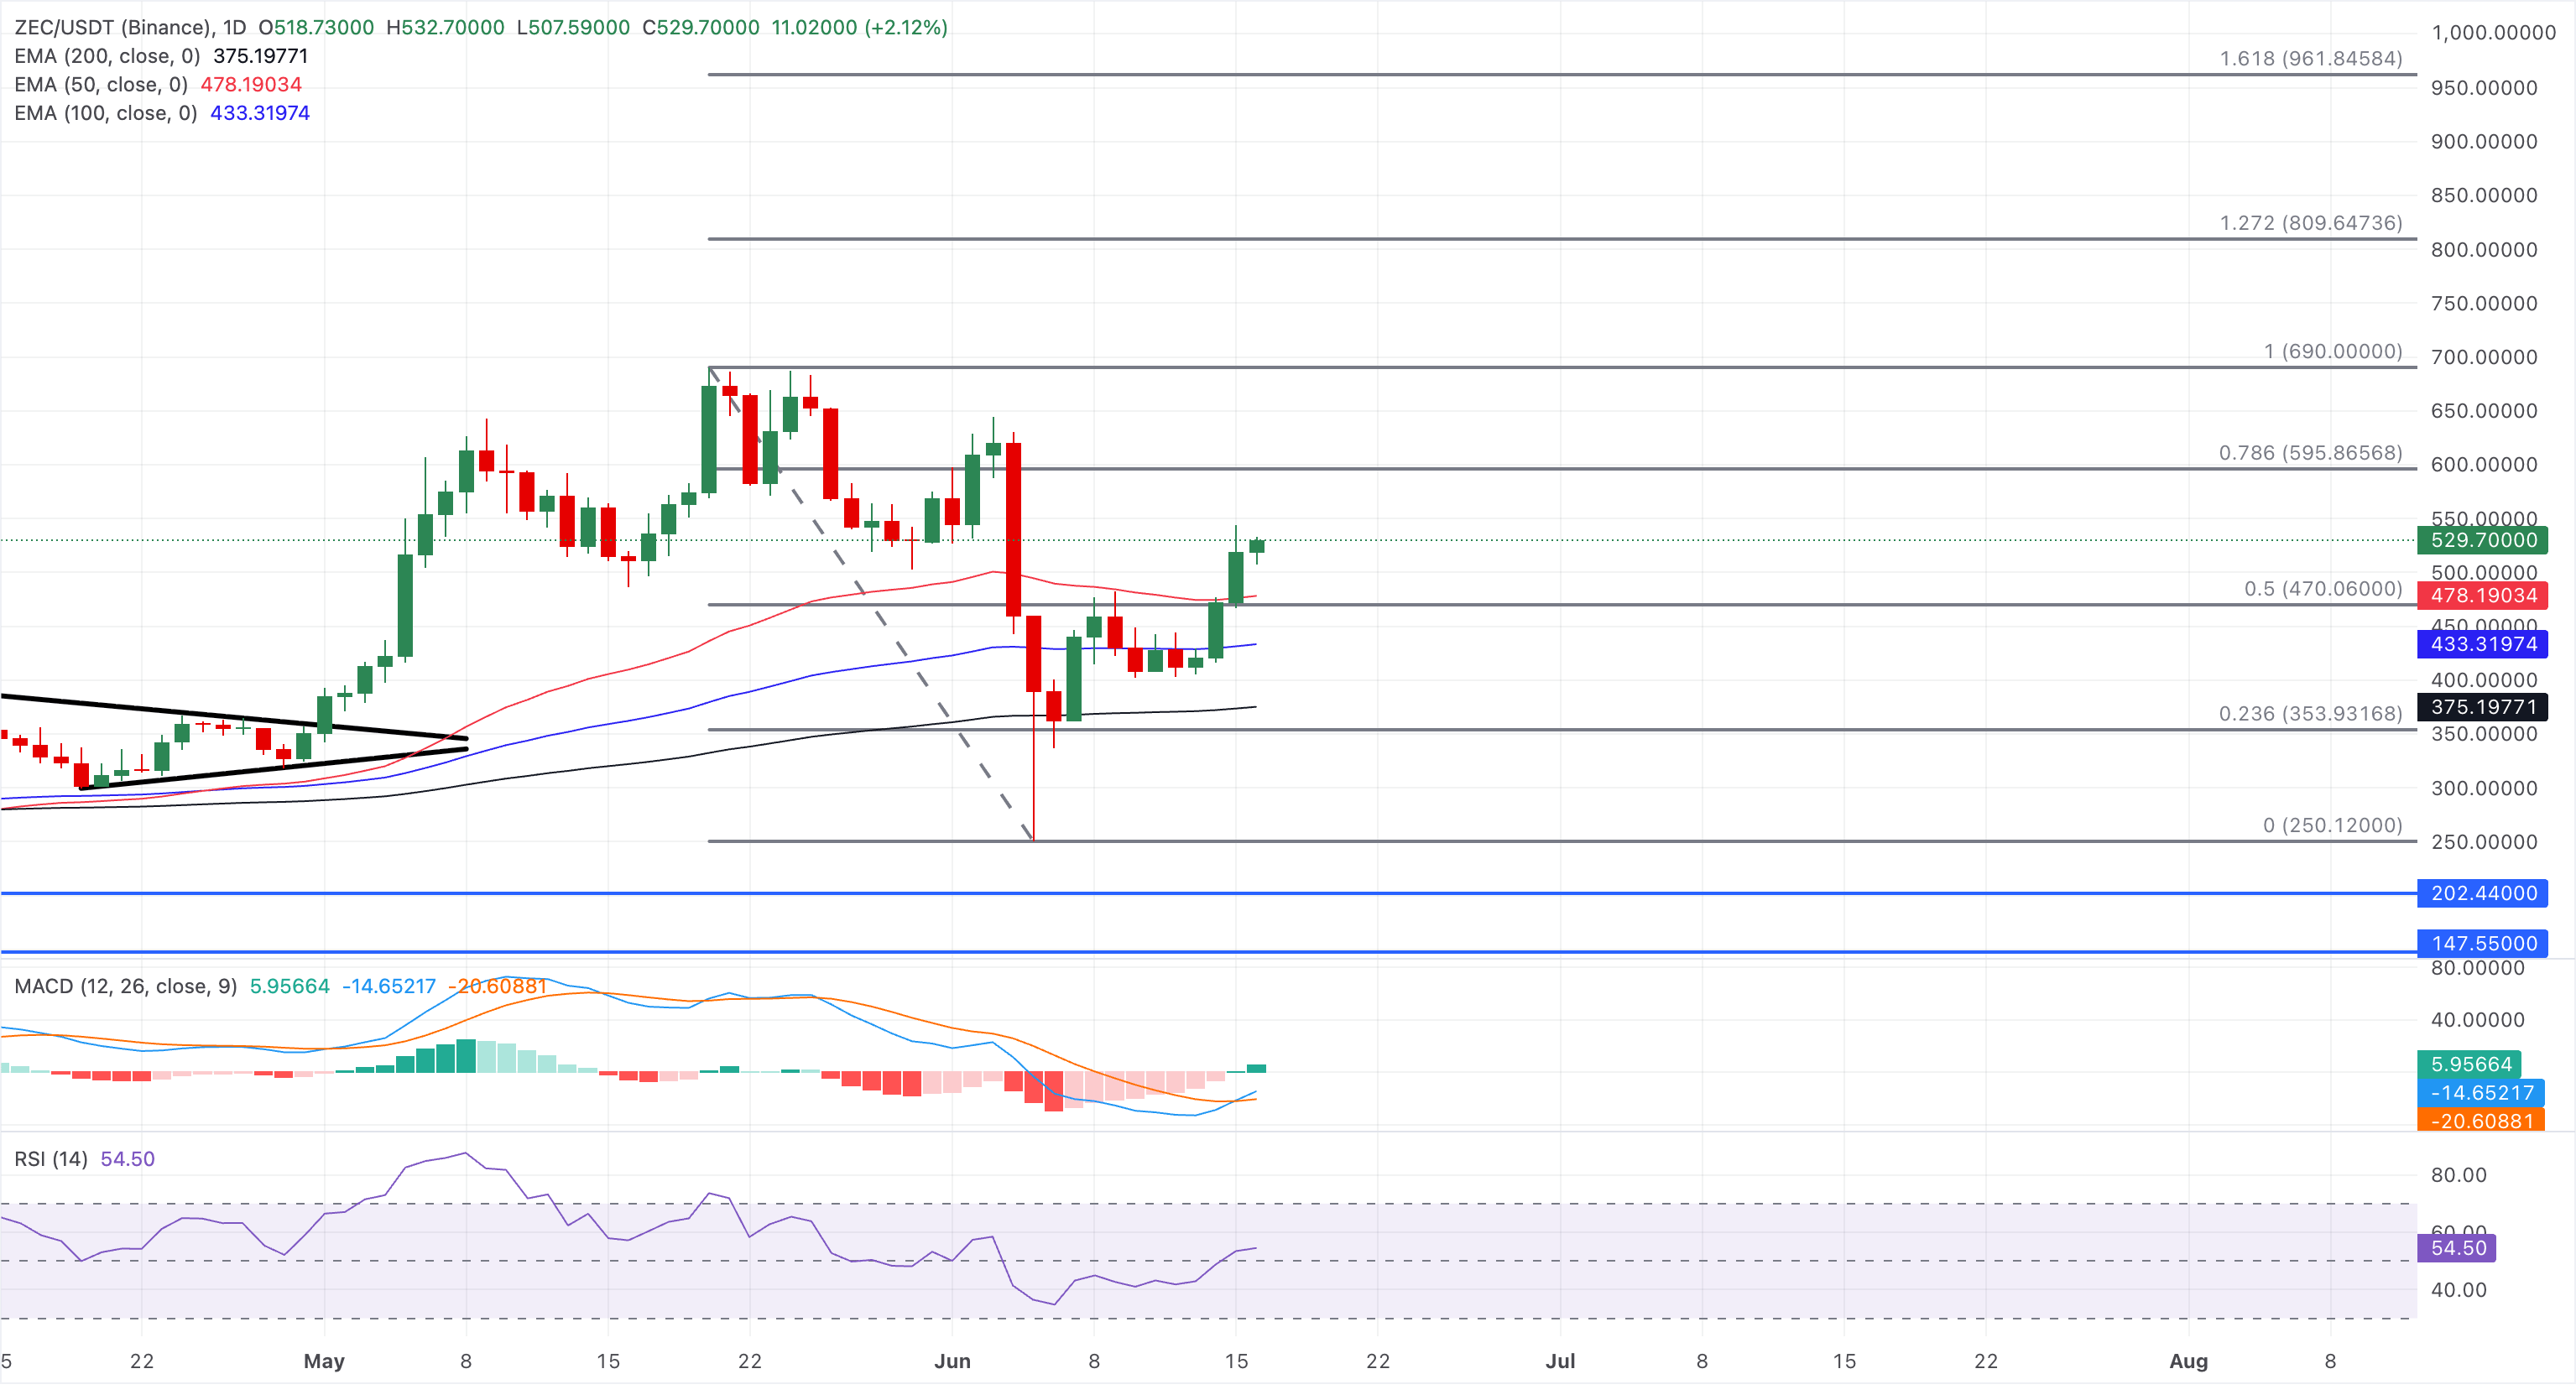
Looking down, the $500 psychological mark, close to the 50-day EMA at $478, serves as a crucial support zone, followed by the 50% retracement level at $470 and the 100-day EMA at $433.
NEAR Protocol extends recovery to $2.50
NEAR Protocol edges higher by over 4% at press time on Tuesday, approaching the $2.50 mark with its fourth consecutive day of rally. The AI token holds a constructive bullish bias as price sits well above the 50-, 100-, and 200-day EMAs clustered between roughly $1.74 and $1.98. This positioning suggests the broader uptrend remains intact, while the RSI at around 60 on the daily chart indicates positive but not overextended momentum. Meanwhile, the MACD is on the verge of crossing above its signal line, hinting that bullish pressure may be rebuilding.
The 78.6% Fibonacci retracement level at $2.68, followed by the $3.18 peak from November 8 serve as overhead barriers.
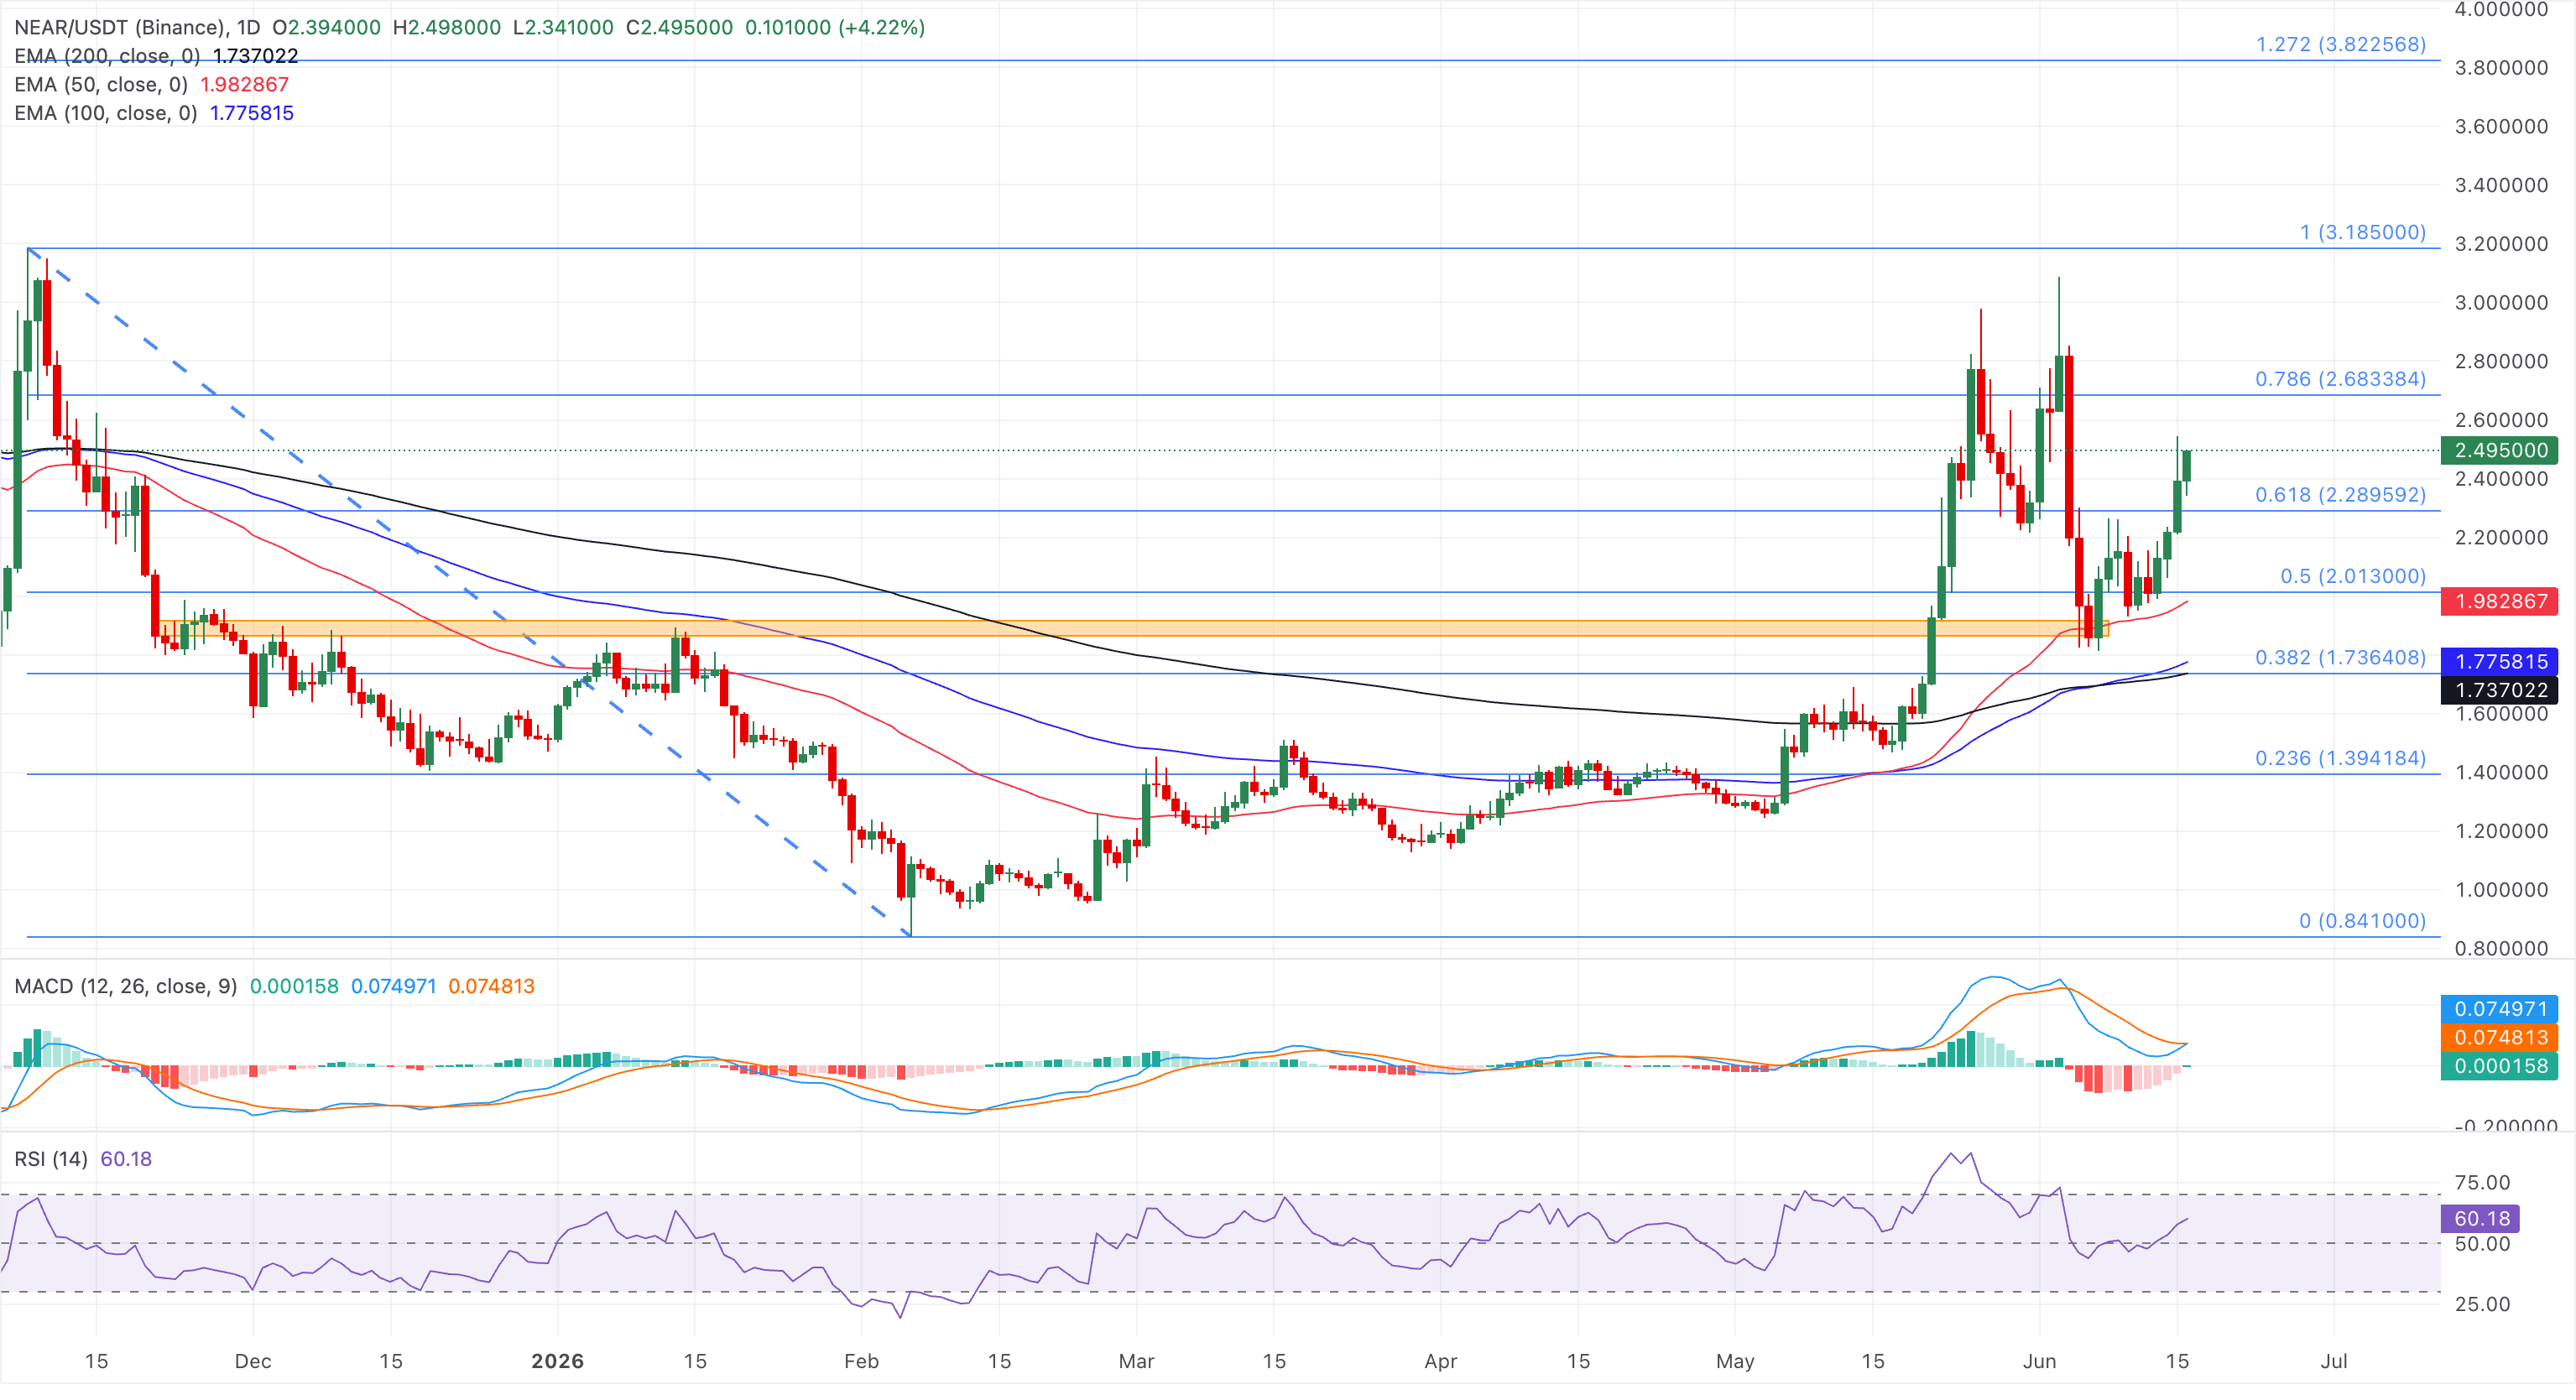
On the downside, initial support is seen at the 61.8% Fibonacci retracement at $2.28, with further reinforcement from the 50% retracement near $2.01 and the 50-day EMA at $1.98.
Hyperliquid rally targets a new record high
Hyperliquid trades above $70 at the time of writing on Tuesday, extending gains for the sixth consecutive day. The rebound in HYPE from the 50-day EMA last week now forms a V-shaped reversal on the daily chart, targeting the $75.76 level.
From a technical perspective, a daily close above this zone would drive HYPE into price discovery mode, potentially targeting the 127.2% and 161.8% Fibonacci retracement levels at $82.03 and $90.02, respectively.
Momentum remains strong on the daily chart, with the RSI rising to 64 and the MACD crossing above its signal line, reaffirming renewed bullishness.
Looking down, the 50% retracement at $64.21 serves as the primary support floor for HYPE, as sellers regain control around $75.
(The technical analysis of this story was written with the help of an AI tool.)
Crypto ETF FAQs
An Exchange-Traded Fund (ETF) is an investment vehicle or an index that tracks the price of an underlying asset. ETFs can not only track a single asset, but a group of assets and sectors. For example, a Bitcoin ETF tracks Bitcoin’s price. ETF is a tool used by investors to gain exposure to a certain asset.
Yes. The first Bitcoin futures ETF in the US was approved by the US Securities & Exchange Commission in October 2021. A total of seven Bitcoin futures ETFs have been approved, with more than 20 still waiting for the regulator’s permission. The SEC says that the cryptocurrency industry is new and subject to manipulation, which is why it has been delaying crypto-related futures ETFs for the last few years.
Yes. The SEC approved in January 2024 the listing and trading of several Bitcoin spot Exchange-Traded Funds, opening the door to institutional capital and mainstream investors to trade the main crypto currency. The decision was hailed by the industry as a game changer.
The main advantage of crypto ETFs is the possibility of gaining exposure to a cryptocurrency without ownership, reducing the risk and cost of holding the asset. Other pros are a lower learning curve and higher security for investors since ETFs take charge of securing the underlying asset holdings. As for the main drawbacks, the main one is that as an investor you can’t have direct ownership of the asset, or, as they say in crypto, “not your keys, not your coins.” Other disadvantages are higher costs associated with holding crypto since ETFs charge fees for active management. Finally, even though investing in ETFs reduces the risk of holding an asset, price swings in the underlying cryptocurrency are likely to be reflected in the investment vehicle too.

Hơn một triệu người dùng dựa vào FXStreet để có dữ liệu thị trường thời gian thực, công cụ biểu đồ, góc nhìn chuyên gia và tin tức Forex. Lịch kinh tế toàn diện và các hội thảo web giáo dục giúp nhà giao dịch luôn cập nhật và đưa ra quyết định có tính toán. FXStreet có khoảng 60 nhân sự, chia giữa trụ sở Barcelona và nhiều khu vực toàn cầu.
Đọc thêm


