
Zcash Price Forecast: ZEC risks a 30% drop as retail volume overheats the futures market
Bởi Vishal Dixit
Ngày xuất bản: 28 Nov 2025 | Ngày chỉnh sửa: 28 Nov 2025


BÀI VIẾT PHỔ BIẾN

Zcash (ZEC) extends the pullback by over 3% at press time on Friday, recording over 17% loss so far this week.
- Zcash edges lower by 4% on Friday, threatening the 50-day EMA at $435.
- Stagnation in shielded ZEC tokens signals a deceleration in demand for privacy coins.
- The rising retail volume in the futures and spot markets flashes a potential risk of large investors taking profits.
Zcash (ZEC) extends the pullback by over 3% at press time on Friday, recording over 17% loss so far this week. The second straight bearish week for the privacy coin comes on the back of stagnancy in shielded pools and the congested retail demand, which could serve as exit liquidity for large wallet investors looking to take profits.
Windless activity in Shielded ZEC pools warns of reduced demand
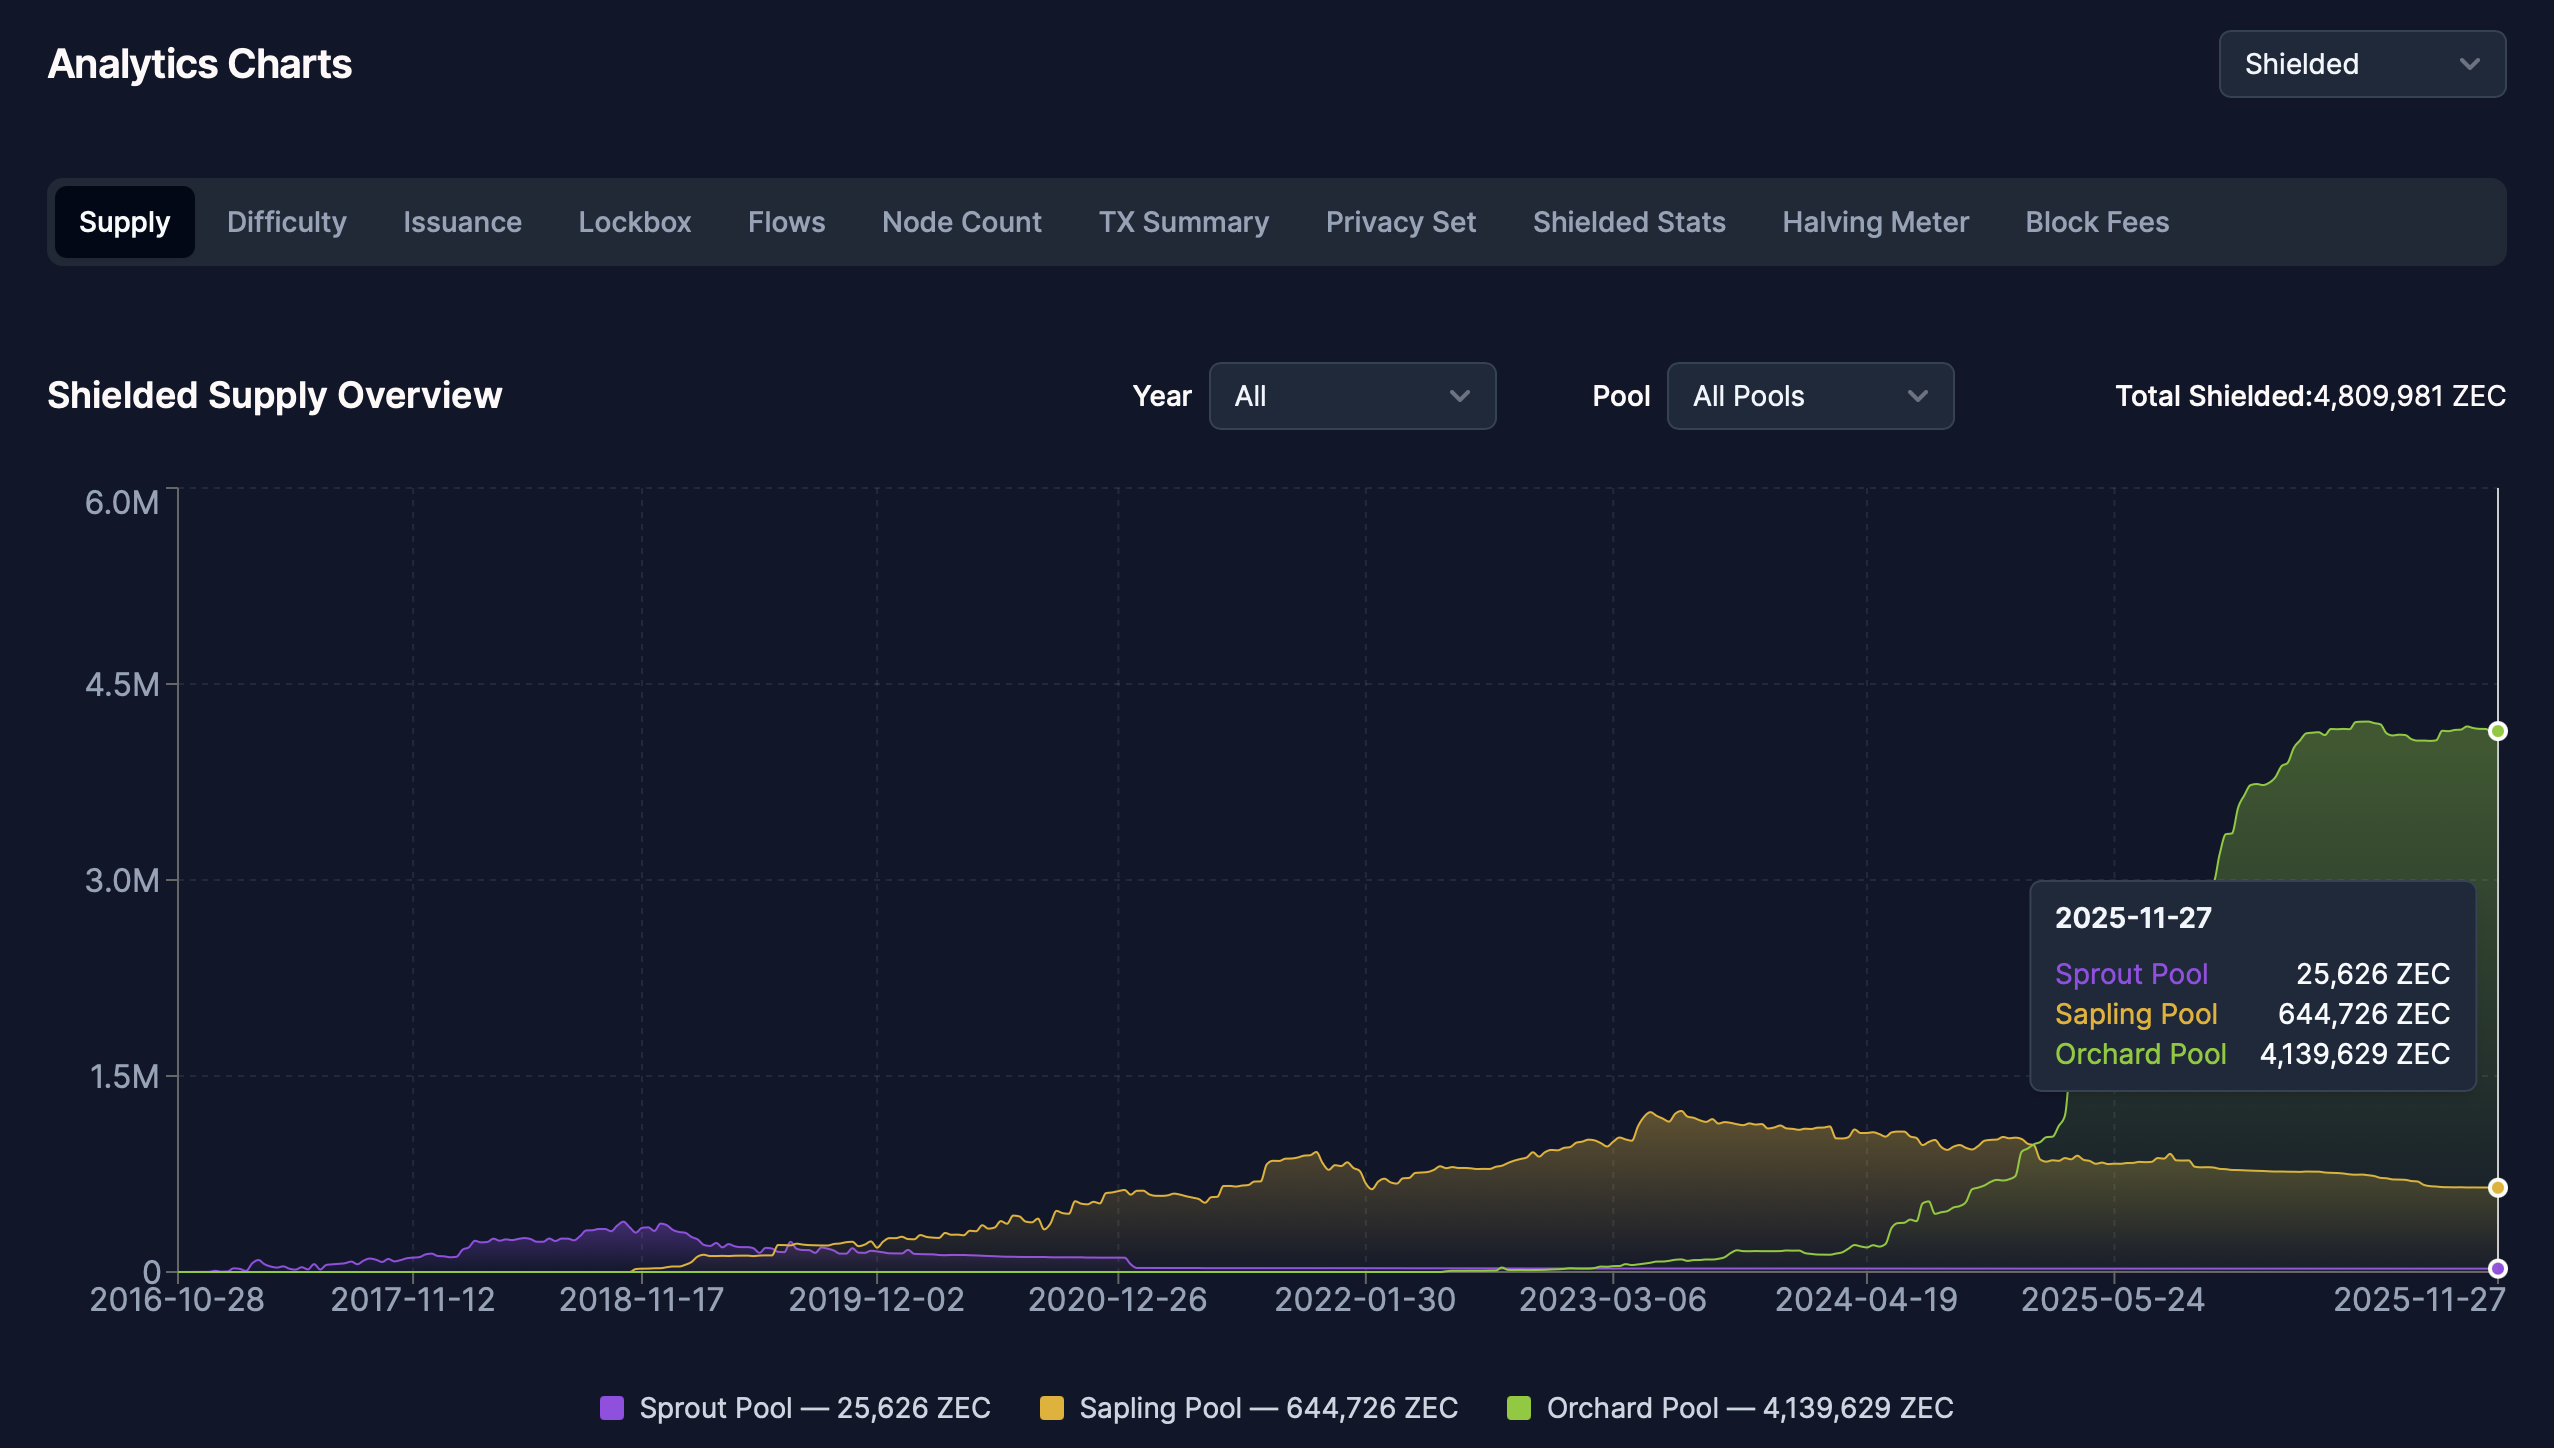
The surge in demand for ZEC as a privacy coin catalyzed the nearly 1000% rally between September and October. The ZECHUB data shows a significant increase in shielded ZEC tokens in the Orchard pool during the rally, effectively reducing supply and creating a positive feedback loop to increase demand.
However, the Orchard pool has plateaued after reaching a high of 4.21 million ZEC tokens on November 4, signaling reduced demand. If the plateau in Orchard pool extends, a lack of renewed demand could negatively affect ZEC prices. Meanwhile, the older pool, Sapling, is shrinking as users unshield their ZEC tokens.
Retail demand surge warns a sharp correction
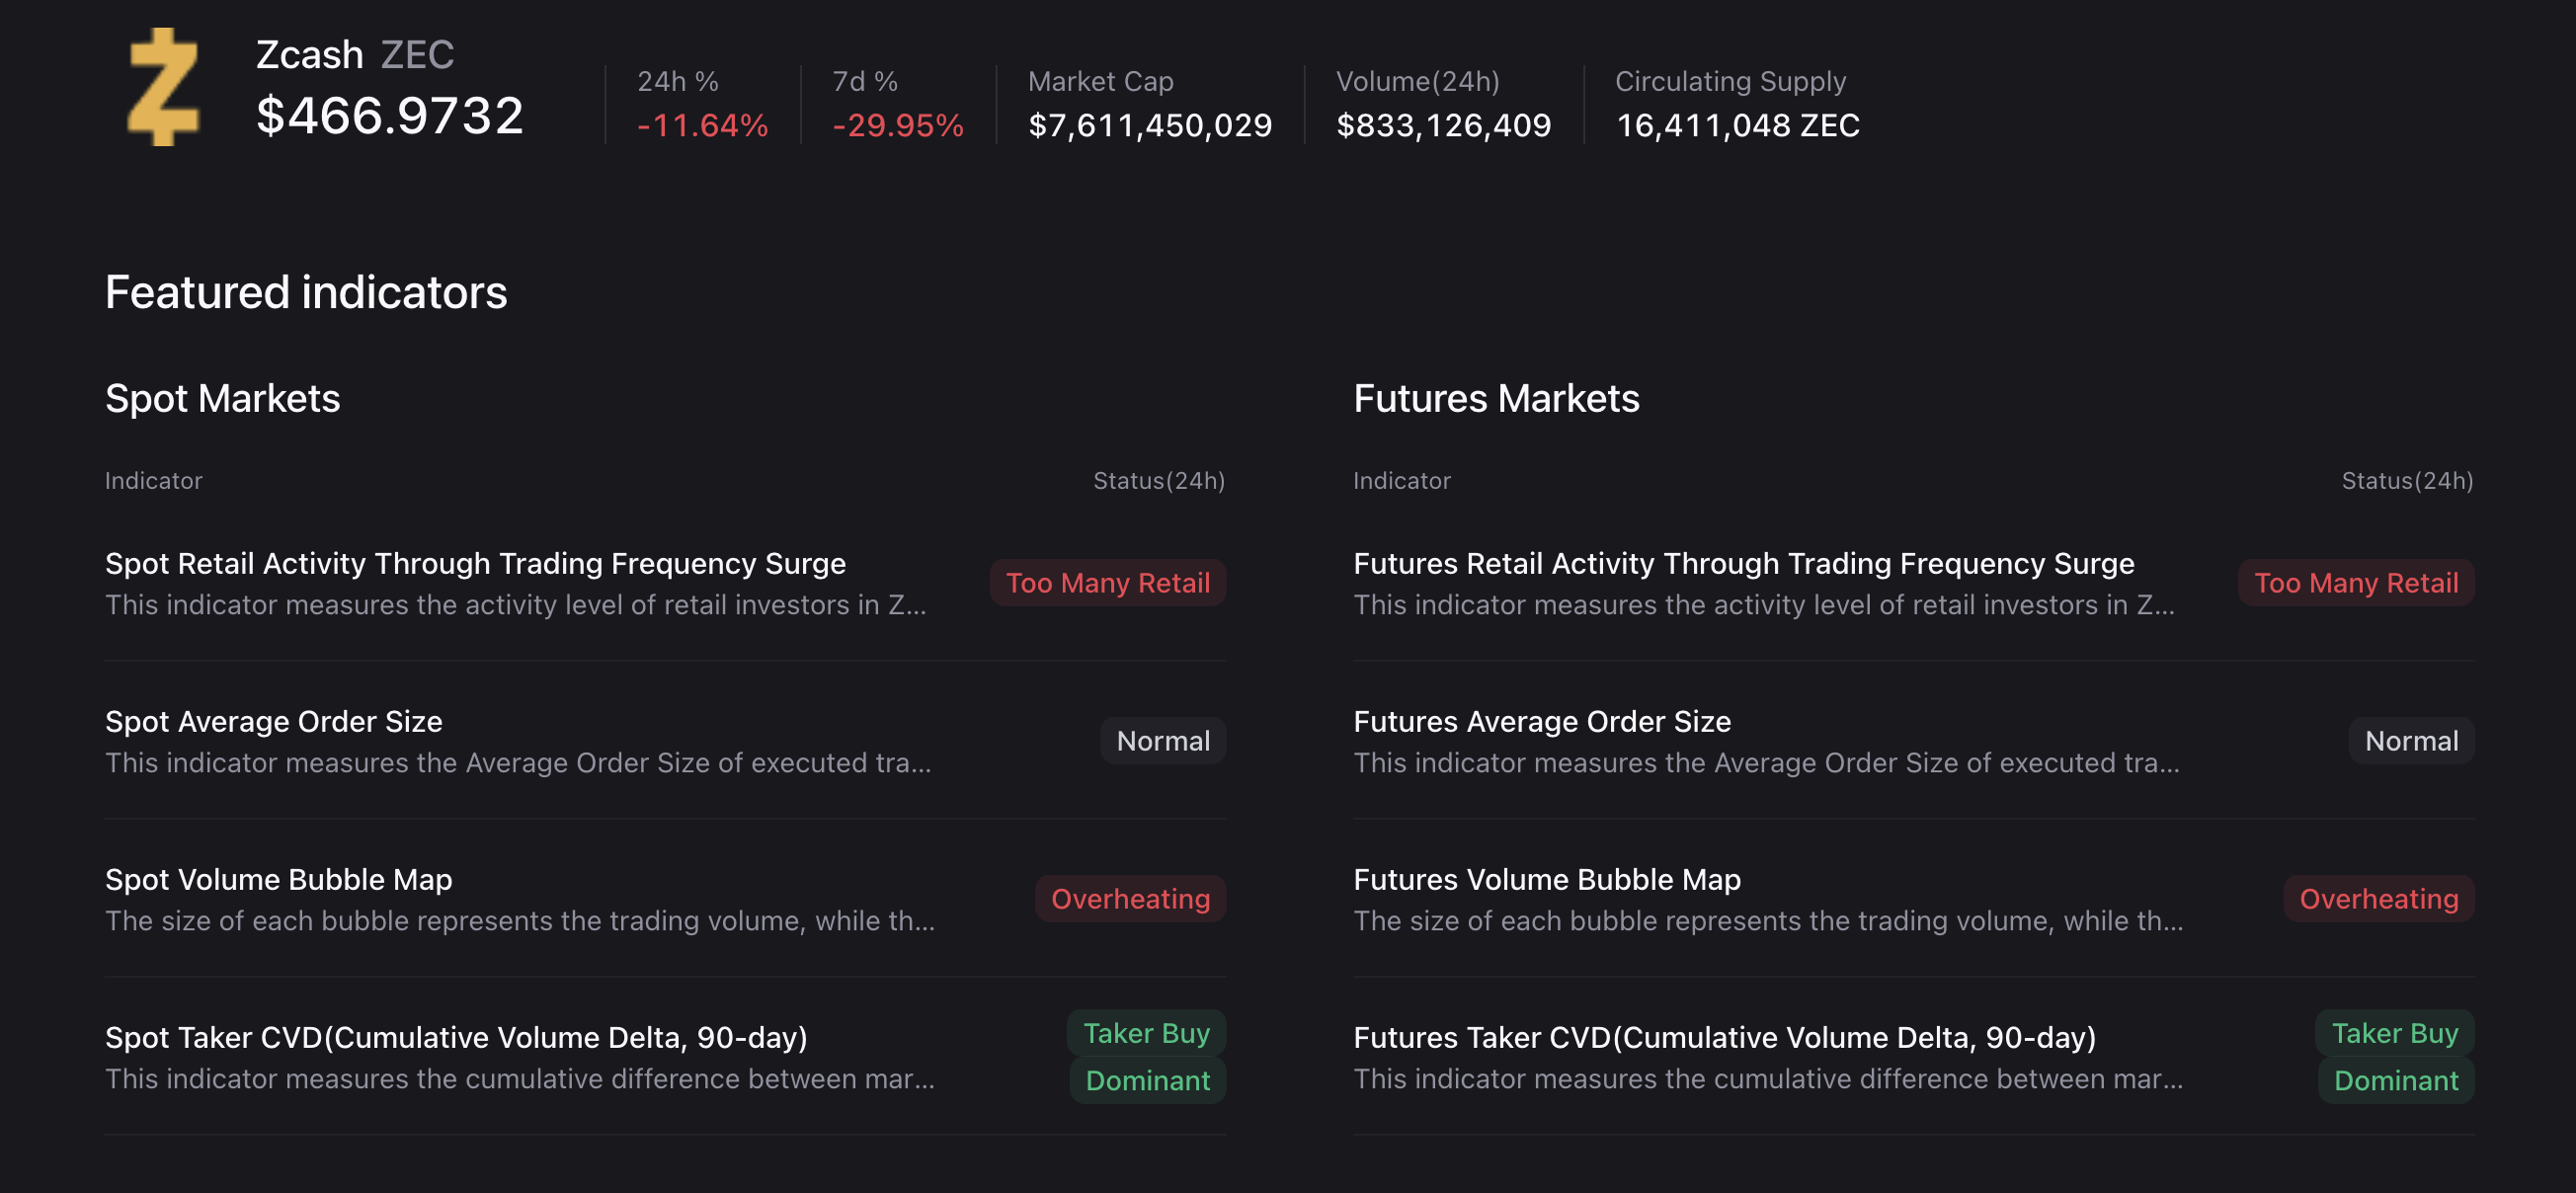
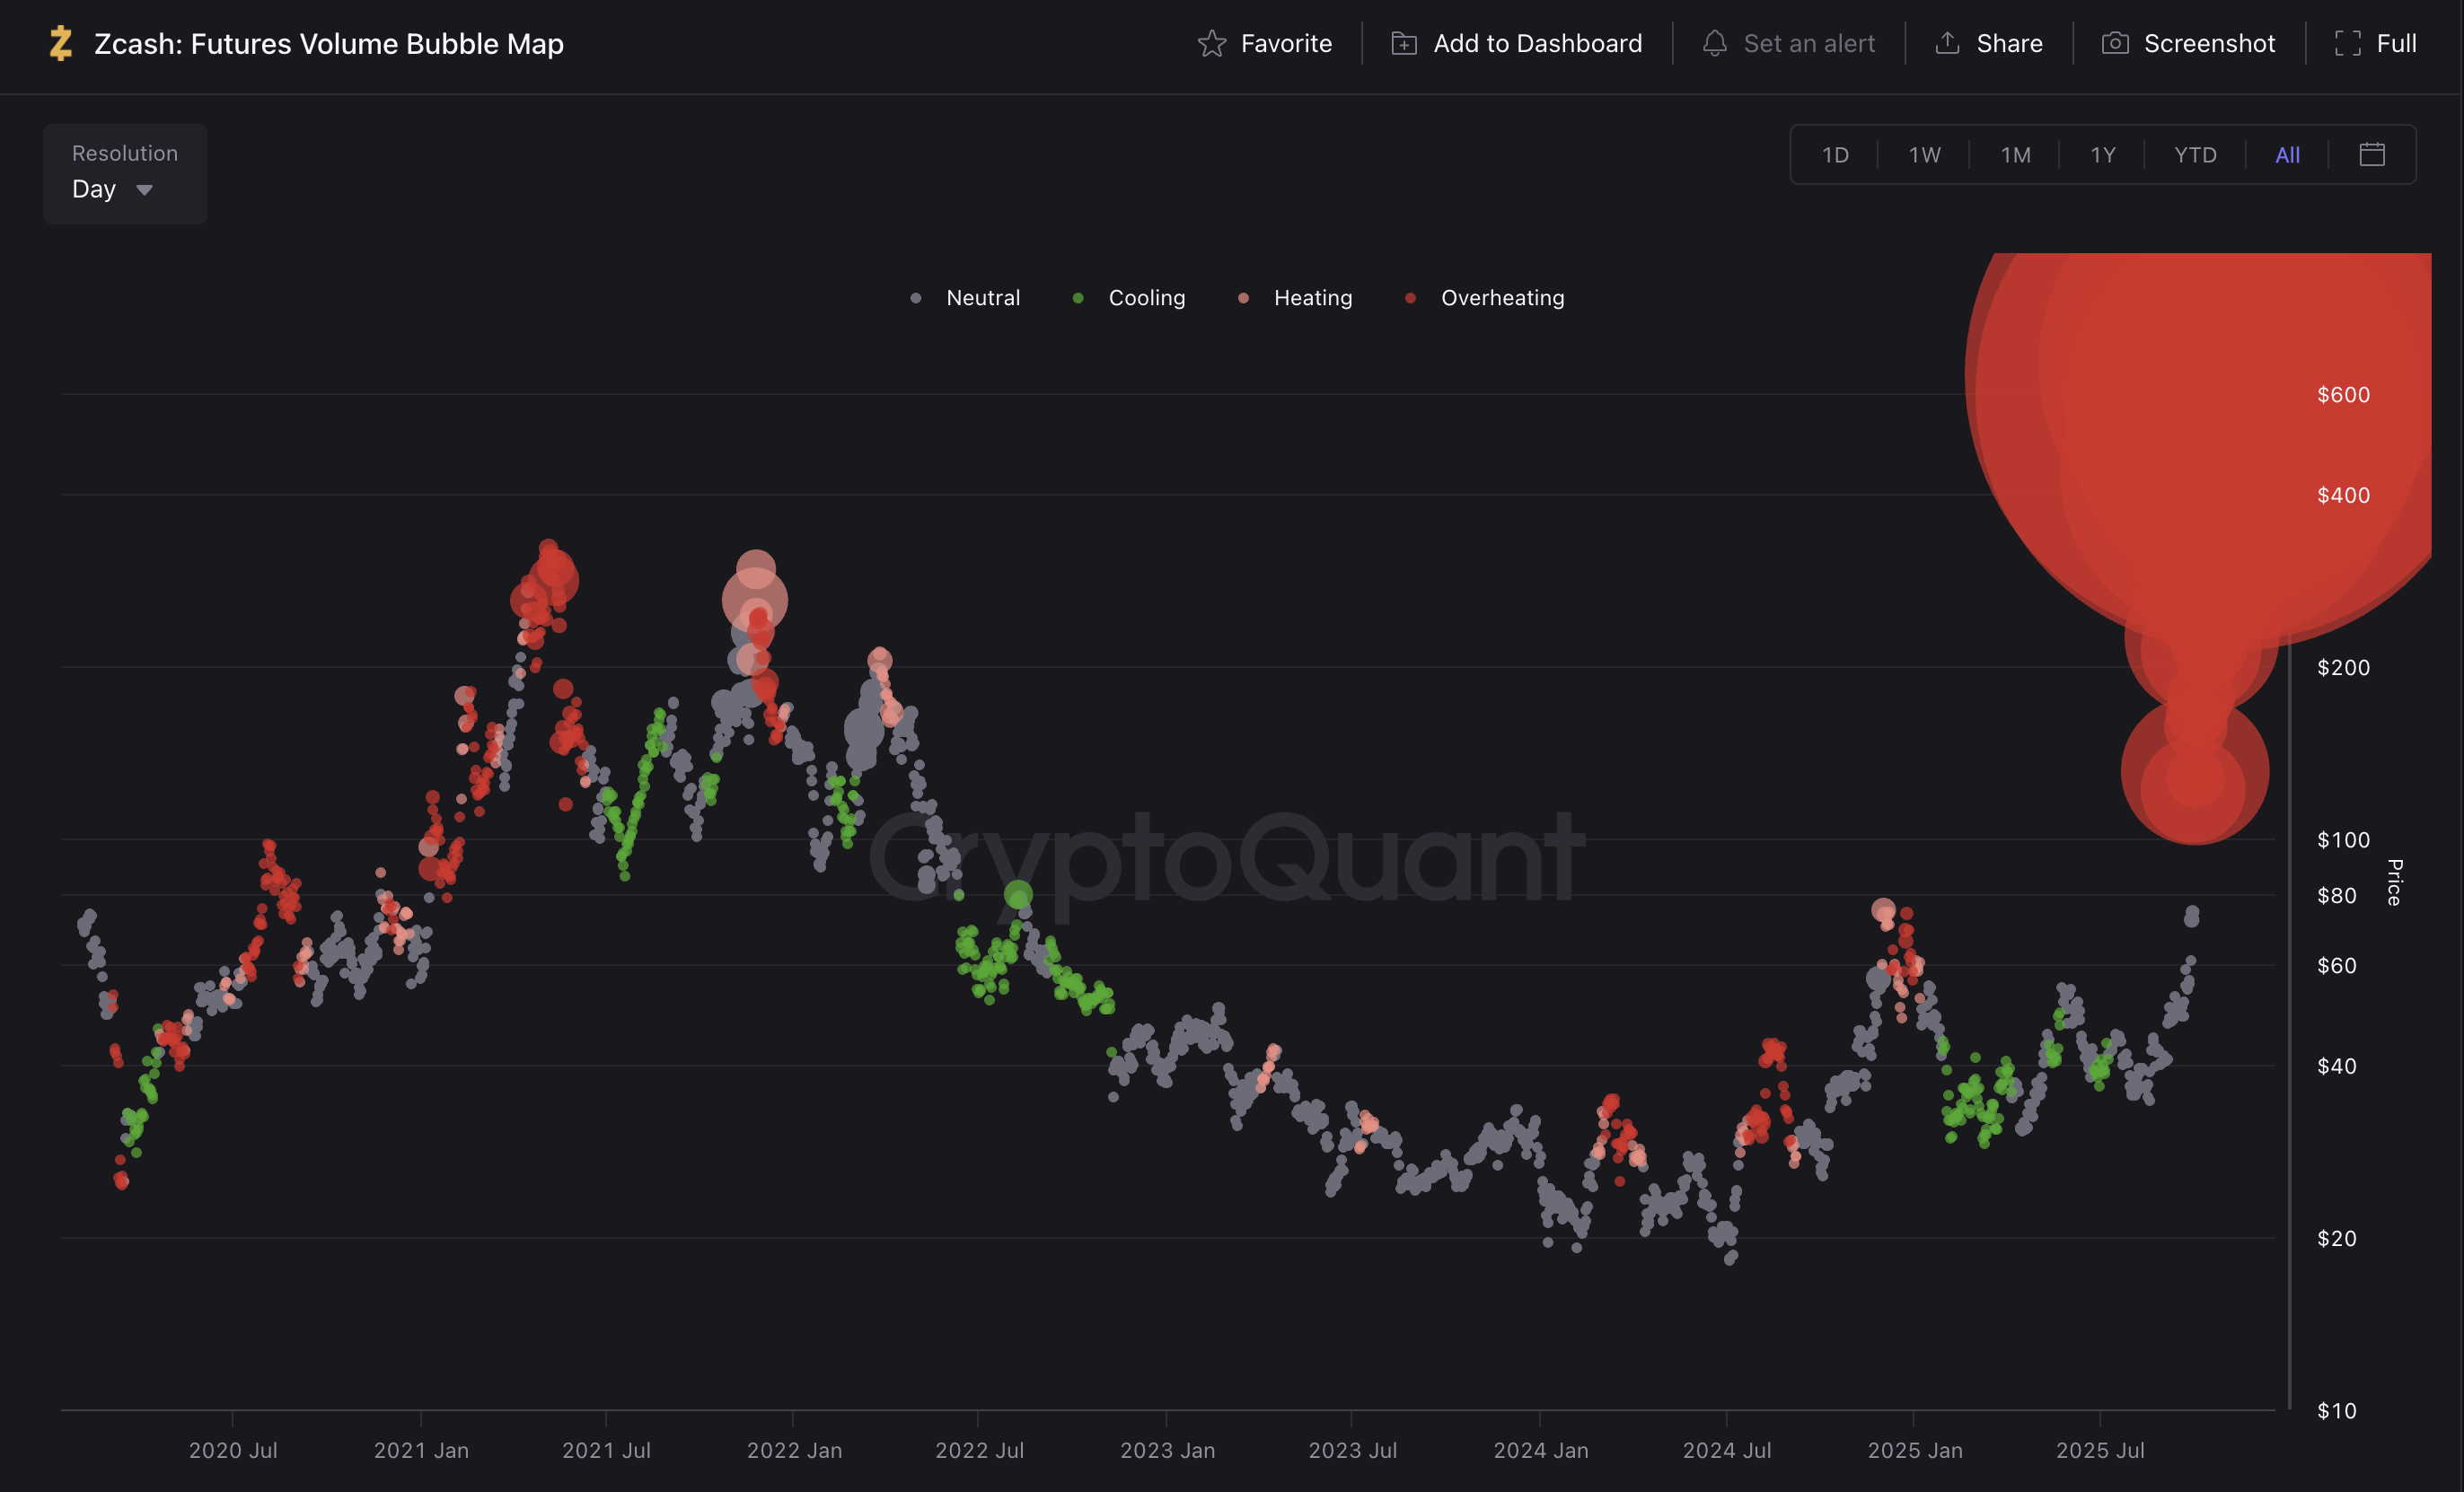
Despite a reduction in on-chain demand, retail demand for Zcash is growing stronger, which could allow smart investors to book profits. CryptoQuant’s data shows that the futures and spot markets are overheated by retail volume, leading to overcrowding in the acquisition of privacy coins.
Historically, a surge in retail activity often leads to sharp corrections in a crypto asset, previously seen during the May and November 2021 cycle tops.
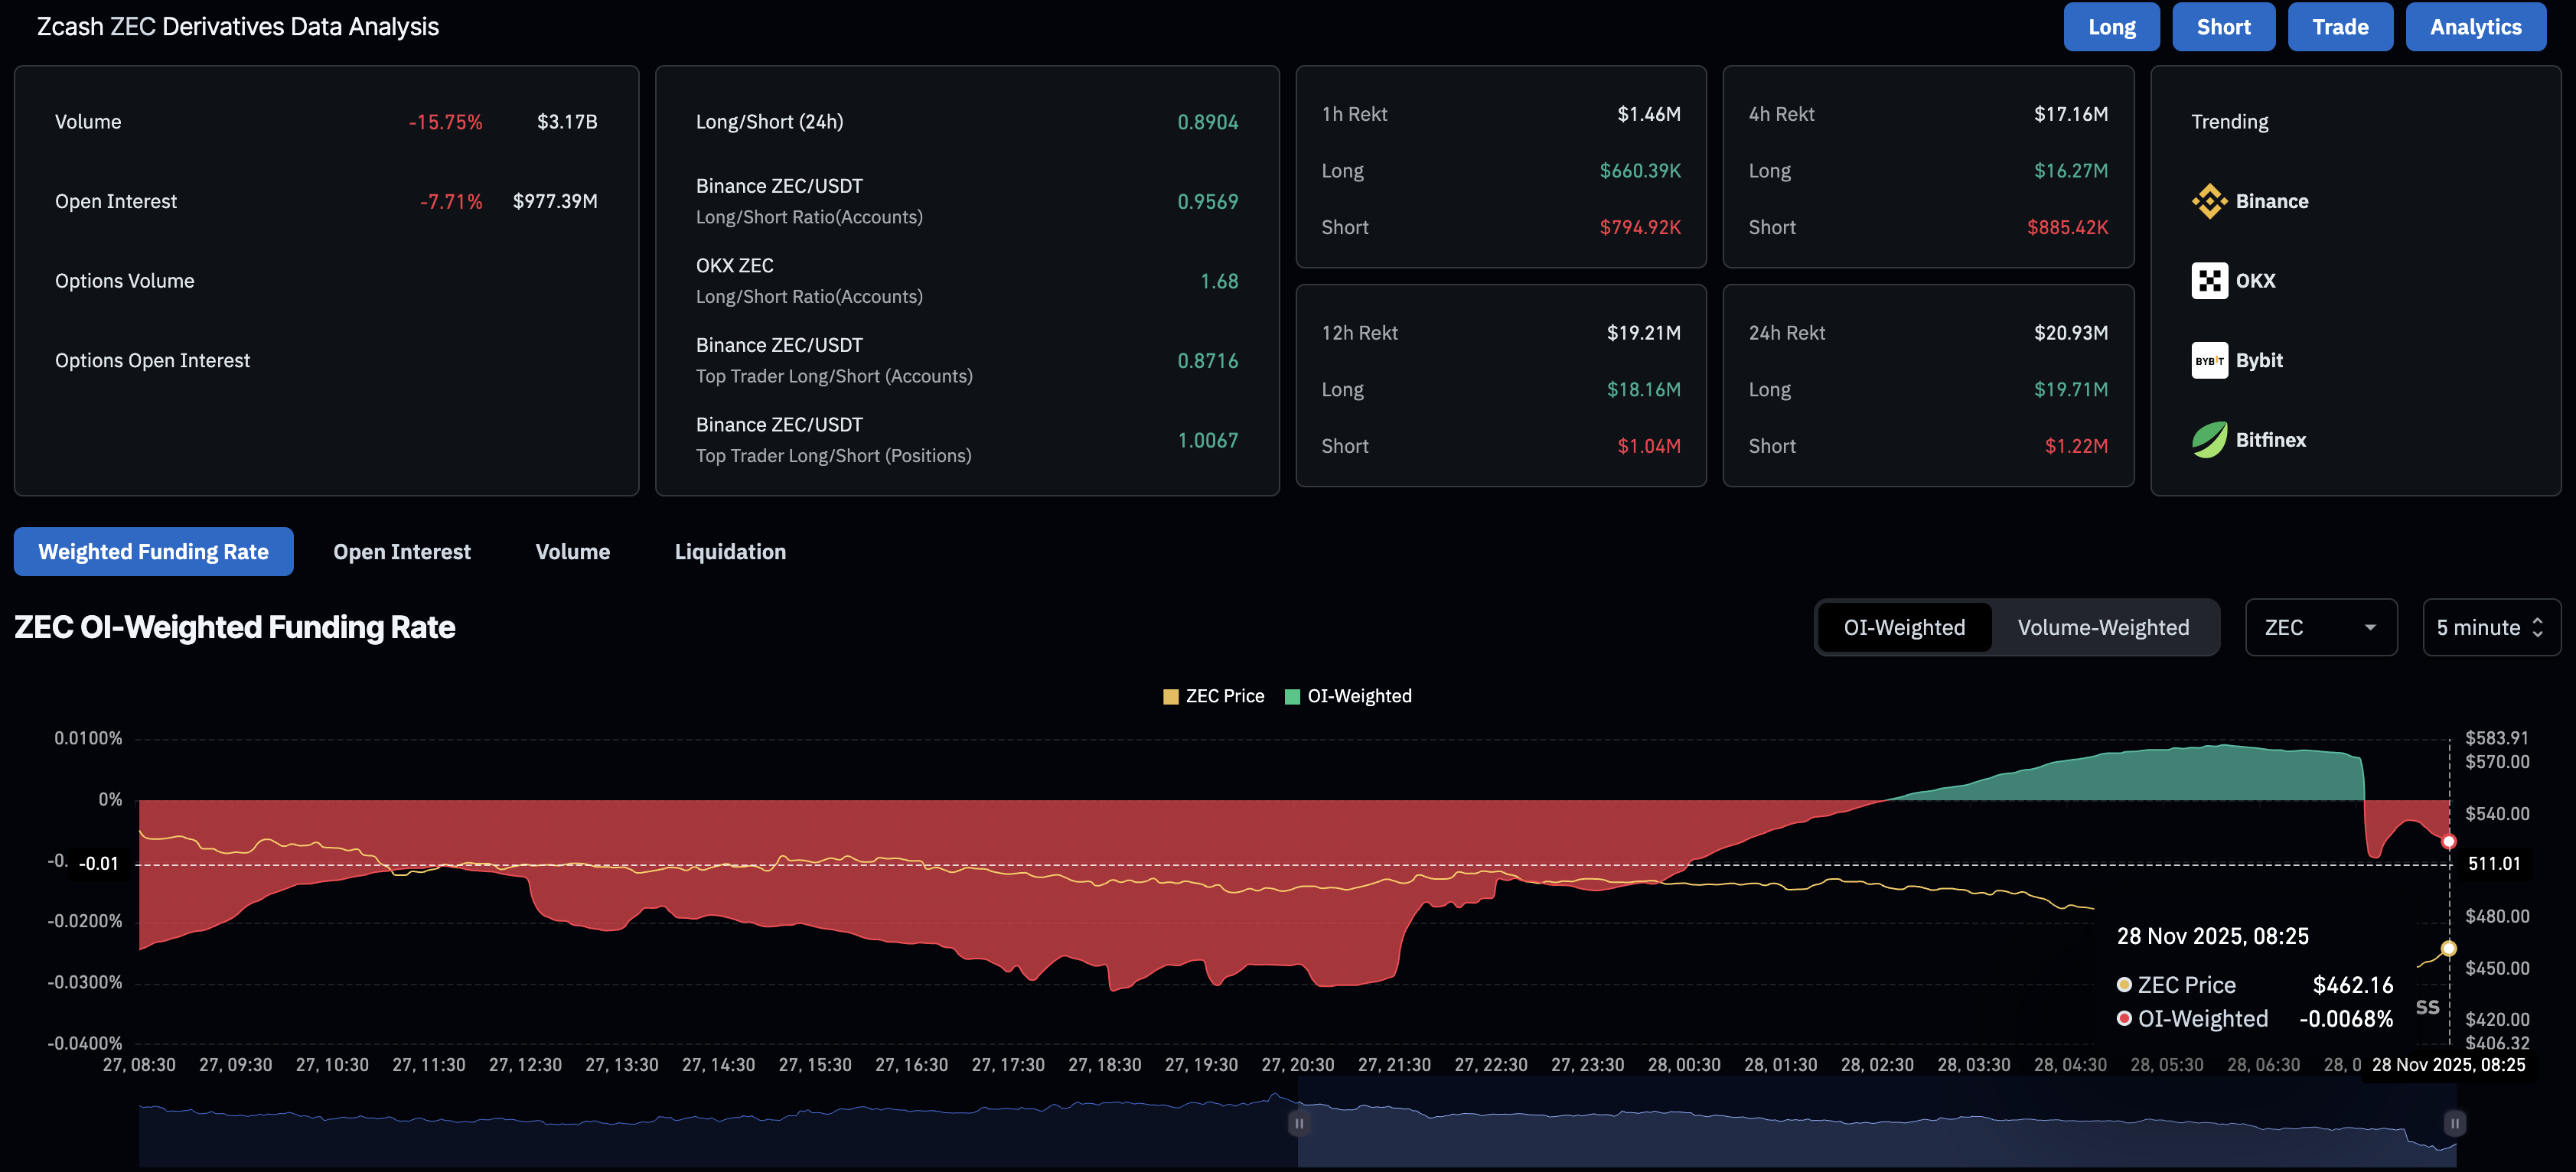
CoinGlass data shows that ZEC futures Open Interest (OI) is down 7.71% over the last 24 hours, to $977.39 million. A decline in futures OI for any asset suggests that traders are reducing capital at risk amid the possibility of a pullback or uncertain conditions.
Technical outlook: Zcash at crucial support risks a 30% drop
Zcash is extending the pullback below the $500 psychological level, approaching the 50-day Exponential Moving Average (EMA) at $436. The declining trend aligns with renewed selling pressure, as indicated by the Relative Strength Index (RSI) at 46 on the daily chart, which has crossed below the midline and is poised to move further on the downside before reaching the oversold zone.
Meanwhile, the Moving Average Convergence Divergence (MACD) and its signal line decline, approaching the zero line after a crossover on November 20. If the lines cross into the negative territory, it would confirm a bearish trend in motion.
If ZEC slips below the 50-day EMA at $436 on a successful daily close, it could extend the decline to the 100-day EMA retest at $315, which would represent an over 30% drop from the current market price.
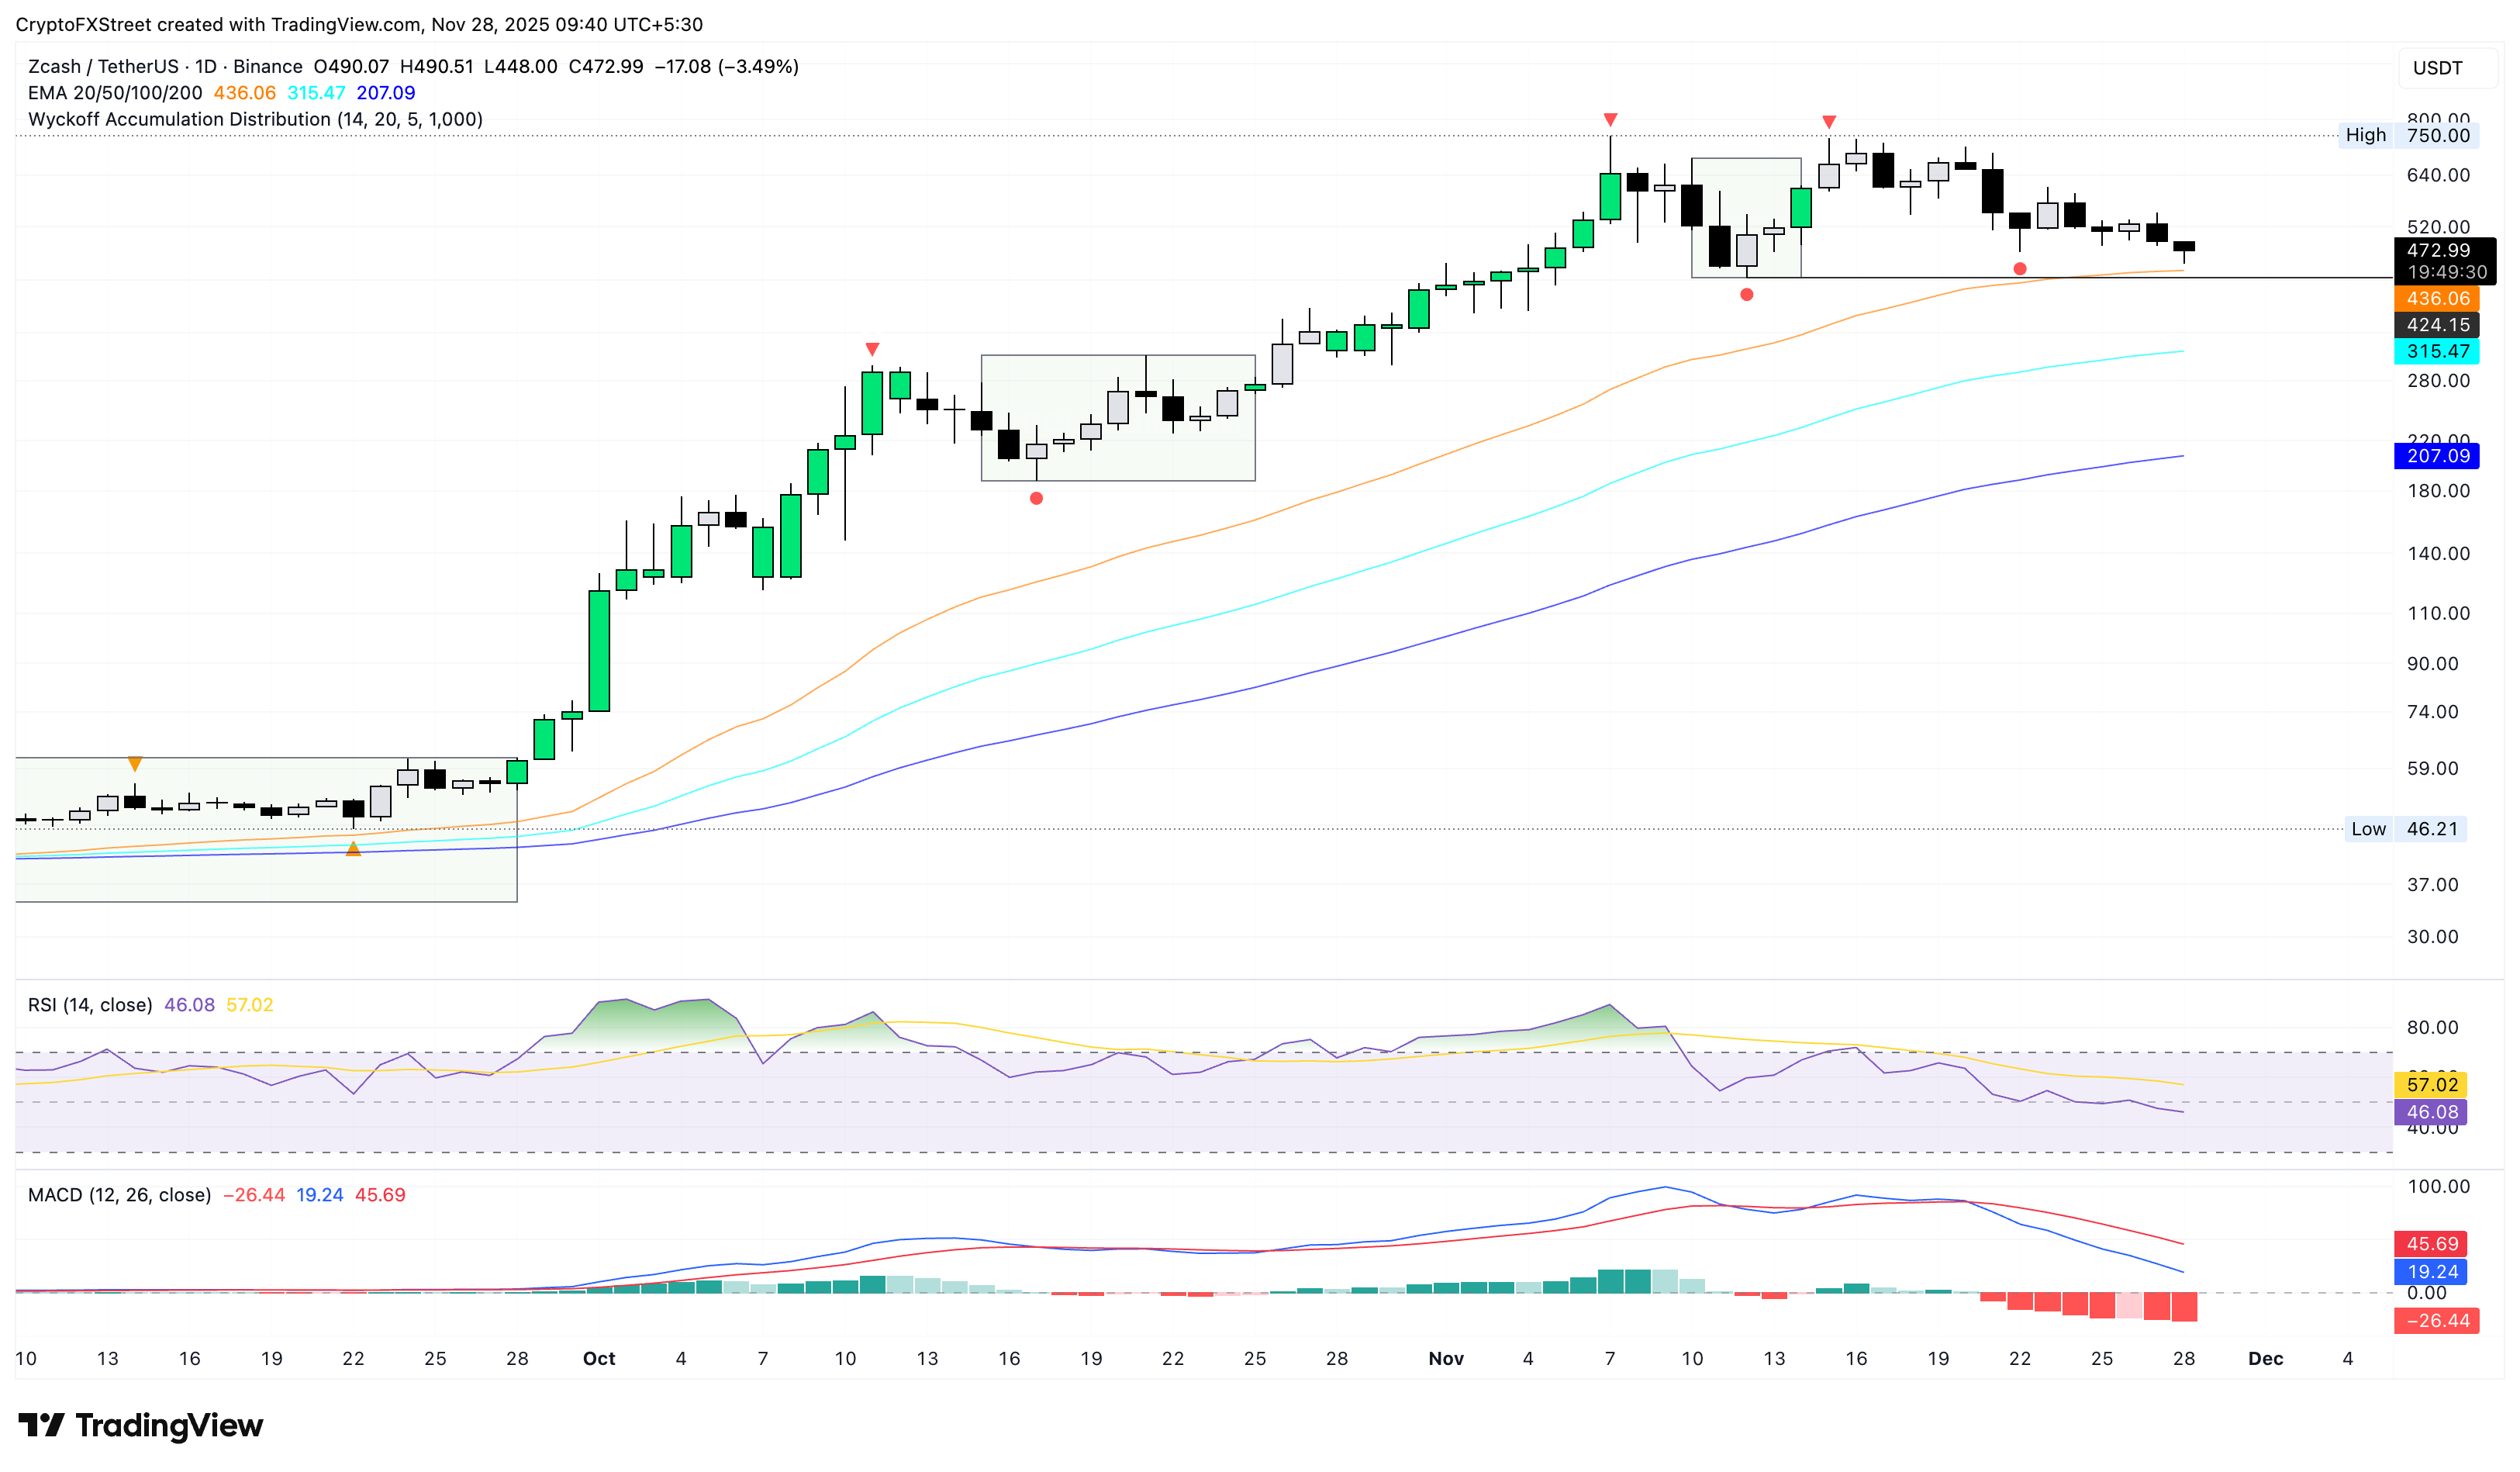
However, a bounce back in ZEC could reclaim the $500 mark, targeting the $600 round figure, followed by the $750 high from November 7.

Hơn một triệu người dùng dựa vào FXStreet để có dữ liệu thị trường thời gian thực, công cụ biểu đồ, góc nhìn chuyên gia và tin tức Forex. Lịch kinh tế toàn diện và các hội thảo web giáo dục giúp nhà giao dịch luôn cập nhật và đưa ra quyết định có tính toán. FXStreet có khoảng 60 nhân sự, chia giữa trụ sở Barcelona và nhiều khu vực toàn cầu.
Đọc thêm


