
Zilliqa Price Forecast: Overheating and sell-side dominance put ZIL at risks
Bởi Manish Chhetri
Đã cập nhật: 26 Mar 2026


BÀI VIẾT PHỔ BIẾN

Zilliqa (ZIL) price slips below $0.0040 at the time of writing on Thursday, indicating a slight weakness in price action. On-chain and derivatives metrics point to a negative outlook for ZIL, while strengthening bearish momentum suggests a deeper correction in the coming days.
- Zilliqa’s price trades in the red on Thursday, reflecting weakness in price action.
- On-chain and derivatives data support bearish sentiment with overheating conditions, sell-side dominance and negative funding rates.
- Momentum indicators show bearish strength gaining traction, hinting at a deeper correction ahead.
Zilliqa (ZIL) price slips below $0.0040 at the time of writing on Thursday, indicating a slight weakness in price action. On-chain and derivatives metrics point to a negative outlook for ZIL, while strengthening bearish momentum suggests a deeper correction in the coming days.
On-chain and derivatives data support a bearish bias
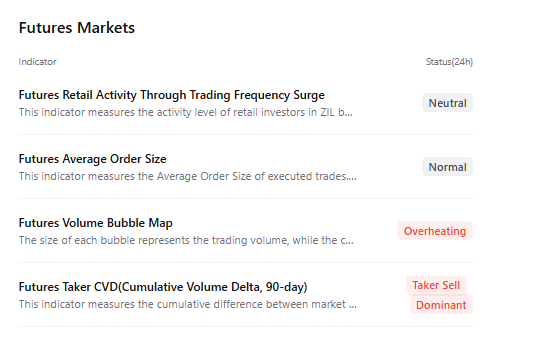
CryptoQuant summary data shows a bearish outlook for Zilliqa. The chart below shows overheating conditions and sell-side dominance in the futures market, signaling a potential correction ahead.
Santiment’s Social Dominance metric for ZIL also supports a bearish outlook. The index measures the share of ZIL-related discussions across the cryptocurrency media. It has been in a downtrend since mid-March, reading 0.003% on Thursday. This fall indicates fading market interest and sentiment among ZIL investors.
 [07-1774495618066-1774495618068.58.08, 26 Mar, 2026].png)
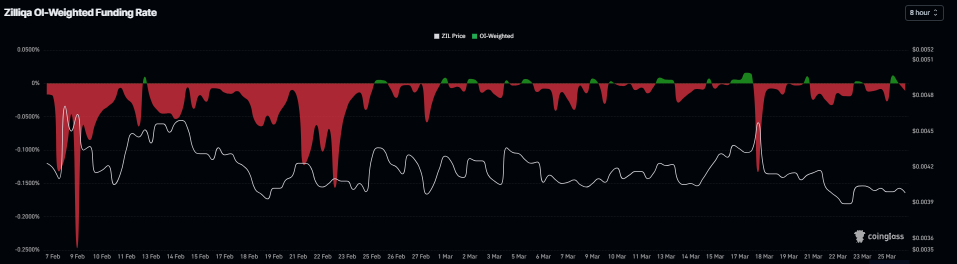
On the derivatives side, negative funding rates signal negative sentiment among traders. The metric flipped to a negative rate on Thursday, reading -0.014%, indicating shorts are paying longs and suggesting bearish sentiment toward ZIL.
Zilliqa Price Forecast: Bears are in control of momentum
Zilliqa price trades below $0.0040 as of writing on Thursday. The near-term bias remains mildly bearish as price holds below the descending trendline, last broken near $0.0046, and continues to trade beneath the 50-day and 100-day Exponential Moving Averages (EMAs), which cap the upside at $0.0043 and $0.0048, respectively.
The Relative Strength Index (RSI) on the daily chart sits in the low-40s, reflecting weak momentum and reinforcing the downside bias, while the Moving Average Convergence Divergence (MACD) indicator hovers around the zero line, suggesting limited directional conviction and a preference for selling into minor bounces.
Immediate resistance emerges at the nearby horizontal barrier around $0.0040, with the 50-day EMA near $0.0043 as the next hurdle, and the prior trendline break area around $0.0046 acting as a stronger cap if buyers attempt a recovery.
On the downside, initial support sits at $0.0038, where previous lows converge with a horizontal line; a break below this floor would expose deeper losses toward the $0.0035 area, keeping the bearish bias intact while price trades below the $0.0043–$0.0046 resistance band.
-1774495679762-1774495679763.png)
(The technical analysis of this story was written with the help of an AI tool.)

Hơn một triệu người dùng dựa vào FXStreet để có dữ liệu thị trường thời gian thực, công cụ biểu đồ, góc nhìn chuyên gia và tin tức Forex. Lịch kinh tế toàn diện và các hội thảo web giáo dục giúp nhà giao dịch luôn cập nhật và đưa ra quyết định có tính toán. FXStreet có khoảng 60 nhân sự, chia giữa trụ sở Barcelona và nhiều khu vực toàn cầu.
Đọc thêm


