
AUD/USD Price Forecast: Hovers around 0.6700, nine-day EMA
Bởi Akhtar Faruqui
Ngày xuất bản: 14 Jan 2026 | Ngày chỉnh sửa: 14 Jan 2026


BÀI VIẾT PHỔ BIẾN

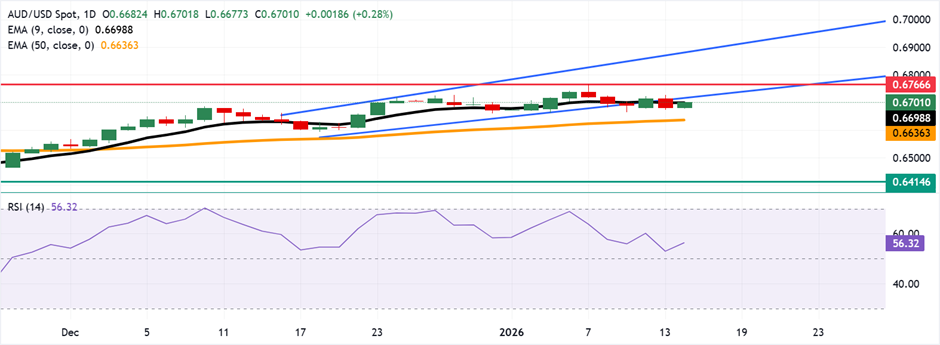
The AUD/USD pair is recovering its recent losses registered in the previous session, trading around 0.6700 during the European hours on Wednesday. The daily chart’s technical analysis indicated a weakening bullish bias as the pair is positioned slightly below the ascending channel pattern.
- AUD/USD rebounded toward the ascending channel.
- The 14-day Relative Strength Index at 56.32 signals improving momentum.
- The pair is hovering around the nine-day EMA of 0.6698.
The AUD/USD pair is recovering its recent losses registered in the previous session, trading around 0.6700 during the European hours on Wednesday. The daily chart’s technical analysis indicated a weakening bullish bias as the pair is positioned slightly below the ascending channel pattern.
The 14-day Relative Strength Index (RSI) at 56.32 is neutral and firming, confirming improving momentum. As long as RSI holds above 50, the pair could maintain the uptrend. Additionally, the AUD/USD pair holds above the rising 50-day Exponential Moving Average (EMA). The nine-day EMA is trending higher, keeping the near-term bias positive.
On the upside, a rebound within the ascending channel would improve the bullish bias and help the AUD/USD pair to target 0.6766, its highest level since October 2024. A decisive break could open a continuation higher toward the upper boundary of the ascending channel near 0.6880.
The immediate support lies at the nine-day Exponential Moving Average (EMA) of 0.6698. A close below the short-term average would undermine the tone and expose the mentioned support at the 50-day EMA at 0.6636. Further losses would open the downside toward 0.6414, the lowest since June 2025.
Australian Dollar Price Today
The table below shows the percentage change of Australian Dollar (AUD) against listed major currencies today. Australian Dollar was the strongest against the Swiss Franc.
| USD | EUR | GBP | JPY | CAD | AUD | NZD | CHF | |
|---|---|---|---|---|---|---|---|---|
| USD | 0.00% | -0.06% | 0.05% | 0.04% | -0.17% | -0.10% | 0.04% | |
| EUR | -0.00% | -0.06% | 0.02% | 0.04% | -0.17% | -0.10% | 0.04% | |
| GBP | 0.06% | 0.06% | 0.11% | 0.10% | -0.10% | -0.05% | 0.10% | |
| JPY | -0.05% | -0.02% | -0.11% | 0.00% | -0.20% | -0.14% | 0.01% | |
| CAD | -0.04% | -0.04% | -0.10% | -0.01% | -0.21% | -0.14% | 0.00% | |
| AUD | 0.17% | 0.17% | 0.10% | 0.20% | 0.21% | 0.07% | 0.21% | |
| NZD | 0.10% | 0.10% | 0.05% | 0.14% | 0.14% | -0.07% | 0.14% | |
| CHF | -0.04% | -0.04% | -0.10% | -0.01% | -0.01% | -0.21% | -0.14% |
The heat map shows percentage changes of major currencies against each other. The base currency is picked from the left column, while the quote currency is picked from the top row. For example, if you pick the Australian Dollar from the left column and move along the horizontal line to the US Dollar, the percentage change displayed in the box will represent AUD (base)/USD (quote).
(The technical analysis of this story was written with the help of an AI tool.)

Hơn một triệu người dùng dựa vào FXStreet để có dữ liệu thị trường thời gian thực, công cụ biểu đồ, góc nhìn chuyên gia và tin tức Forex. Lịch kinh tế toàn diện và các hội thảo web giáo dục giúp nhà giao dịch luôn cập nhật và đưa ra quyết định có tính toán. FXStreet có khoảng 60 nhân sự, chia giữa trụ sở Barcelona và nhiều khu vực toàn cầu.
Đọc thêm


