
Trade The World
AUD/USD Price Forecast: Recovers a few pips from 0.6620-0.6615 resistance-turned-support
Bởi Haresh Menghani
Ngày xuất bản: 16 Dec 2025 | Ngày chỉnh sửa: 16 Dec 2025


POPULAR ARTICLES

The AUD/USD pair prolongs last week's retracement slide from a nearly three-month peak, around the 0.6685 region, and drifts lower for the fourth straight day on Tuesday.
- AUD/USD drifts lower for the fourth straight day, though the downside remains cushioned.
- The divergent RBA-Fed policy expectations hold back bearish traders from placing fresh bets.
- The mixed fundamental backdrop also warrants caution before positioning for deeper losses.
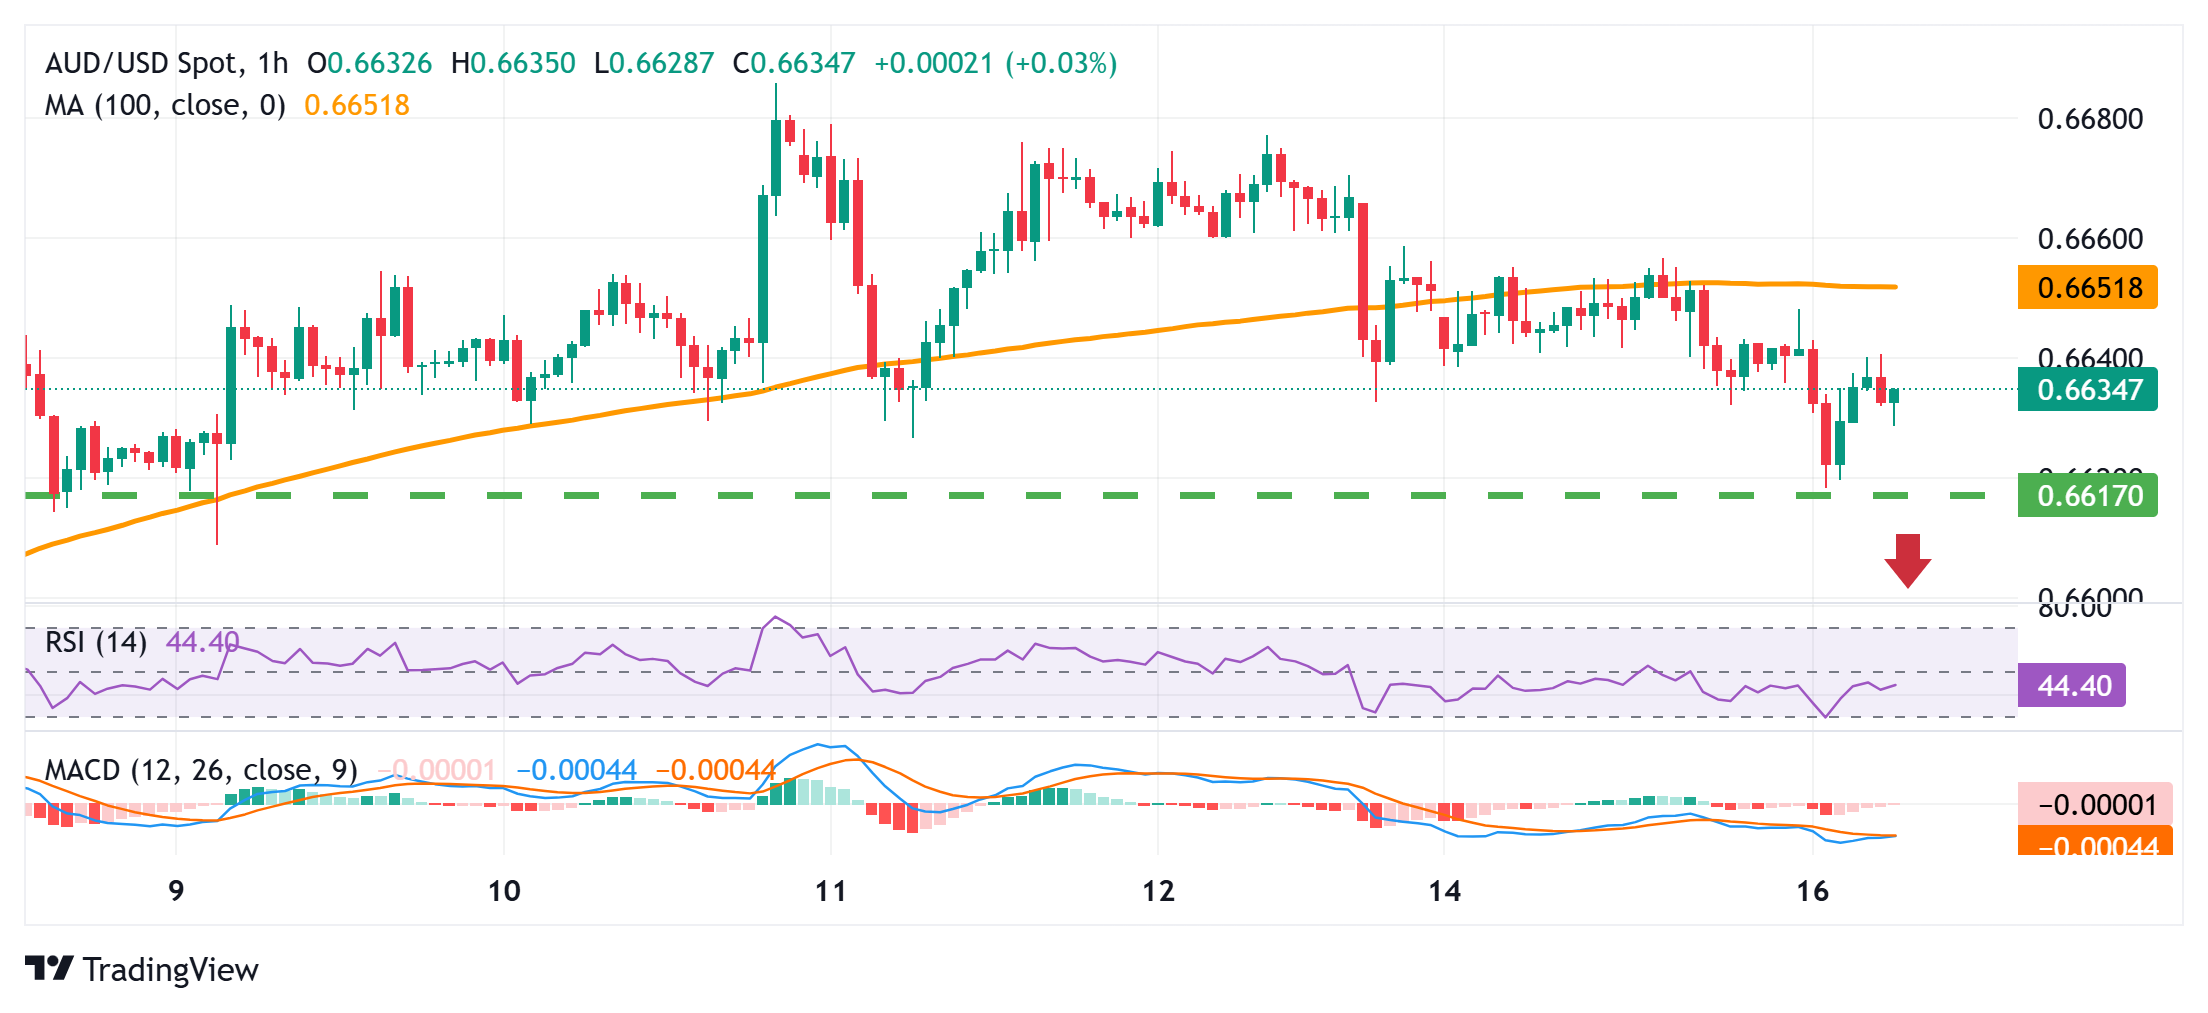
The AUD/USD pair prolongs last week's retracement slide from a nearly three-month peak, around the 0.6685 region, and drifts lower for the fourth straight day on Tuesday. Spot prices, however, recover a few pips from a one-week low, touched during the Asian session, and currently trade around the 0.6630-0.6635 region, down less than 0.10% for the day.
Against the backdrop of mixed Australian employment details released last Thursday, Monday's disappointing Chinese macro data revived concerns about the health of the world's second-largest economy. This, along with a weaker risk tone, undermines the Australian Dollar (AUD). The US Dollar (USD), on the other hand, remains depressed amid bets for more rate cuts by the Federal Reserve (Fed), which marks a significant divergence as compared to the Reserve Bank of Australia's (RBA) hawkish tilt and supports the AUD/USD pair.
The recent breakdown and a subsequent failed attempt to move back above the 100-hour Simple Moving Average (SMA) favor bearish traders. Moreover, oscillators on hourly charts have been gaining negative traction and back the case for deeper losses. However, technical indicators on the daily chart are still holding in positive territory. This, in turn, makes it prudent to wait for a sustained break below the 0.6620-0.6615 horizontal resistance-turned-support and the 0.6600 round figure before confirming a near-term top for the AUD/USD pair.
Spot prices might then accelerate the slide towards the next relevant support near the 0.6545-0.6540 region before eventually dropping to test levels below the 0.6500 psychological mark. A convincing break below the latter would be seen as a key trigger for bearish traders and make the AUD/USD pair vulnerable to retest the 0.6420 region, or a multi-month low touched in November.
On the flip side, the daily swing high, around the 0.6645-0.6650 region, could act as an immediate hurdle, above which the pair could aim to retest the multi-month peak, around the 0.6685 zone. This is followed by the year-to-date top, levels just above the 0.6700 mark, which, if cleared, will be seen as a fresh trigger for bulls and pave the way for additional gains. The momentum might then push the AUD/USD pair to the 0.6755-0.6760 intermediate hurdle en route to the 0.6800 mark and the next relevant hurdle near the 0.6820-0.6825 region.
AUD/USD 1-hour chart
Australian Dollar Price This week
The table below shows the percentage change of Australian Dollar (AUD) against listed major currencies this week. Australian Dollar was the strongest against the New Zealand Dollar.
| USD | EUR | GBP | JPY | CAD | AUD | NZD | CHF | |
|---|---|---|---|---|---|---|---|---|
| USD | -0.10% | 0.14% | -0.63% | -0.01% | 0.17% | 0.30% | 0.07% | |
| EUR | 0.10% | 0.25% | -0.55% | 0.08% | 0.30% | 0.41% | 0.17% | |
| GBP | -0.14% | -0.25% | -0.68% | -0.16% | 0.05% | 0.15% | -0.08% | |
| JPY | 0.63% | 0.55% | 0.68% | 0.64% | 0.83% | 0.93% | 0.93% | |
| CAD | 0.01% | -0.08% | 0.16% | -0.64% | 0.19% | 0.31% | 0.23% | |
| AUD | -0.17% | -0.30% | -0.05% | -0.83% | -0.19% | 0.11% | -0.15% | |
| NZD | -0.30% | -0.41% | -0.15% | -0.93% | -0.31% | -0.11% | -0.23% | |
| CHF | -0.07% | -0.17% | 0.08% | -0.93% | -0.23% | 0.15% | 0.23% |
The heat map shows percentage changes of major currencies against each other. The base currency is picked from the left column, while the quote currency is picked from the top row. For example, if you pick the Australian Dollar from the left column and move along the horizontal line to the US Dollar, the percentage change displayed in the box will represent AUD (base)/USD (quote).

FXStreet
Hơn một triệu người dùng dựa vào FXStreet để có dữ liệu thị trường thời gian thực, công cụ biểu đồ, góc nhìn chuyên gia và tin tức Forex. Lịch kinh tế toàn diện và các hội thảo web giáo dục giúp nhà giao dịch luôn cập nhật và đưa ra quyết định có tính toán. FXStreet có khoảng 60 nhân sự, chia giữa trụ sở Barcelona và nhiều khu vực toàn cầu.
Read More


