
Trade The World
Cardano Price Forecast: ADA rebounds following testing of key support zone
Bởi Manish Chhetri
Ngày xuất bản: 30 Sep 2025 | Ngày chỉnh sửa: 30 Sep 2025


POPULAR ARTICLES

Cardano (ADA) is trading near $0.80 at the time of writing on Tuesday after rebounding from key support on Sunday.
- Cardano price hovers around $0.80 on Tuesday after rebounding from its key support zone on Sunday.
- The US SEC has requested that ETF issuers for Cardano and major crypto products withdraw their 19b-4 filings.
- The technical outlook suggests a rally if the support zone holds strong.
Cardano (ADA) is trading near $0.80 at the time of writing on Tuesday after rebounding from key support on Sunday. The US Securities and Exchange Commission (SEC) has requested that Exchange Traded Fund (ETF) issuers for Cardano and other major altcoins, which failed to push the ADA price higher on Monday. Meanwhile, the technical outlook suggests a rally if the support zone holds strong.
US SEC requests withdrawal of 19b-4 filings for crypto products
According to Eleanor Terrett’s X post on a Monday, the US SEC has issued a request for prospective issuers to withdraw their 19b-4 filings for several products, including major altcoins such as Cardano, SOL, XRP, LTC, and DOGE.
The move follows the SEC's approval of generic listing standards for crypto ETFs on September 17, which removes the need for firms to submit 19b-4 applications for individual crypto products.
Under the new standards, exchanges can list the funds if they meet requirements rather than filing individual 19b-4 applications. The process also reduces the SEC's previous approval timeline, which can take up to 240 days, to about 75 days. Although there is no assurance of the timing for the SEC's decisions on the ETFs, regulators were already reaching a final deadline for certain applications.
The move had only a mild short-term impact on Cardano, with ADA hovering around $0.80 on Monday. However, in the long term, it could have a bullish impact as it streamlines the path for altcoin ETFs and supports broader adoption.
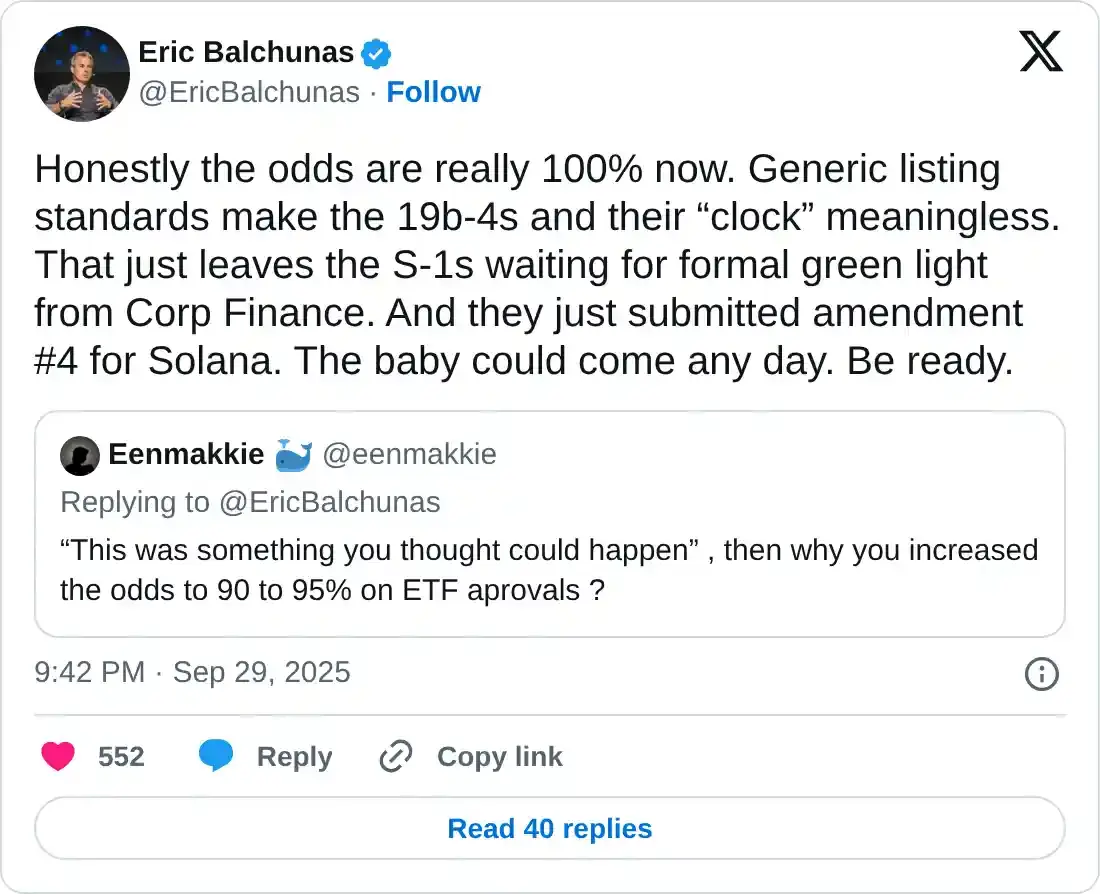
Eric Balchunas, Senior ETF Analyst for Bloomberg, said on Tuesday that “Honestly, the odds are really 100% now.”
Balchunas continued, “Generic listing standards make the 19b-4s and their 'clock' meaningless. That just leaves the S-1s waiting for formal green light from Corp Finance.”
Derivatives data show bullish bias
Derivatives data also support a recovery rally for Cardano. Coinglass’s OI-Weighted Funding Rate data shows that the number of traders betting that the price of Cardano will slide further is lower than those anticipating a price increase.
The metric flipped positive last week and reads 0.018% on Tuesday, indicating that longs are paying shorts. Historically, as shown in the chart below, when funding rates have shifted from negative to positive and increased, Cardano’s price has rallied sharply.
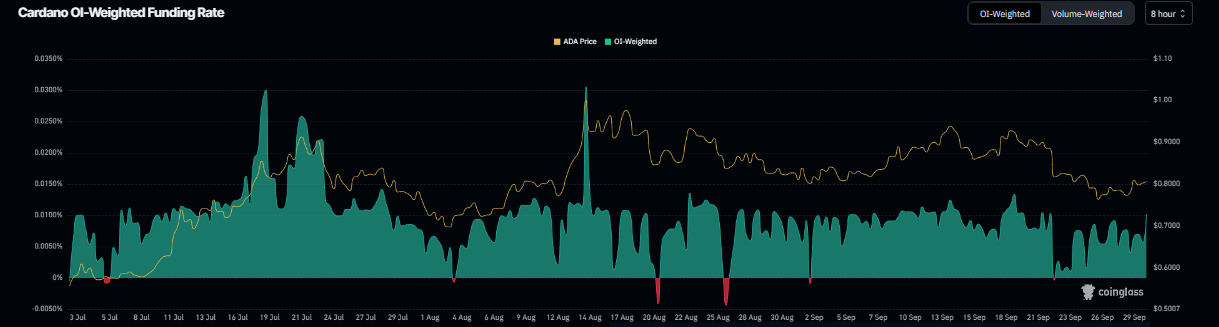
Cardano funding rate chart. Source: Coinglass
Cardano Price Forecast: ADA rebounds after retesting a key support zone
Cardano price broke and closed below the daily support at $0.84 on September 22, declining 7.5% over the next three days and retesting the 200-day Exponential Moving Average (EMA) at $0.76 on Thursday. ADA found support around the 200-day EMA on Friday and recovered nearly 6% by Monday. This 200-day EMA roughly coincides with the 50% Fibonacci retracement level at $0.76, making this a key support zone. At the time of writing on Tuesday, it hovers at around $0.80.
If ADA continues to recover and closes above the daily level at $0.84, it could extend the rally toward the psychologically important level at $1.
The Relative Strength Index (RSI) on the daily chart reads 43, pointing upwards and nearing its neutral level of 50, which indicates a fading bearish momentum. For the recovery rally to be sustained, the RSI must move above the neutral level.
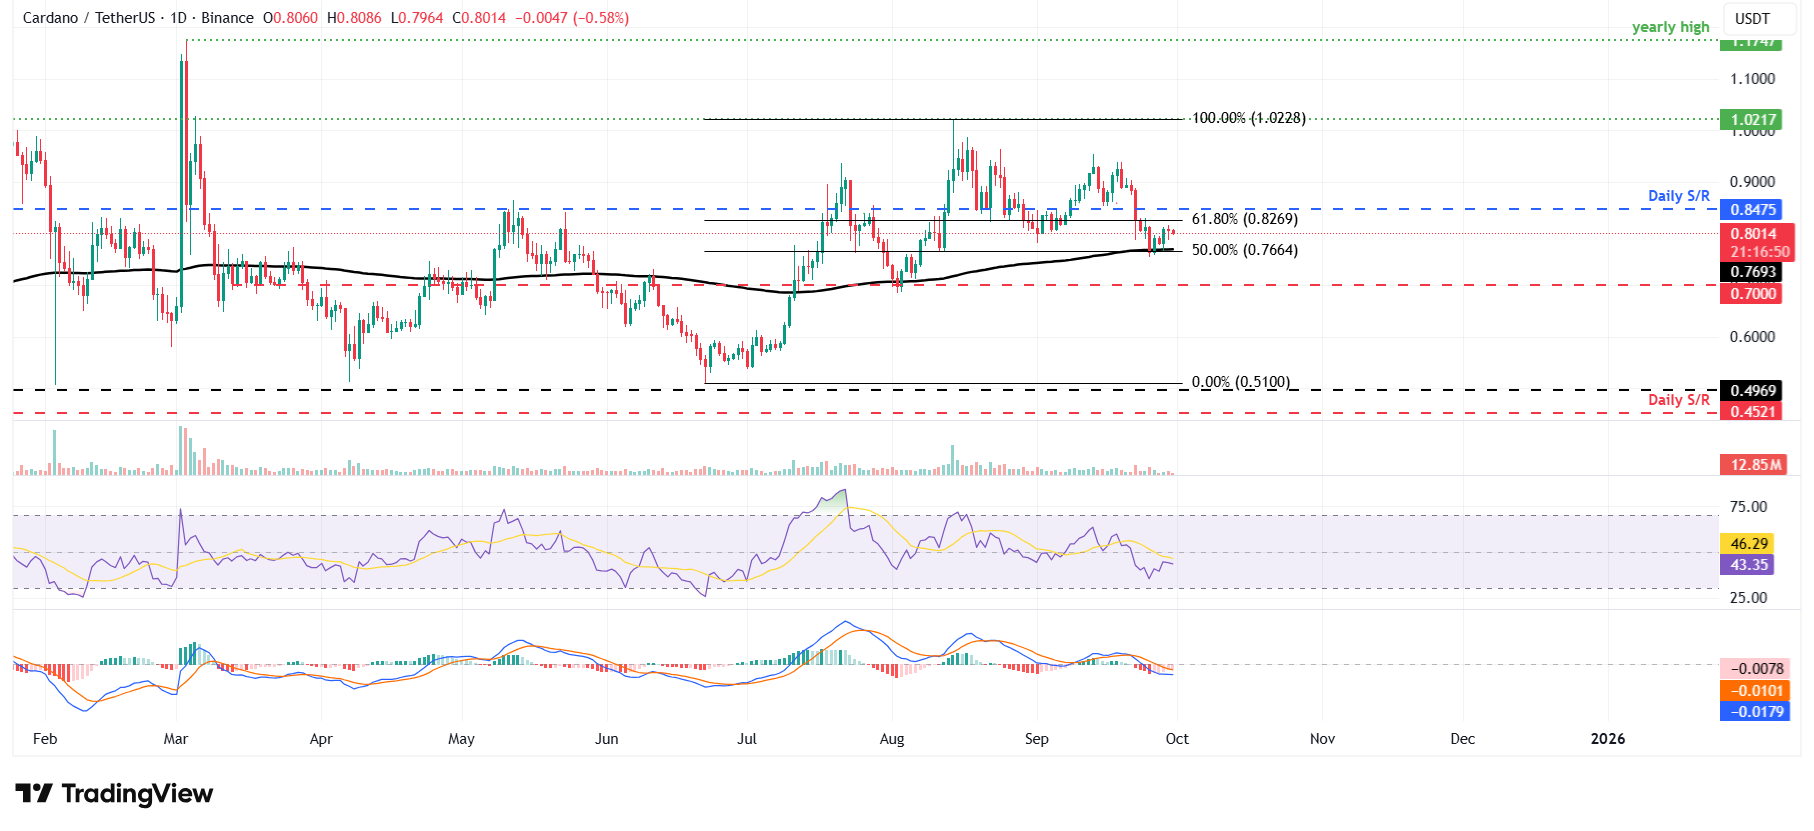
ADA/USDT daily chart
However, if ADA faces a correction, it could extend the decline toward the 200-day EMA at $0.76.

FXStreet
Hơn một triệu người dùng dựa vào FXStreet để có dữ liệu thị trường thời gian thực, công cụ biểu đồ, góc nhìn chuyên gia và tin tức Forex. Lịch kinh tế toàn diện và các hội thảo web giáo dục giúp nhà giao dịch luôn cập nhật và đưa ra quyết định có tính toán. FXStreet có khoảng 60 nhân sự, chia giữa trụ sở Barcelona và nhiều khu vực toàn cầu.
Read More


