
Trade The World
Cardano Price Forecast: ADA stabilizes near $0.42 as on-chain signals point to further recovery
Bởi Manish Chhetri
Ngày xuất bản: 25 Nov 2025 | Ngày chỉnh sửa: 25 Nov 2025


POPULAR ARTICLES

Cardano (ADA) price steadies around $0.42 at the time of writing on Tuesday after gaining nearly 5% in the previous day. On-chain and derivatives data paint a bullish picture, with large whale orders and buy-side dominance rising alongside positive funding rates.
- Cardano price holds around $0.42 on Tuesday, up nearly 5% from the previous day.
- Metrics suggest improving sentiment, with large whale orders, buy-side dominance, and a positive funding rate supporting the recovery outlook.
- The technical setup favors continued upside, with ADA eyeing a potential move toward the $0.50 resistance zone.
Cardano (ADA) price steadies around $0.42 at the time of writing on Tuesday after gaining nearly 5% in the previous day. On-chain and derivatives data paint a bullish picture, with large whale orders and buy-side dominance rising alongside positive funding rates. On the technical side, it also favours further recovery, with ADA targeting $0.50.
On-chain and derivatives data show a bullish bias
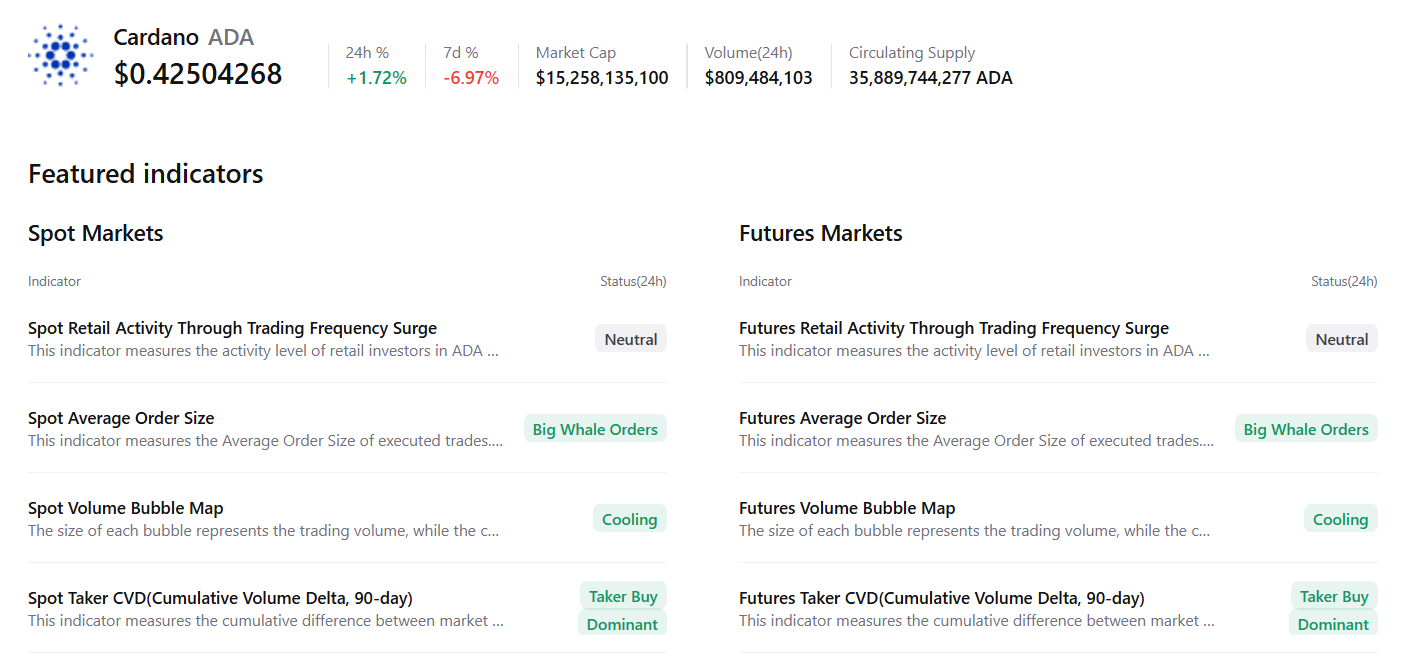
CryptoQuant’s summary data supports the positive outlook, as ADA’s spot and futures markets show large whale orders, cooling conditions, and buy dominance, signaling a potential recovery ahead.
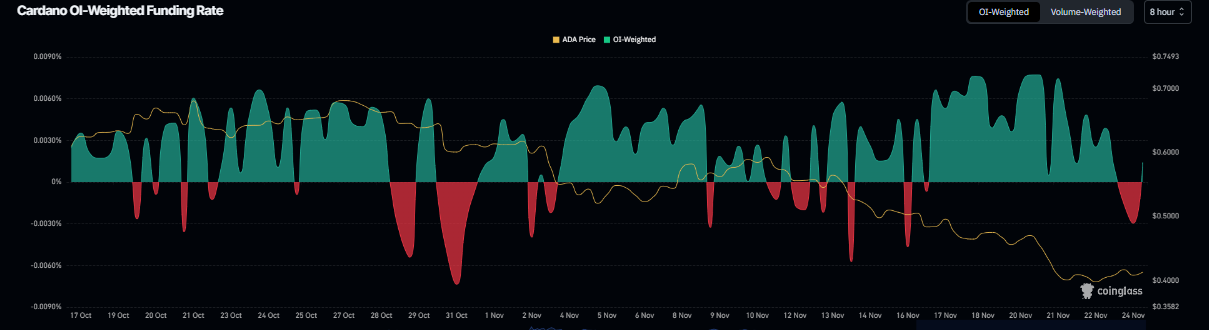
Apart from whale accumulation, derivatives data also support a recovery rally for Cardano. Coinglass’s OI-Weighted Funding Rate data shows that the number of traders betting that the price of ADA will slide further is lower than those anticipating a price increase.
The metric has flipped to a positive rate, standing at 0.0014% on Tuesday, indicating that longs are paying shorts. Historically, as shown in the chart below, when the funding rates have flipped from negative to positive, Cardano’s price has rallied sharply.
Cardano Price Forecast: ADA bulls aiming for the $0.50 mark
Cardano price found support around the lower boundary of the falling wedge pattern (drawn by connecting multiple highs and lows with two trendlines) on Saturday and recovered by 6% in the next two days. At the time of writing on Tuesday, ADA hovers around $0.42.
If ADA continues its recovery, it could extend the rally toward the next daily resistance at $0.49. A successful close above this level could extend additional gains toward the key psychological level at $0.50.
The Relative Strength Index (RSI) on the daily chart reads 30, after slipping below the oversold threshold last week, and is currently pointing upward, suggesting that downside pressure may be moderating as bearish momentum shows early signs of exhaustion. The Moving Average Convergence Divergence (MACD) lines are converging and nearing a bullish crossover, providing further technical support for the potential continuation of the recovery.
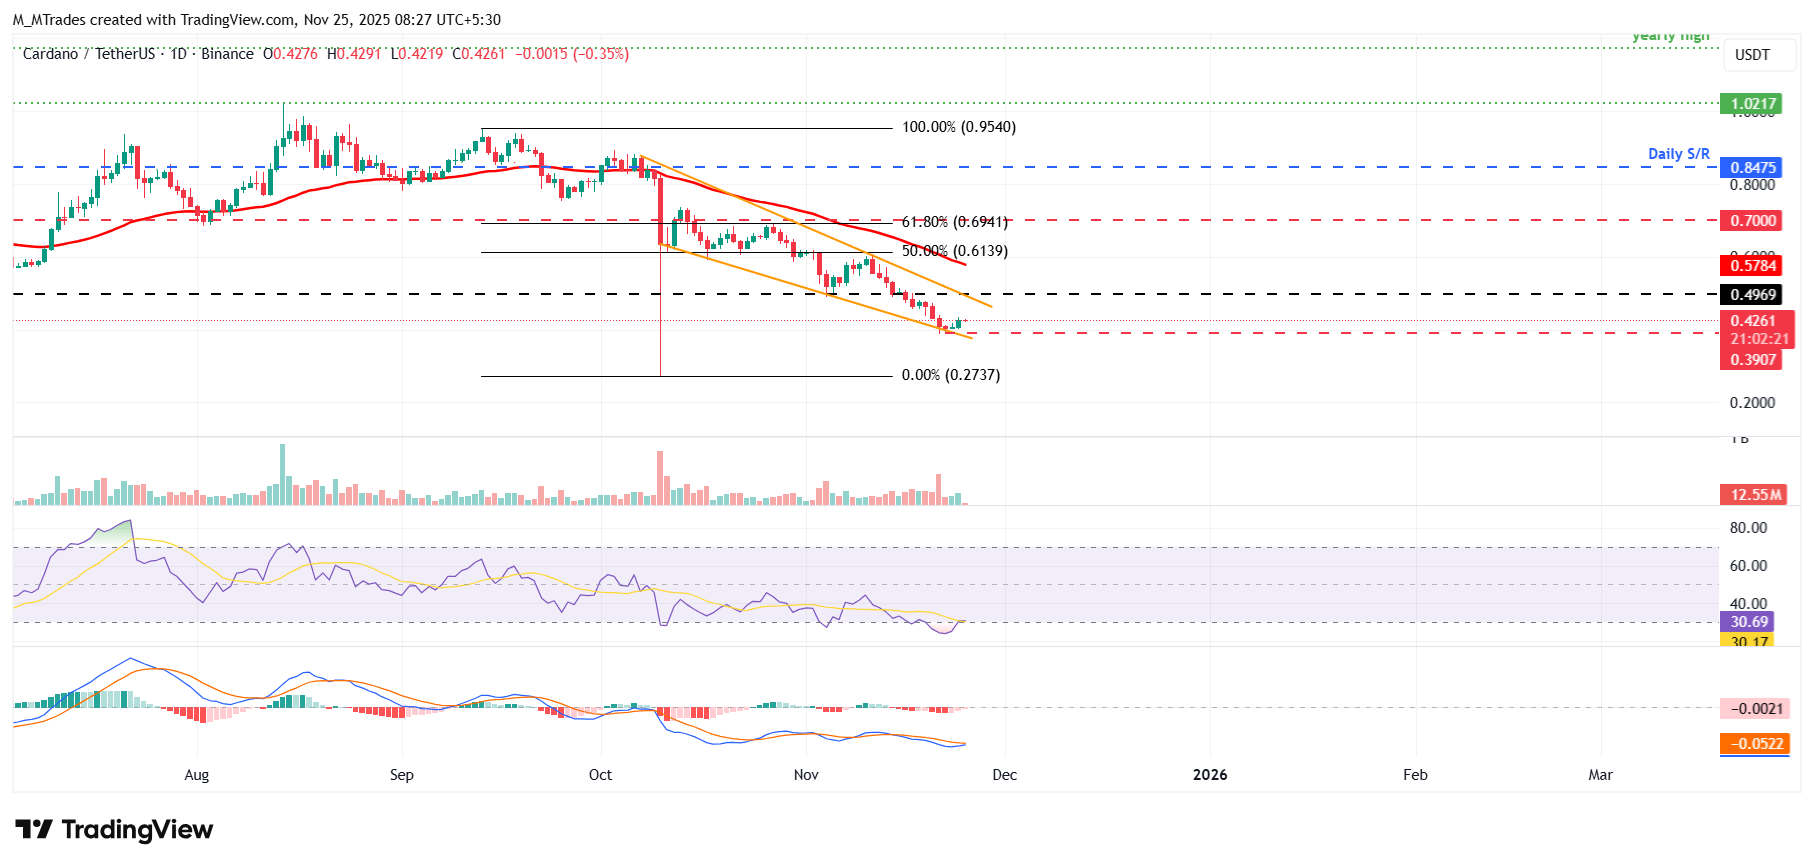
On the other hand, if ADA faces a correction, it could extend the decline toward the lower trendline boundary at around $0.39.

FXStreet
Hơn một triệu người dùng dựa vào FXStreet để có dữ liệu thị trường thời gian thực, công cụ biểu đồ, góc nhìn chuyên gia và tin tức Forex. Lịch kinh tế toàn diện và các hội thảo web giáo dục giúp nhà giao dịch luôn cập nhật và đưa ra quyết định có tính toán. FXStreet có khoảng 60 nhân sự, chia giữa trụ sở Barcelona và nhiều khu vực toàn cầu.
Read More


