
Trade The World
EUR/JPY Price Forecast: Eyes record highs after moving above 178.00
Bởi Akhtar Faruqui
Ngày xuất bản: 10 Nov 2025 | Ngày chỉnh sửa: 10 Nov 2025


POPULAR ARTICLES

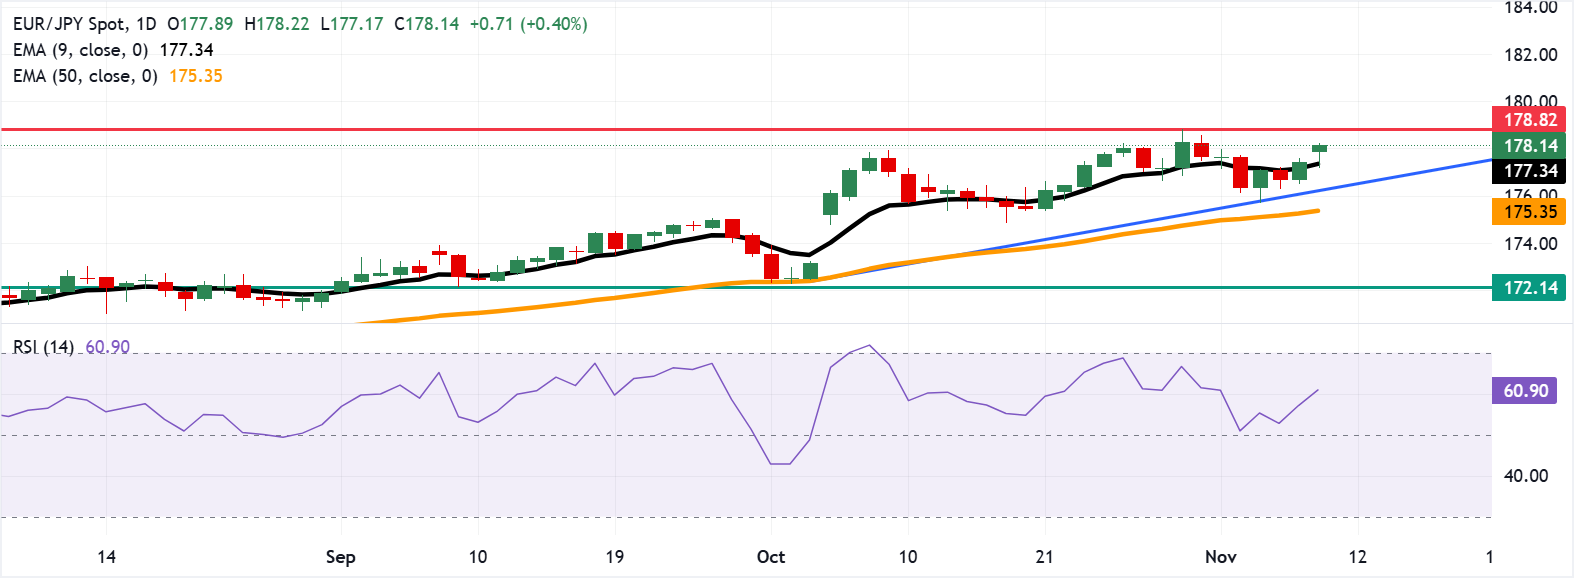
EUR/JPY gains ground for the second successive session, trading around 178.10, higher by more than 0.25%, during the early European hours on Monday. The short-term price momentum is stronger as the currency cross is positioned above the nine-day Exponential Moving Average (EMA).
- EUR/JPY may explore the region around the all-time high of 178.82.
- The 14-day Relative Strength Index remains above the 50 mark, strengthening the bullish bias.
- The initial support lies at the psychological level of 178.00.
EUR/JPY gains ground for the second successive session, trading around 178.10, higher by more than 0.25%, during the early European hours on Monday. The short-term price momentum is stronger as the currency cross is positioned above the nine-day Exponential Moving Average (EMA). Additionally, the 14-day Relative Strength Index (RSI) is remaining above the 50 mark, indicating the strengthening of a bullish bias.
The EUR/JPY cross may target the crucial level of 178.50, followed by the all-time high of 178.82, reached on October 30. A successful break above this level would open the doors for the currency cross to explore the region around the psychological level of 180.00.
On the downside, the immediate support appears at the psychological level of 178.00, followed by the nine-day EMA at 177.33. A break below the latter would weaken the short-term price momentum and prompt the EUR/JPY cross to test the ascending trendline around 176.40, followed by the 50-day EMA at 175.39.
Further declines below this crucial support zone would cause the emergence of the bearish bias and put downward pressure on the EUR/JPY cross to navigate the region around the two-month low of 172.14, which was recorded on September 9.
Euro Price Today
The table below shows the percentage change of Euro (EUR) against listed major currencies today. Euro was the strongest against the Japanese Yen.
| USD | EUR | GBP | JPY | CAD | AUD | NZD | CHF | |
|---|---|---|---|---|---|---|---|---|
| USD | 0.01% | 0.05% | 0.39% | -0.10% | -0.52% | -0.09% | 0.07% | |
| EUR | -0.01% | 0.04% | 0.39% | -0.11% | -0.52% | -0.10% | 0.06% | |
| GBP | -0.05% | -0.04% | 0.39% | -0.16% | -0.57% | -0.14% | 0.03% | |
| JPY | -0.39% | -0.39% | -0.39% | -0.48% | -0.90% | -0.48% | -0.31% | |
| CAD | 0.10% | 0.11% | 0.16% | 0.48% | -0.42% | 0.00% | 0.18% | |
| AUD | 0.52% | 0.52% | 0.57% | 0.90% | 0.42% | 0.42% | 0.60% | |
| NZD | 0.09% | 0.10% | 0.14% | 0.48% | 0.00% | -0.42% | 0.17% | |
| CHF | -0.07% | -0.06% | -0.03% | 0.31% | -0.18% | -0.60% | -0.17% |
The heat map shows percentage changes of major currencies against each other. The base currency is picked from the left column, while the quote currency is picked from the top row. For example, if you pick the Euro from the left column and move along the horizontal line to the US Dollar, the percentage change displayed in the box will represent EUR (base)/USD (quote).

FXStreet
Hơn một triệu người dùng dựa vào FXStreet để có dữ liệu thị trường thời gian thực, công cụ biểu đồ, góc nhìn chuyên gia và tin tức Forex. Lịch kinh tế toàn diện và các hội thảo web giáo dục giúp nhà giao dịch luôn cập nhật và đưa ra quyết định có tính toán. FXStreet có khoảng 60 nhân sự, chia giữa trụ sở Barcelona và nhiều khu vực toàn cầu.
Read More


