
Trade The World
EUR/JPY Price Forecast: Reaches fresh highs above 179.00 near wedge resistance
Bởi Akhtar Faruqui
Ngày xuất bản: 12 Nov 2025 | Ngày chỉnh sửa: 12 Nov 2025


POPULAR ARTICLES

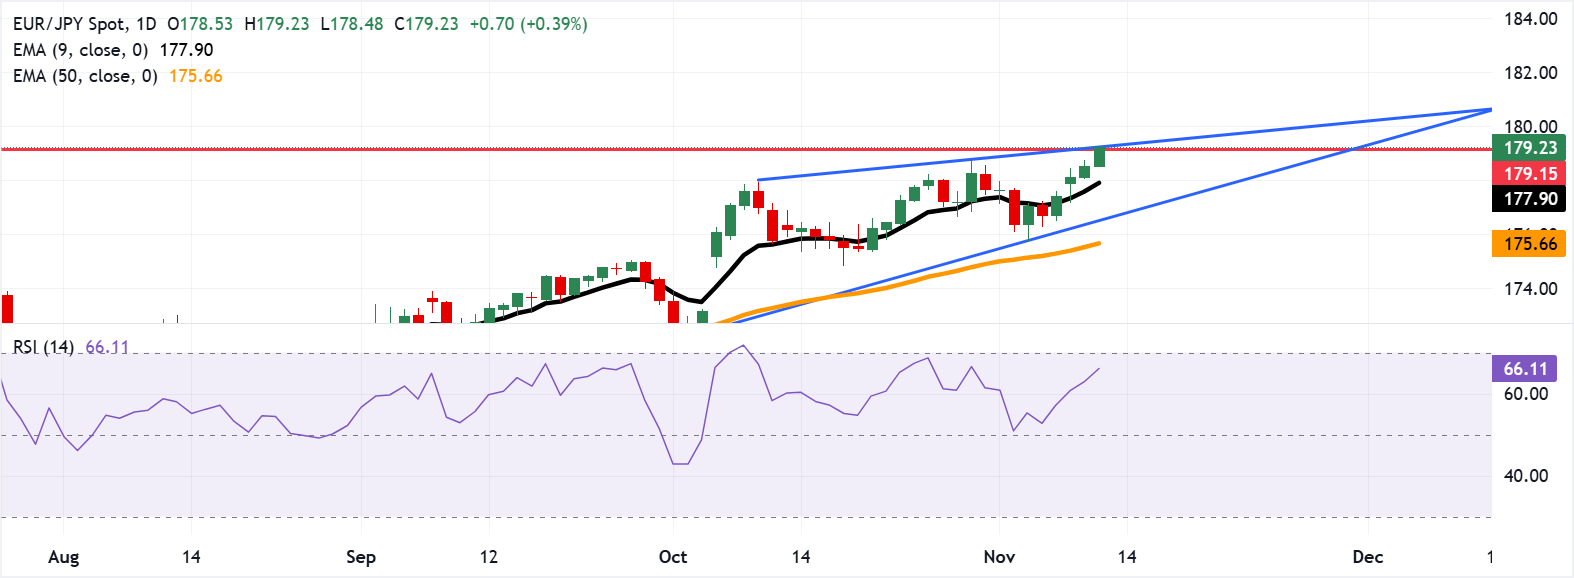
EUR/JPY continues its winning streak for the fourth successive session, trading around 179.10 during the European hours on Wednesday. The currency cross is testing resistance within a bearish pattern, trading near the upper boundary of an ascending wedge pattern.
- EUR/JPY reached a record high of 179.15, near the ascending wedge’s upper boundary.
- The 14-day Relative Strength Index rises toward the 70 level, reaching the overbought territory.
- The immediate support lies at the psychological level of 179.00.
EUR/JPY continues its winning streak for the fourth successive session, trading around 179.10 during the European hours on Wednesday. The currency cross is testing resistance within a bearish pattern, trading near the upper boundary of an ascending wedge pattern. A potential reversal could occur if the price fails to break out convincingly and instead turns lower.
The 14-day Relative Strength Index (RSI) is climbing toward the 70 mark, reinforcing the bullish bias. However, a move above 70 would signal overbought conditions and raise the likelihood of a near-term downward correction. The EUR/JPY cross suggests a stronger short-term momentum, trading above the nine-day Exponential Moving Average (EMA).
On the upside, the EUR/JPY cross is trading near a fresh all-time high of 179.15, reached during earlier Asian hours, with testing the ascending wedge’s upper boundary. A break above this confluence resistance area would open the doors for the currency cross to explore the region around the psychological level of 180.00.
The initial support appears at the psychological level of 179.00, followed by the nine-day EMA at 177.90. A break below the latter would weaken the short-term price momentum and prompt the EUR/JPY cross to test the descending boundary of the ascending wedge around 176.50, followed by the 50-day EMA at 175.66.
Euro Price Today
The table below shows the percentage change of Euro (EUR) against listed major currencies today. Euro was the strongest against the Japanese Yen.
| USD | EUR | GBP | JPY | CAD | AUD | NZD | CHF | |
|---|---|---|---|---|---|---|---|---|
| USD | 0.00% | 0.06% | 0.40% | 0.00% | -0.08% | 0.03% | -0.10% | |
| EUR | -0.01% | 0.06% | 0.39% | -0.01% | -0.08% | 0.02% | -0.09% | |
| GBP | -0.06% | -0.06% | 0.35% | -0.07% | -0.14% | -0.03% | -0.14% | |
| JPY | -0.40% | -0.39% | -0.35% | -0.41% | -0.49% | -0.38% | -0.48% | |
| CAD | 0.00% | 0.00% | 0.07% | 0.41% | -0.08% | 0.02% | -0.08% | |
| AUD | 0.08% | 0.08% | 0.14% | 0.49% | 0.08% | 0.11% | 0.00% | |
| NZD | -0.03% | -0.02% | 0.03% | 0.38% | -0.02% | -0.11% | -0.11% | |
| CHF | 0.10% | 0.09% | 0.14% | 0.48% | 0.08% | 0.00% | 0.11% |
The heat map shows percentage changes of major currencies against each other. The base currency is picked from the left column, while the quote currency is picked from the top row. For example, if you pick the Euro from the left column and move along the horizontal line to the US Dollar, the percentage change displayed in the box will represent EUR (base)/USD (quote).

FXStreet
Hơn một triệu người dùng dựa vào FXStreet để có dữ liệu thị trường thời gian thực, công cụ biểu đồ, góc nhìn chuyên gia và tin tức Forex. Lịch kinh tế toàn diện và các hội thảo web giáo dục giúp nhà giao dịch luôn cập nhật và đưa ra quyết định có tính toán. FXStreet có khoảng 60 nhân sự, chia giữa trụ sở Barcelona và nhiều khu vực toàn cầu.
Read More


