
Trade The World
EUR/JPY Price Forecast: Reaches record highs above 178.50 as bullish bias persists
Bởi Akhtar Faruqui
Ngày xuất bản: 30 Oct 2025 | Ngày chỉnh sửa: 30 Oct 2025


POPULAR ARTICLES

EUR/JPY gains ground after remaining flat in the previous session, trading around 178.50, near record highs, during the European hours on Thursday.
- EUR/JPY reached the all-time high of 178.71 on Thursday.
- The 14-day Relative Strength Index (RSI) has rebounded toward the 70 level, reinforcing the bullish bias.
- The currency pair may look to test the confluence support area near the nine-day EMA at 177.27.
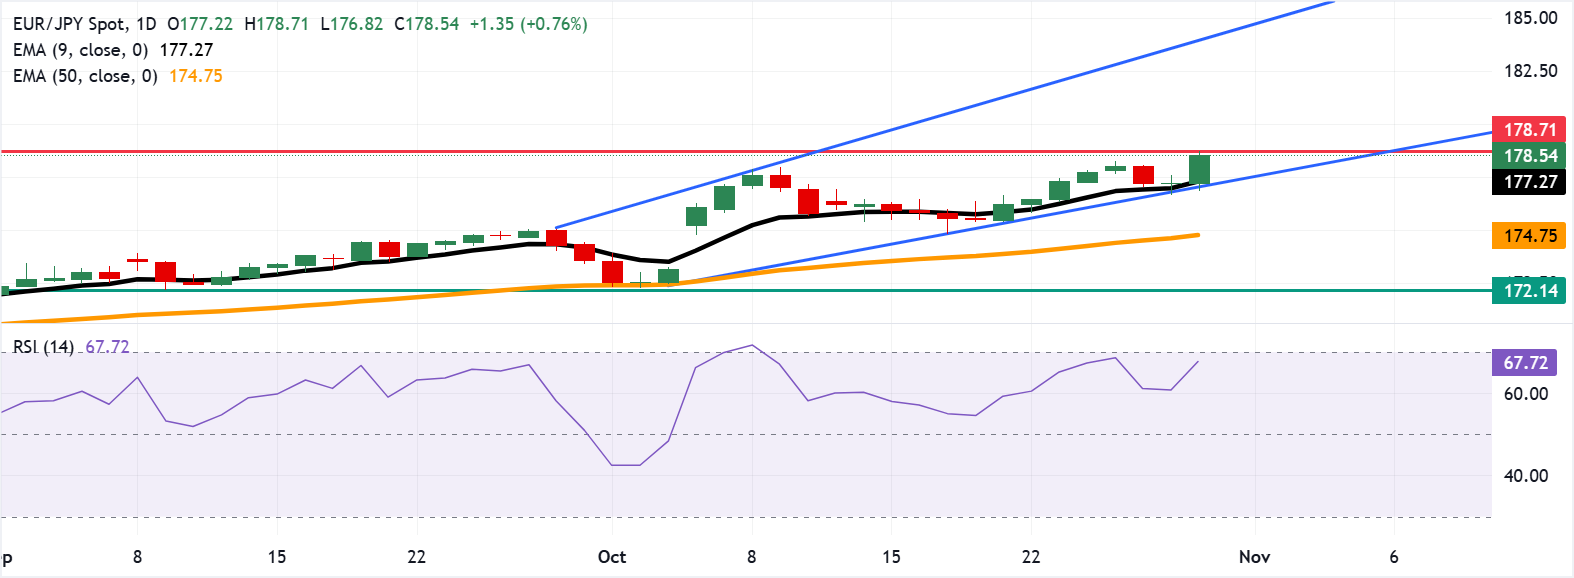
EUR/JPY gains ground after remaining flat in the previous session, trading around 178.50, near record highs, during the European hours on Thursday. The technical analysis of the daily chart suggests strengthening of a bullish bias as the currency cross has rebounded from the confluence support zone around the nine-day Exponential Moving Average (EMA) and lower boundary of the ascending channel pattern.
The short-term price momentum is stronger as the EUR/JPY cross remains above the nine-day EMA. The 14-day Relative Strength Index (RSI) has rebounded toward the 70 mark, strengthening the bullish bias. Further advances would lead the currency cross to reach overbought territory.
The EUR/JPY cross reached the all-time high at 178.71, reached on October 30. Further advances would support the currency cross to explore the region around the upper boundary of the ascending channel around 184.00.
On the downside, the EUR/JPY cross may again target the confluence support zone around the nine-day EMA of 177.27 and the ascending channel’s lower boundary around 177.00. A break below the channel would undermine the short-term bullish momentum, potentially putting downward pressure on the currency pair toward the 50-day EMA region near 174.75, followed by the seven-week low of 172.14, which was recorded on September 9.
EUR/JPY: Daily Chart
Euro Price Today
The table below shows the percentage change of Euro (EUR) against listed major currencies today. Euro was the strongest against the Japanese Yen.
| USD | EUR | GBP | JPY | CAD | AUD | NZD | CHF | |
|---|---|---|---|---|---|---|---|---|
| USD | -0.13% | -0.05% | 0.66% | 0.03% | -0.04% | -0.14% | -0.12% | |
| EUR | 0.13% | 0.08% | 0.80% | 0.17% | 0.09% | -0.00% | 0.01% | |
| GBP | 0.05% | -0.08% | 0.73% | 0.08% | 0.02% | -0.09% | -0.07% | |
| JPY | -0.66% | -0.80% | -0.73% | -0.65% | -0.70% | -0.82% | -0.82% | |
| CAD | -0.03% | -0.17% | -0.08% | 0.65% | -0.06% | -0.17% | -0.16% | |
| AUD | 0.04% | -0.09% | -0.02% | 0.70% | 0.06% | -0.10% | -0.09% | |
| NZD | 0.14% | 0.00% | 0.09% | 0.82% | 0.17% | 0.10% | 0.04% | |
| CHF | 0.12% | -0.01% | 0.07% | 0.82% | 0.16% | 0.09% | -0.04% |
The heat map shows percentage changes of major currencies against each other. The base currency is picked from the left column, while the quote currency is picked from the top row. For example, if you pick the Euro from the left column and move along the horizontal line to the US Dollar, the percentage change displayed in the box will represent EUR (base)/USD (quote).

FXStreet
Hơn một triệu người dùng dựa vào FXStreet để có dữ liệu thị trường thời gian thực, công cụ biểu đồ, góc nhìn chuyên gia và tin tức Forex. Lịch kinh tế toàn diện và các hội thảo web giáo dục giúp nhà giao dịch luôn cập nhật và đưa ra quyết định có tính toán. FXStreet có khoảng 60 nhân sự, chia giữa trụ sở Barcelona và nhiều khu vực toàn cầu.
Read More


