
Trade The World
GBP/JPY Price Analysis: Eyes 200.00 barrier after breaking above nine-day EMA
Bởi Akhtar Faruqui
Ngày xuất bản: 24 Sep 2025 | Ngày chỉnh sửa: 24 Sep 2025


POPULAR ARTICLES

GBP/JPY extends its gains for the third consecutive day, trading around 199.80 during the early European hours on Wednesday.
- GBP/JPY may find its initial resistance at the psychological level of 200.00.
- The 14-day Relative Strength Index stays above 50, reinforcing the bullish bias.
- The immediate support lies at the nine-day EMA of 199.82.
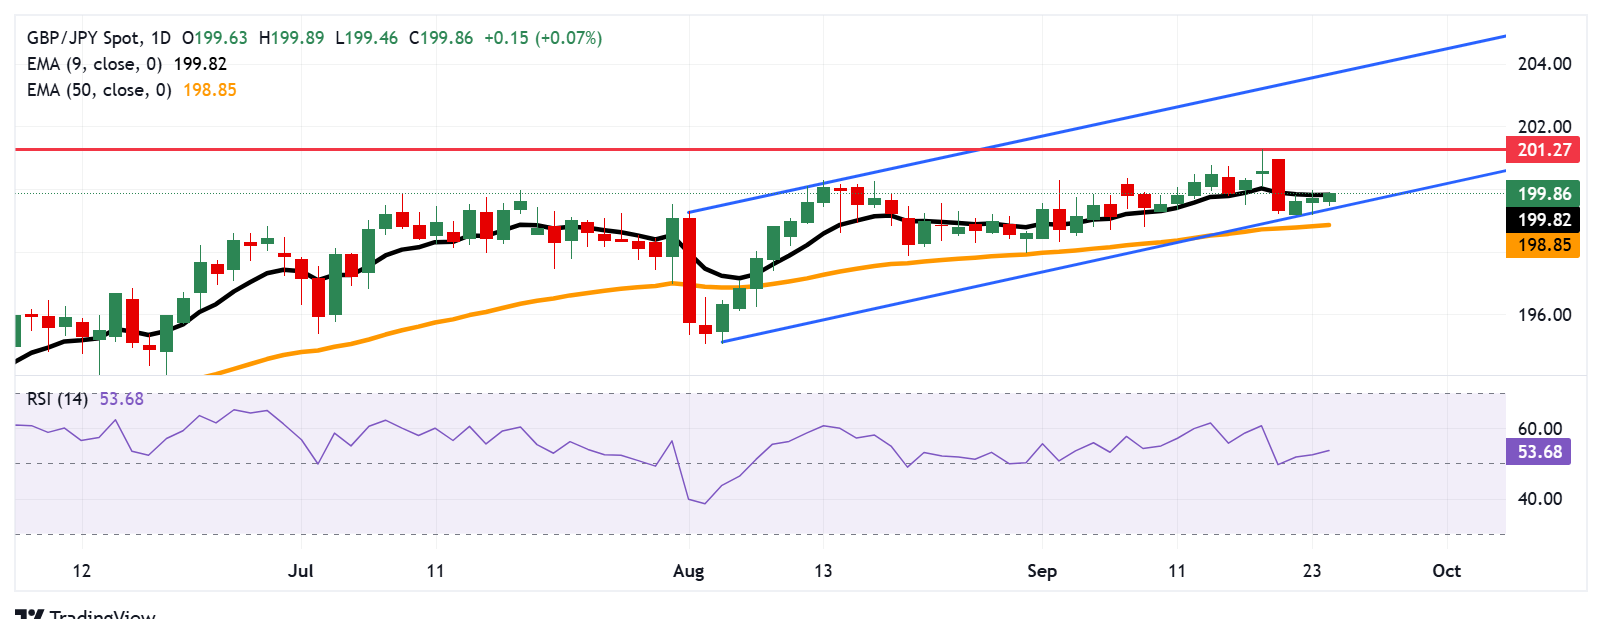
GBP/JPY extends its gains for the third consecutive day, trading around 199.80 during the early European hours on Wednesday. A look at the daily chart shows the currency cross is remaining within an ascending channel pattern, indicating the short-term market price momentum is stronger and confirming bullish confirmation.
Additionally, the 14-day Relative Strength Index (RSI), a key momentum gauge, is positioned slightly above the 50 mark, strengthening the bullish bias. The EUR/JPY cross has just moved above the nine-day Exponential Moving Average (EMA), offering bullish confirmation.
The GBP/JPY cross may find its primary resistance at the psychological level of 200.00, followed by the 14-month high of 201.27, which was reached on September 18. A break above this level would support the market sentiment and prompt the currency cross to explore the region around the ascending channel’s upper boundary at 203.70.
On the downside, the GBP/JPY cross is testing its immediate support at the nine-day EMA of 199.82, followed by the lower boundary of the ascending channel around 199.50. A break below the channel would weaken the bullish bias and put downward pressure on the GBP/JPY cross to test the 50-day EMA at 198.85.
GBP/JPY: Daily Chart
Pound Sterling Price Today
The table below shows the percentage change of British Pound (GBP) against listed major currencies today. British Pound was the strongest against the Japanese Yen.
| USD | EUR | GBP | JPY | CAD | AUD | NZD | CHF | |
|---|---|---|---|---|---|---|---|---|
| USD | 0.23% | 0.21% | 0.31% | 0.13% | -0.33% | 0.14% | 0.16% | |
| EUR | -0.23% | -0.02% | 0.10% | -0.11% | -0.56% | -0.09% | -0.07% | |
| GBP | -0.21% | 0.02% | 0.08% | -0.09% | -0.47% | -0.08% | -0.10% | |
| JPY | -0.31% | -0.10% | -0.08% | -0.21% | -0.63% | -0.25% | -0.18% | |
| CAD | -0.13% | 0.11% | 0.09% | 0.21% | -0.41% | 0.00% | 0.04% | |
| AUD | 0.33% | 0.56% | 0.47% | 0.63% | 0.41% | 0.47% | 0.49% | |
| NZD | -0.14% | 0.09% | 0.08% | 0.25% | -0.01% | -0.47% | 0.05% | |
| CHF | -0.16% | 0.07% | 0.10% | 0.18% | -0.04% | -0.49% | -0.05% |
The heat map shows percentage changes of major currencies against each other. The base currency is picked from the left column, while the quote currency is picked from the top row. For example, if you pick the British Pound from the left column and move along the horizontal line to the US Dollar, the percentage change displayed in the box will represent GBP (base)/USD (quote).

FXStreet
Hơn một triệu người dùng dựa vào FXStreet để có dữ liệu thị trường thời gian thực, công cụ biểu đồ, góc nhìn chuyên gia và tin tức Forex. Lịch kinh tế toàn diện và các hội thảo web giáo dục giúp nhà giao dịch luôn cập nhật và đưa ra quyết định có tính toán. FXStreet có khoảng 60 nhân sự, chia giữa trụ sở Barcelona và nhiều khu vực toàn cầu.
Read More


