
Trade The World
GBP/JPY Price Forecast: Breaks above 203.00 as bulls eye 204.25
Bởi Christian Borjon Valencia
Ngày xuất bản: 11 Nov 2025 | Ngày chỉnh sửa: 11 Nov 2025


POPULAR ARTICLES

The Pound Sterling extended its gains versus the Japanese Yen on Monday, surpassing the 203.00 milestone as it gains over 0.54% clearing key previous resistance level turned support at the 20-day SMA at 202.37.
- GBP/JPY climbs above resistance amid renewed buying, turning 202.37 into key support zone.
- Bulls eye 204.24 and year-to-date high near 205.32 as RSI signals further upside momentum.
- Break below 202.00 risks deeper pullback toward 50-day SMA and November 7 swing low.
The Pound Sterling extended its gains versus the Japanese Yen on Monday, surpassing the 203.00 milestone as it gains over 0.54% clearing key previous resistance level turned support at the 20-day SMA at 202.37.
GBP/JPY Price Forecast: Technical outlook
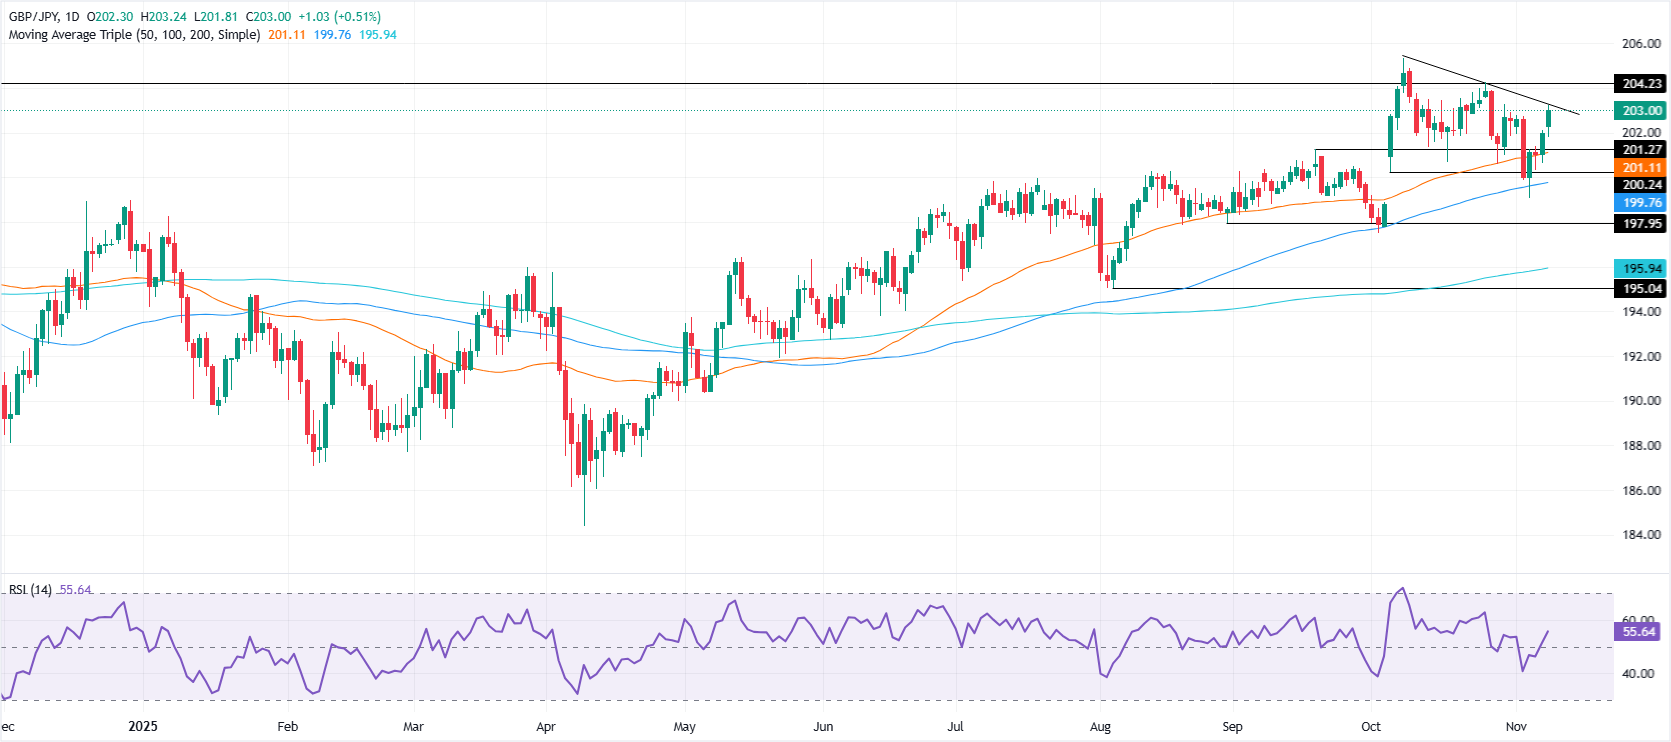
Despite this, the GBP/JPY seems poised to consolidate unless buyers clear the next key resistance at 204.24 October 27 swing high. An uptrend resumption above the latter and the next stop would be the year-to-date (YTD) high at 205.32.
For a bearish scenario, sellers need to push the cross below the 20-dat SMA to test 202.00. Subsequent support rests at the 50-day SMA at 201.27, and a clear break, puts 201.00 to the test ahead of challenging the November 7 daily low of 200.65.
Given the backdrop described and the bullish momentum depicted by the Relative Strength Index (RSI), further upside is seen, but it is crucial for buyers, to hold firm above 203.00.
GBP/JPY Price Chart – Daily
Pound Sterling Price This week
The table below shows the percentage change of British Pound (GBP) against listed major currencies this week. British Pound was the strongest against the Swiss Franc.
| USD | EUR | GBP | JPY | CAD | AUD | NZD | CHF | |
|---|---|---|---|---|---|---|---|---|
| USD | 0.05% | 0.04% | 0.02% | 0.04% | 0.04% | -0.01% | 0.06% | |
| EUR | -0.05% | -0.01% | -0.05% | -0.01% | -0.02% | -0.07% | 0.00% | |
| GBP | -0.04% | 0.01% | 0.00% | -0.01% | -0.01% | -0.05% | 0.01% | |
| JPY | -0.02% | 0.05% | 0.00% | 0.00% | -0.00% | -0.04% | 0.02% | |
| CAD | -0.04% | 0.01% | 0.00% | -0.00% | -0.01% | -0.03% | 0.02% | |
| AUD | -0.04% | 0.02% | 0.00% | 0.00% | 0.00% | -0.04% | 0.00% | |
| NZD | 0.00% | 0.07% | 0.05% | 0.04% | 0.03% | 0.04% | 0.06% | |
| CHF | -0.06% | -0.00% | -0.01% | -0.02% | -0.02% | -0.01% | -0.06% |
The heat map shows percentage changes of major currencies against each other. The base currency is picked from the left column, while the quote currency is picked from the top row. For example, if you pick the British Pound from the left column and move along the horizontal line to the US Dollar, the percentage change displayed in the box will represent GBP (base)/USD (quote).

FXStreet
Hơn một triệu người dùng dựa vào FXStreet để có dữ liệu thị trường thời gian thực, công cụ biểu đồ, góc nhìn chuyên gia và tin tức Forex. Lịch kinh tế toàn diện và các hội thảo web giáo dục giúp nhà giao dịch luôn cập nhật và đưa ra quyết định có tính toán. FXStreet có khoảng 60 nhân sự, chia giữa trụ sở Barcelona và nhiều khu vực toàn cầu.
Read More


