
Trade The World
GBP/JPY Price Forecast: Extends rally above 203.00 on weaker Yen
Bởi Christian Borjon Valencia
Ngày xuất bản: 13 Nov 2025 | Ngày chỉnh sửa: 13 Nov 2025


POPULAR ARTICLES

The Pound Sterling clings to gains versus the Japanese Yen on Wednesday, gains over 0.31%, trading at around 203.16 boosted by overall JPY weakness across the board.
- GBP/JPY trades near 203.16, boosted by widespread Yen weakness following comments from new PM Sanae Takaichi.
- Pair eyes resistance at 204.00 and 204.28, with a break opening path toward yearly high at 205.32.
- RSI points to sustained upside bias, though a drop below 202.45 could expose 201.35 support zone.
The Pound Sterling clings to gains versus the Japanese Yen on Wednesday, gains over 0.31%, trading at around 203.16 boosted by overall JPY weakness across the board.
News from Japan, revealed that the newest Prime Minister Sanae Takaichi supports a weaker yen, to stimulate the economy to accelerate economic growth and despite sparking inflation.
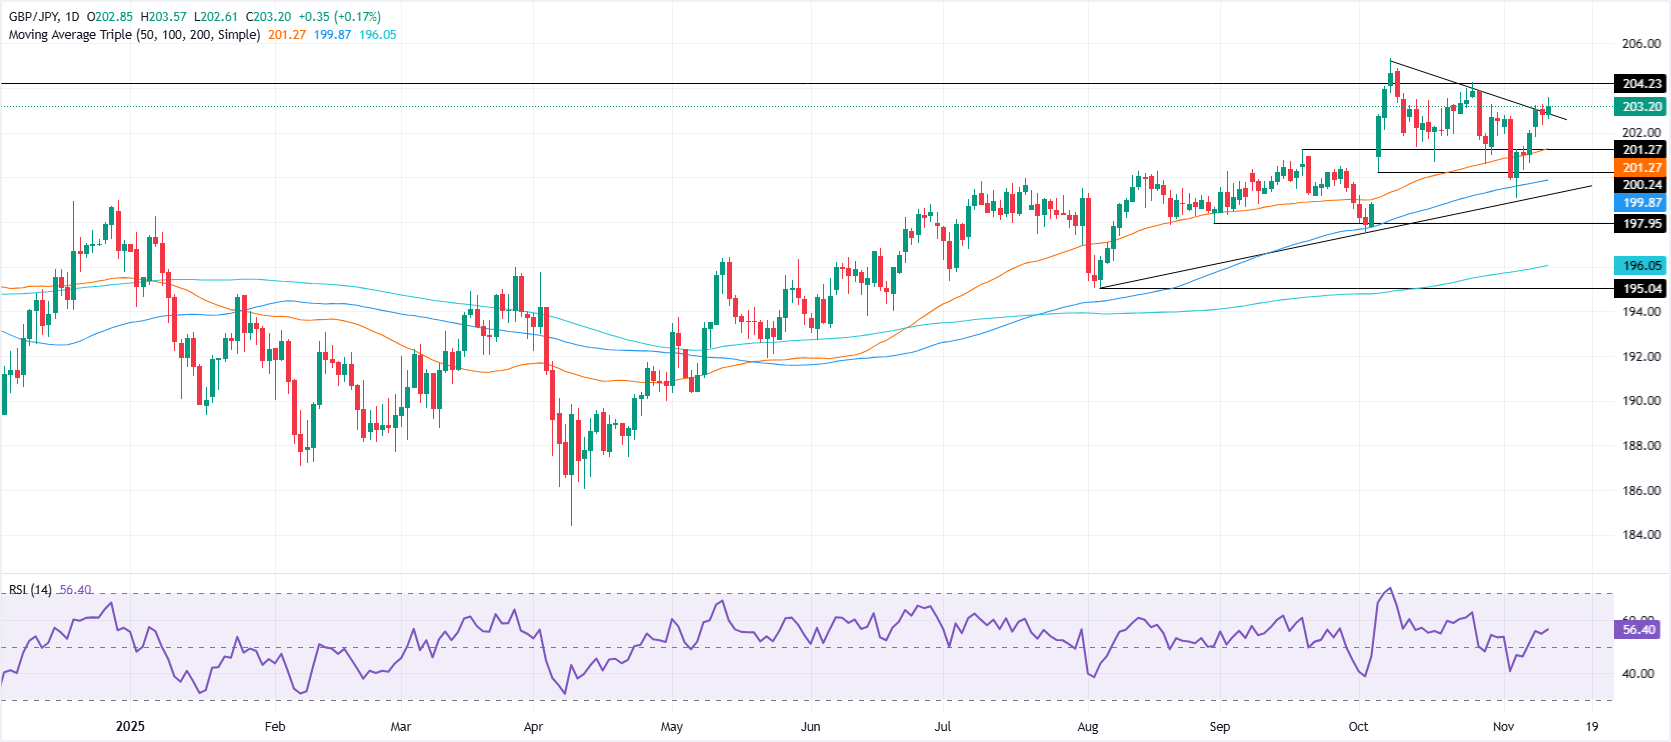
GBP/JPY Price Forecast: Technical outlook
The GBP/JPY uptrend is set to extend, after reaching a 2-week high of 203.57. Further gains lie overhead, like 204.00, followed by the October 27 high of 204.28. If surpassed, the next stop would be the yearly peak at 205.32, hit in early October.
The Relative Strength Index (RSI) further confirms bias, but due to its closeness to the 50-neutral level a breach beneath the latter could drive the GBP/JPY lower.
A sharp reversal below the 20-day SMA at 202.45 could drive the GBP/JPY towards the 50-day SMA at 201.35.
GBP/JPY Price Chart – Daily
Japanese Yen Price This week
The table below shows the percentage change of Japanese Yen (JPY) against listed major currencies this week. Japanese Yen was the strongest against the US Dollar.
| USD | EUR | GBP | JPY | CAD | AUD | NZD | CHF | |
|---|---|---|---|---|---|---|---|---|
| USD | -0.30% | 0.14% | 0.53% | -0.32% | -0.70% | -0.70% | -0.99% | |
| EUR | 0.30% | 0.42% | 0.86% | -0.05% | -0.43% | -0.44% | -0.72% | |
| GBP | -0.14% | -0.42% | 0.53% | -0.47% | -0.85% | -0.86% | -1.13% | |
| JPY | -0.53% | -0.86% | -0.53% | -0.90% | -1.27% | -1.27% | -1.60% | |
| CAD | 0.32% | 0.05% | 0.47% | 0.90% | -0.29% | -0.39% | -0.74% | |
| AUD | 0.70% | 0.43% | 0.85% | 1.27% | 0.29% | -0.01% | -0.29% | |
| NZD | 0.70% | 0.44% | 0.86% | 1.27% | 0.39% | 0.01% | -0.28% | |
| CHF | 0.99% | 0.72% | 1.13% | 1.60% | 0.74% | 0.29% | 0.28% |
The heat map shows percentage changes of major currencies against each other. The base currency is picked from the left column, while the quote currency is picked from the top row. For example, if you pick the Japanese Yen from the left column and move along the horizontal line to the US Dollar, the percentage change displayed in the box will represent JPY (base)/USD (quote).

FXStreet
Hơn một triệu người dùng dựa vào FXStreet để có dữ liệu thị trường thời gian thực, công cụ biểu đồ, góc nhìn chuyên gia và tin tức Forex. Lịch kinh tế toàn diện và các hội thảo web giáo dục giúp nhà giao dịch luôn cập nhật và đưa ra quyết định có tính toán. FXStreet có khoảng 60 nhân sự, chia giữa trụ sở Barcelona và nhiều khu vực toàn cầu.
Read More


