
GBP/JPY Price Forecast: RSI eases from overbought territory as upside momentum cools
Bởi Vishal Chaturvedi
Ngày xuất bản: 15 Jan 2026 | Ngày chỉnh sửa: 15 Jan 2026


BÀI VIẾT PHỔ BIẾN

The British Pound (GBP) weakens against the Japanese Yen (JPY) on Thursday as renewed intervention speculation supports the Yen after its recent slump. At the time of writing, GBP/JPY hovers near 212.35, extending losses for a second consecutive day while holding near multi-year highs.
- GBP/JPY eases as renewed intervention speculation lends support to the Japanese Yen.
- Stronger-than-expected UK GDP fails to provide lasting support for Sterling.
- The broader technical structure remains bullish, though momentum is showing early signs of cooling.
The British Pound (GBP) weakens against the Japanese Yen (JPY) on Thursday as renewed intervention speculation supports the Yen after its recent slump. At the time of writing, GBP/JPY hovers near 212.35, extending losses for a second consecutive day while holding near multi-year highs.
Meanwhile, Sterling drew limited support from stronger-than-expected UK economic data. The latest report showed Gross Domestic Product (GDP) rose 0.3% MoM in November, beating expectations of 0.1% and improving from October’s 0.1% contraction.
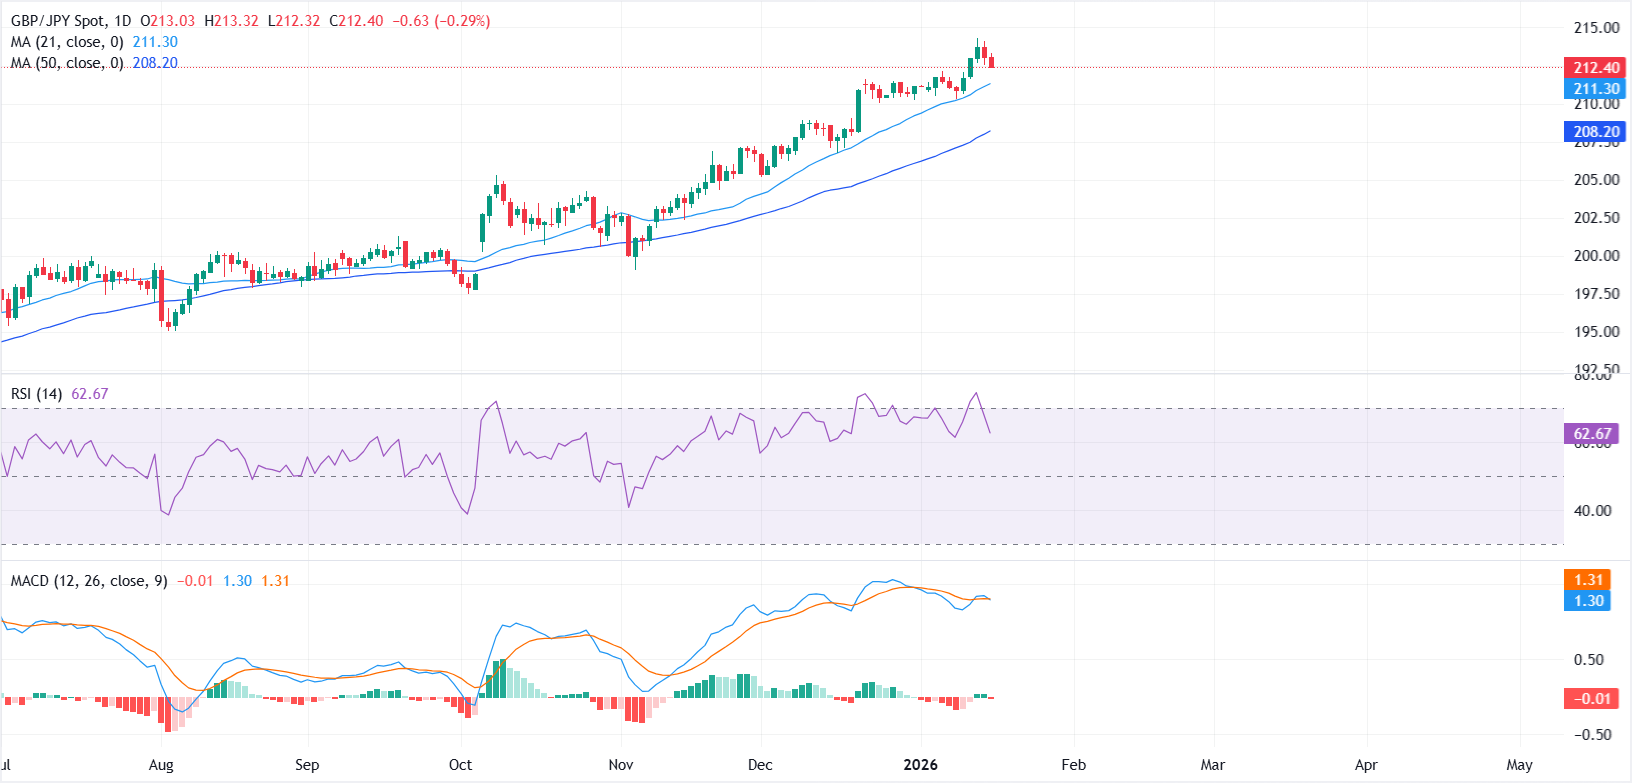
From a technical standpoint, GBP/JPY remains within a well-defined uptrend, with the daily chart showing a clear sequence of higher highs and higher lows, reinforcing the broader bullish structure. However, momentum has started to cool after recent overbought conditions.
The 21-day Simple Moving Average (SMA) continues to rise above the 50-day SMA, underscoring a bullish setup, with price holding above both to maintain an upward bias. The 21-day SMA, near 211.30, offers nearby dynamic support, followed by the 50-day SMA around 208.20.
On the upside, a sustained break above the 214.00 psychological level would signal a continuation of the prevailing uptrend, opening the door toward the 215.00 handle, with scope for a further extension toward the 216.00 region.
Meanwhile, the Moving Average Convergence Divergence (MACD) histogram is hovering slightly below the zero line, with the MACD line marginally under the Signal line, suggesting cooling bullish momentum. The RSI stands around 62, reflecting a pullback from overbought conditions while remaining in positive territory.
Pound Sterling Price Today
The table below shows the percentage change of British Pound (GBP) against listed major currencies today. British Pound was the strongest against the Euro.
| USD | EUR | GBP | JPY | CAD | AUD | NZD | CHF | |
|---|---|---|---|---|---|---|---|---|
| USD | 0.31% | 0.40% | 0.08% | 0.17% | 0.05% | 0.27% | 0.25% | |
| EUR | -0.31% | 0.09% | -0.22% | -0.14% | -0.26% | -0.04% | -0.06% | |
| GBP | -0.40% | -0.09% | -0.32% | -0.23% | -0.35% | -0.13% | -0.15% | |
| JPY | -0.08% | 0.22% | 0.32% | 0.07% | -0.04% | 0.15% | 0.15% | |
| CAD | -0.17% | 0.14% | 0.23% | -0.07% | -0.11% | 0.09% | 0.08% | |
| AUD | -0.05% | 0.26% | 0.35% | 0.04% | 0.11% | 0.22% | 0.19% | |
| NZD | -0.27% | 0.04% | 0.13% | -0.15% | -0.09% | -0.22% | -0.02% | |
| CHF | -0.25% | 0.06% | 0.15% | -0.15% | -0.08% | -0.19% | 0.02% |
The heat map shows percentage changes of major currencies against each other. The base currency is picked from the left column, while the quote currency is picked from the top row. For example, if you pick the British Pound from the left column and move along the horizontal line to the US Dollar, the percentage change displayed in the box will represent GBP (base)/USD (quote).

Hơn một triệu người dùng dựa vào FXStreet để có dữ liệu thị trường thời gian thực, công cụ biểu đồ, góc nhìn chuyên gia và tin tức Forex. Lịch kinh tế toàn diện và các hội thảo web giáo dục giúp nhà giao dịch luôn cập nhật và đưa ra quyết định có tính toán. FXStreet có khoảng 60 nhân sự, chia giữa trụ sở Barcelona và nhiều khu vực toàn cầu.
Đọc thêm


