
Trade The World
GBP/USD Price Forecast: Reaches fresh three-month highs above 1.3550
Bởi Akhtar Faruqui
Ngày xuất bản: 6 Jan 2026 | Ngày chỉnh sửa: 6 Jan 2026


POPULAR ARTICLES

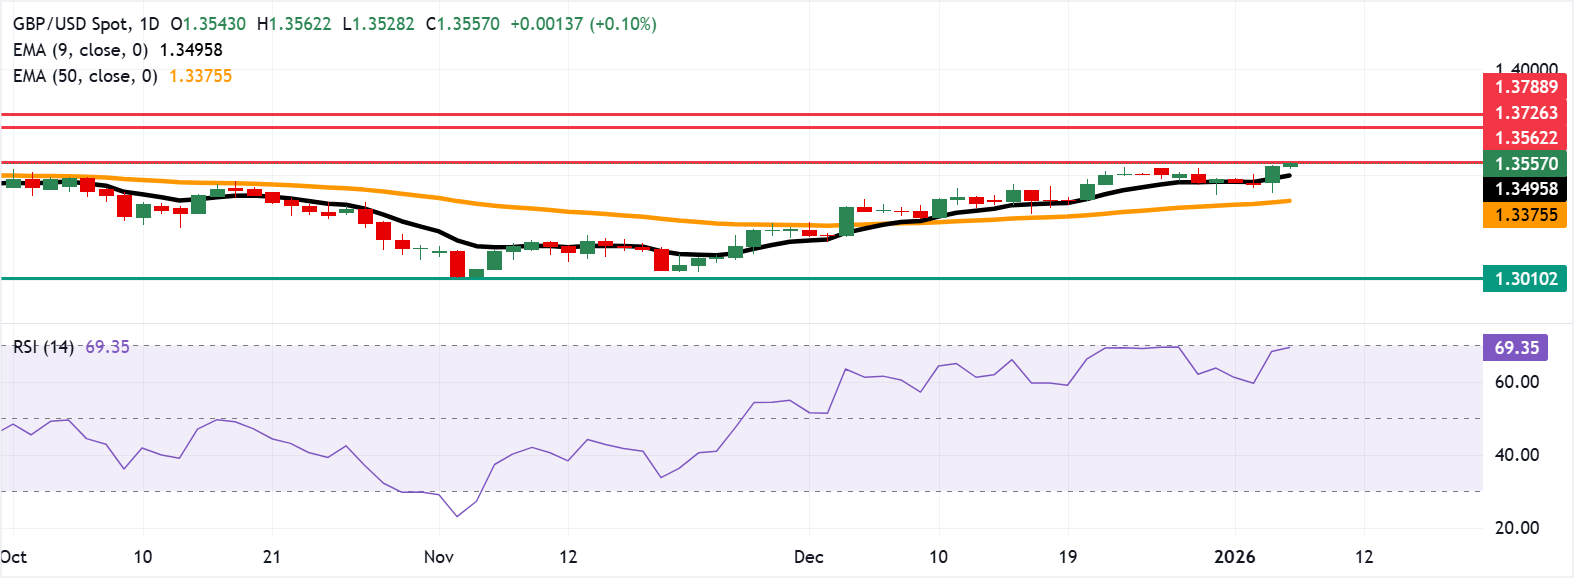
GBP/USD extends its gains for the second successive session, trading around 1.3560 during the Asian hours on Tuesday. The technical analysis of the daily chart indicates a persistent bullish bias. The 14-day Relative Strength Index (RSI) reached 69.29, near overbought.
- GBP/USD hit a fresh three-month high of 1.3562 on Tuesday.
- The 14-day Relative Strength Index is near overbought, signaling possible consolidation before the trend resumes.
- The initial support lies at the nine-day EMA of 1.3496.
GBP/USD extends its gains for the second successive session, trading around 1.3560 during the Asian hours on Tuesday. The technical analysis of the daily chart indicates a persistent bullish bias. The 14-day Relative Strength Index (RSI) reached 69.29, near overbought. If the RSI extends into overbought territory, the pair could consolidate before resuming the trend.
The GBP/USD pair holds above a rising nine-day Exponential Moving Average (EMA) and the 50-day EMA, sustaining a bullish bias. The short-term average remains above the medium-term gauge, keeping upside pressure.
The GBP/USD pair hit a fresh three-month high of 1.3562 during early Asian hours. Further gains could lead the pair to target the six-month high of 1.3726, followed by the 1.3788, the highest level since October 2021.
Momentum stays firm with price action anchored above the ascending averages, yet stretched conditions could cap the next leg. The GBP/USD pair could find immediate support at the nine-day EMA of 1.3496, followed by the 50-day EMA at 1.3375. A break below the medium-term average would put downward pressure on the pair to navigate the region around the eight-month low of 1.3010.
Pound Sterling Price Today
The table below shows the percentage change of British Pound (GBP) against listed major currencies today. British Pound was the strongest against the Japanese Yen.
| USD | EUR | GBP | JPY | CAD | AUD | NZD | CHF | |
|---|---|---|---|---|---|---|---|---|
| USD | -0.09% | -0.09% | 0.00% | -0.00% | -0.20% | -0.22% | -0.07% | |
| EUR | 0.09% | -0.00% | 0.09% | 0.09% | -0.11% | -0.15% | 0.03% | |
| GBP | 0.09% | 0.00% | 0.11% | 0.09% | -0.11% | -0.14% | 0.02% | |
| JPY | 0.00% | -0.09% | -0.11% | -0.00% | -0.20% | -0.24% | -0.06% | |
| CAD | 0.00% | -0.09% | -0.09% | 0.00% | -0.20% | -0.24% | -0.06% | |
| AUD | 0.20% | 0.11% | 0.11% | 0.20% | 0.20% | -0.04% | 0.13% | |
| NZD | 0.22% | 0.15% | 0.14% | 0.24% | 0.24% | 0.04% | 0.17% | |
| CHF | 0.07% | -0.03% | -0.02% | 0.06% | 0.06% | -0.13% | -0.17% |
The heat map shows percentage changes of major currencies against each other. The base currency is picked from the left column, while the quote currency is picked from the top row. For example, if you pick the British Pound from the left column and move along the horizontal line to the US Dollar, the percentage change displayed in the box will represent GBP (base)/USD (quote).
(The technical analysis of this story was written with the help of an AI tool.)

FXStreet
Hơn một triệu người dùng dựa vào FXStreet để có dữ liệu thị trường thời gian thực, công cụ biểu đồ, góc nhìn chuyên gia và tin tức Forex. Lịch kinh tế toàn diện và các hội thảo web giáo dục giúp nhà giao dịch luôn cập nhật và đưa ra quyết định có tính toán. FXStreet có khoảng 60 nhân sự, chia giữa trụ sở Barcelona và nhiều khu vực toàn cầu.
Read More


