
Trade The World
Meme Coins Price Prediction: BONK, FLOKI and PEPE recover as bearish momentum fades
Bởi Manish Chhetri
Ngày xuất bản: 24 Oct 2025 | Ngày chỉnh sửa: 24 Oct 2025


POPULAR ARTICLES

Bonk (BONK), FLOKI (FLOKI) and Pepe (PEPE) prices are holding near key support levels at the time of writing on Friday.
- Bonk price rebounds after finding support at $0.000013, signaling potential for further recovery.
- FLOKI approaches key support around $0.000065 on Friday, which could act as a base for a rebound if sustained.
- Pepe shows early signs of recovery, with momentum indicators pointing to weakening bearish pressure.
Bonk (BONK), FLOKI (FLOKI) and Pepe (PEPE) prices are holding near key support levels at the time of writing on Friday. These three meme coins are showing early signs of stabilization after recent declines, with technical indicators suggesting a fading bearish momentum and hinting at a potential short-term recovery.
Bonk rebounds after finding support around a key level
Bonk price rebounds after retesting the 50% retracement at $0.000013 earlier this week. At the time of writing on Friday, BONK continues its recovery, trading above $0.000014.
If BONK continues its recovery, it could extend the rally toward the 50-day Exponential Moving Average (EMA) at $0.000018, which coincides with a descending trendline. A successful close above this level could extend the gains toward the daily resistance at $0.000022.
The Relative Strength Index (RSI) indicator at 40 points upward on the daily chart, suggesting early signs of fading bearish momentum. For the recovery rally to be sustained, the RSI must move above the neutral level of 50. Moreover, the Moving Average Convergence Divergence (MACD) showed a bullish crossover on Thursday, signaling a buy and supporting the recovery thesis.
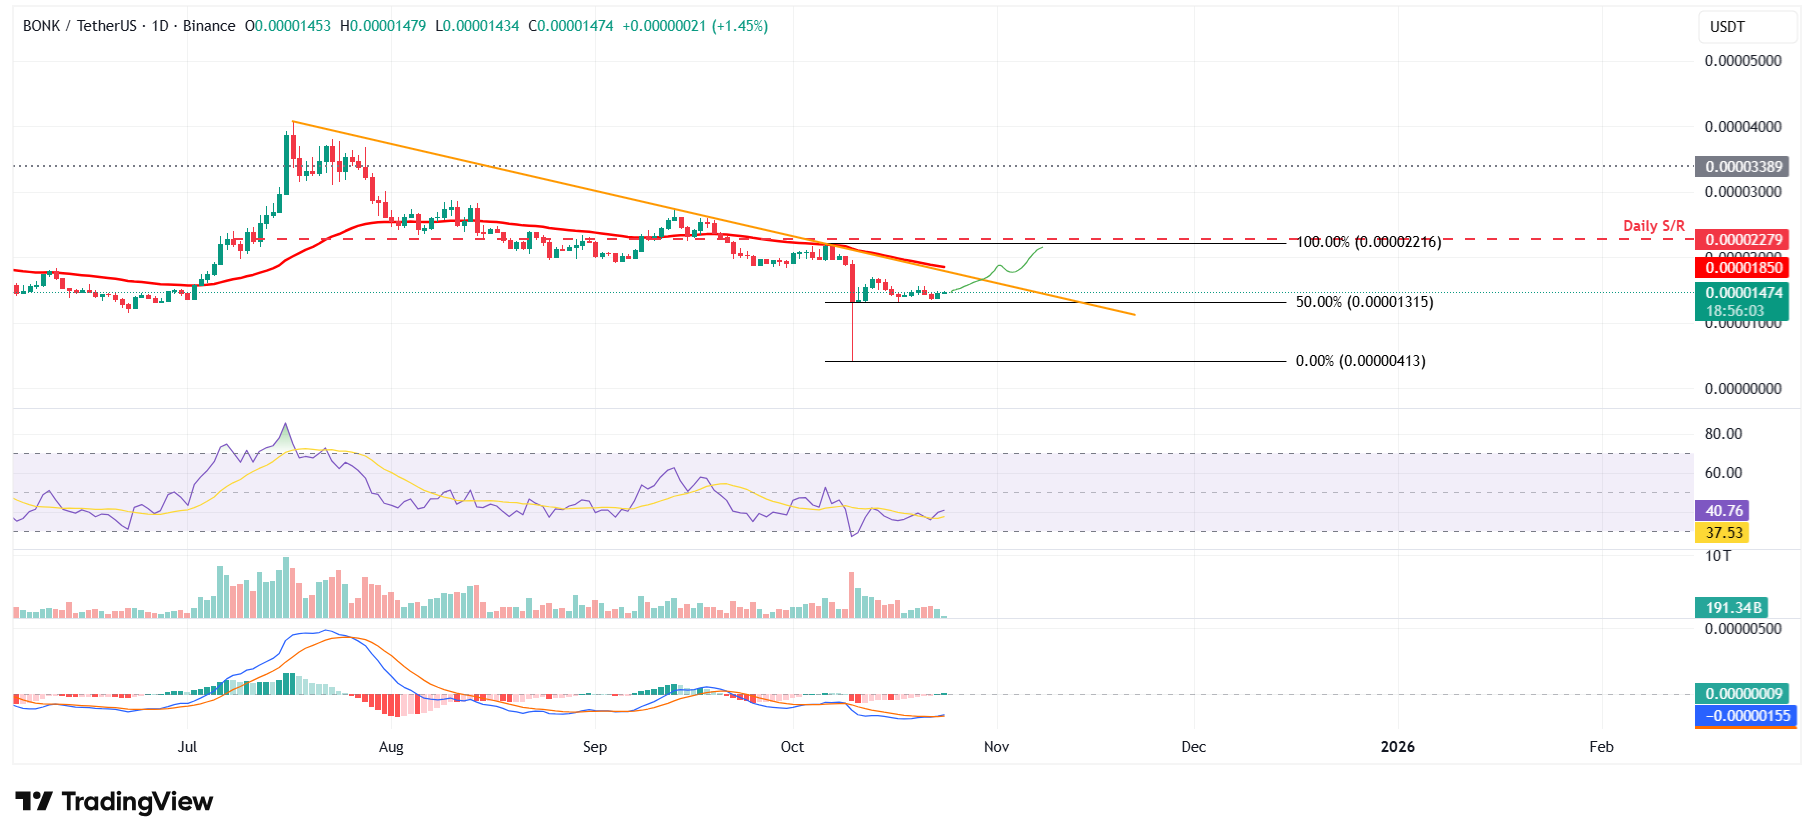
BONK/USDT daily chart
However, if BONK faces a correction, it could extend the decline toward the 50% retracement level at $0.000013.
FLOKI could extend its recovery if it closes above the 50-day EMA
FLOKI price found support around the weekly level at $0.000063 on Sunday and rallied over 19% the next day. However, FLOKI faced rejection from the 50-day EMA at $0.000084 and corrected nearly 10% by mid-week. At the time of writing on Friday, FLOKI trades at around $0.000073.
If FLOKI recovers and closes above the 50-day EMA at $0.000084, it could extend the rally toward the next daily resistance at $0.00011.
The Relative Strength Index (RSI) indicator at 45 points upward on the daily chart, suggesting early signs of fading bearish momentum. For the recovery rally to be sustained, the RSI must move above the neutral level of 50. Moreover, the Moving Average Convergence Divergence (MACD) showed a bullish crossover on Thursday, signaling a buy and supporting the recovery thesis.
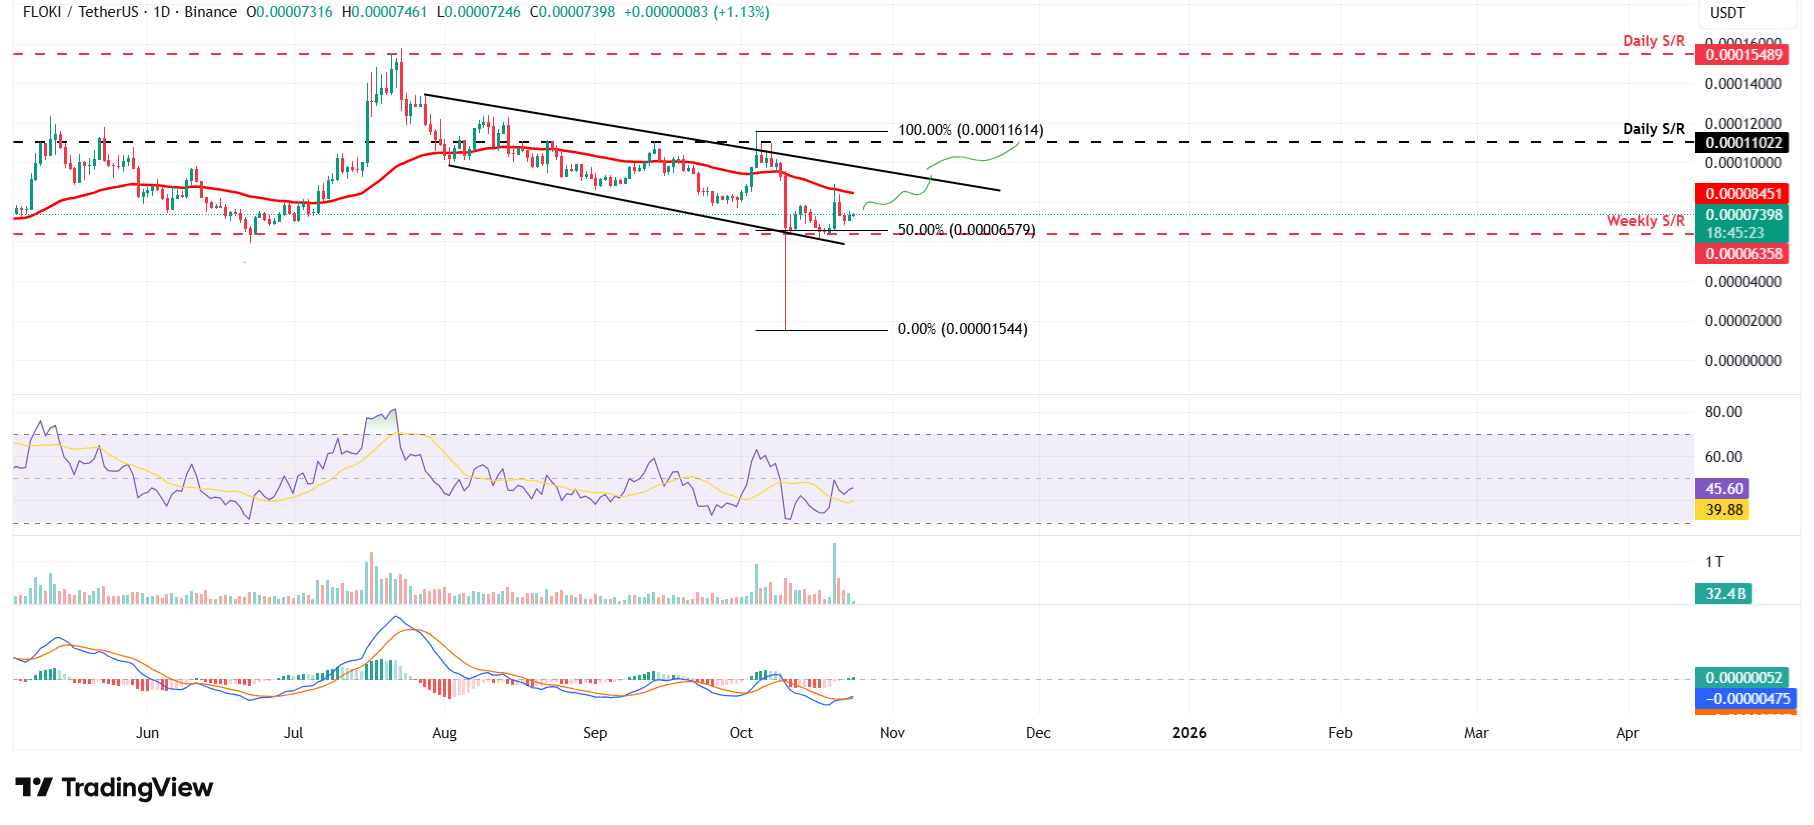
FLOKI/USDT daily chart
On the other hand, if FLOKI faces a correction, it could extend the decline to retest its weekly support at $0.000063.
Pepe shows early signs of recovery as bearish momentum fades
Pepe price retested the 50% retracement level at $0.0000065 on Wednesday and recovered nearly 4% the next day. At the time of writing on Friday, PEPE continues its recovery, trading above $0.0000070.
If PEPE continues its upward momentum, it could extend the rally to retest the daily resistance at $0.0000079. A successful close above this level could extend the gains toward the 50-day EMA at $0.0000087.
Like BONK and FLOKI, Pepe’s RSI and MACD indicators show signs of fading bearish momentum and hint at potential recovery ahead.
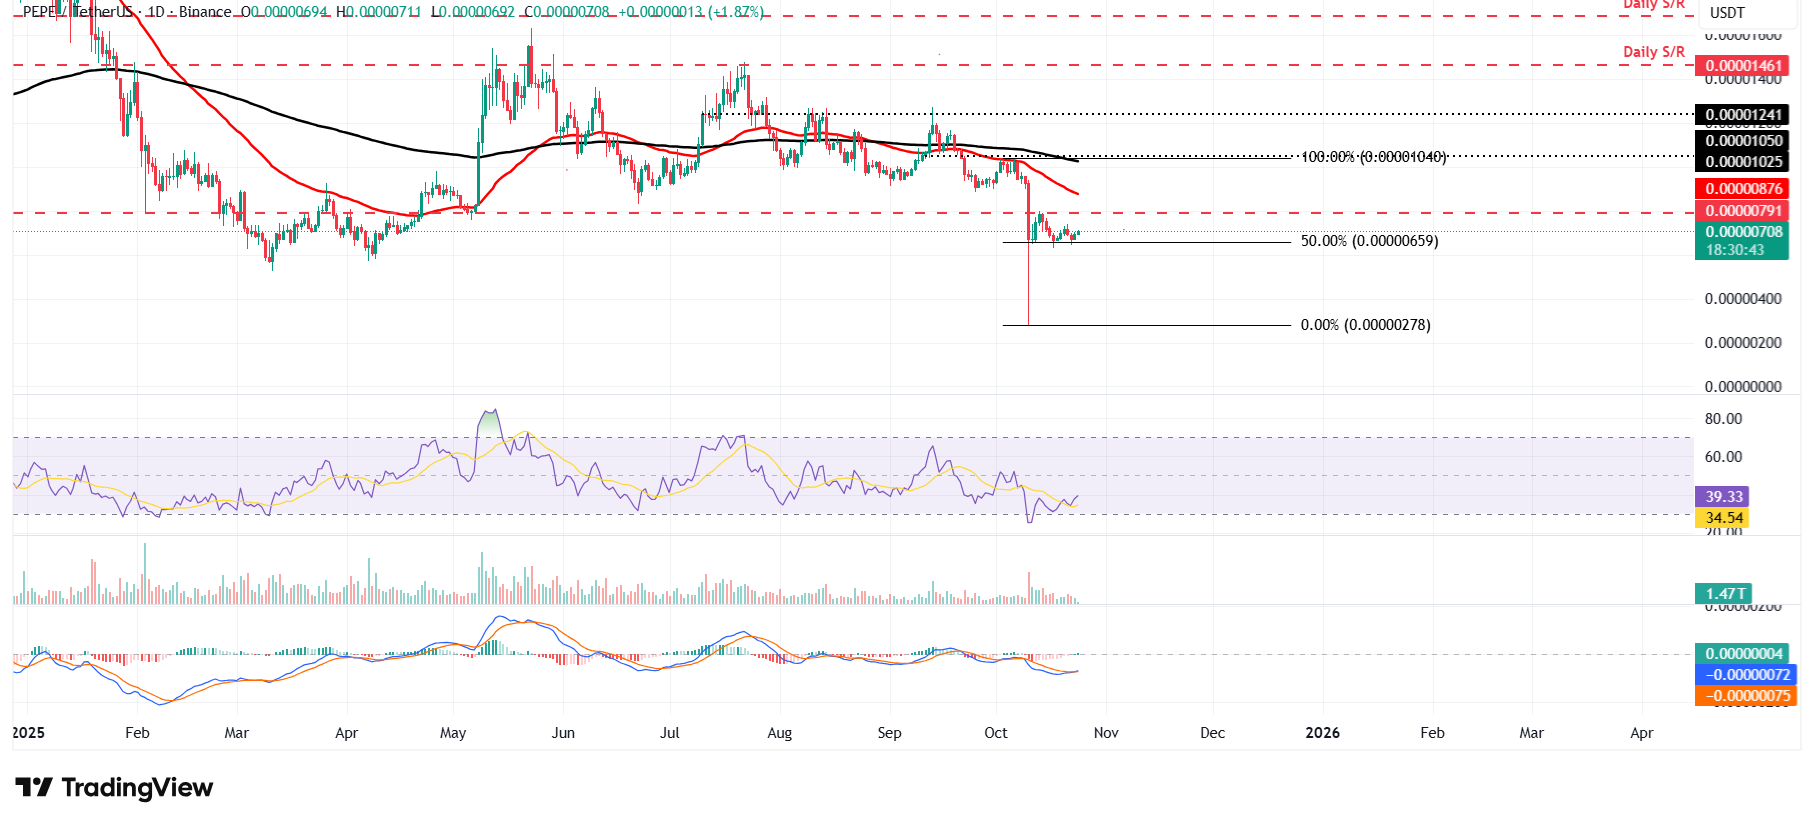
PEPE/USDT daily chart
On the other hand, if PEPE faces a correction, it could extend the decline toward the 50% retracement level at $0.0000065.

FXStreet
Hơn một triệu người dùng dựa vào FXStreet để có dữ liệu thị trường thời gian thực, công cụ biểu đồ, góc nhìn chuyên gia và tin tức Forex. Lịch kinh tế toàn diện và các hội thảo web giáo dục giúp nhà giao dịch luôn cập nhật và đưa ra quyết định có tính toán. FXStreet có khoảng 60 nhân sự, chia giữa trụ sở Barcelona và nhiều khu vực toàn cầu.
Read More


