
Trade The World
Meme Coins Price Prediction: Dogecoin, Shiba Inu, Pepe rally as retail demand returns
Bởi Vishal Dixit
Ngày xuất bản: 27 Oct 2025 | Ngày chỉnh sửa: 27 Oct 2025


POPULAR ARTICLES

Meme Coins, such as Dogecoin (DOGE), Shiba Inu (SHIB), and Pepe (PEPE), are advancing breakout rallies as the broader cryptocurrency market recovers, with Bitcoin crossing above $115,000.
- Dogecoin reclaims $0.20 with a descending triangle breakout, with bulls eyeing further gains.
- Shiba Inu is up 1% on Monday, advancing the 3.50% gains from Sunday.
- Pepe’s steady recovery gains traction as retail interest increases.
Meme Coins, such as Dogecoin (DOGE), Shiba Inu (SHIB), and Pepe (PEPE), are advancing breakout rallies as the broader cryptocurrency market recovers, with Bitcoin crossing above $115,000. Amid the return of hopes for an “Uptober” rally in the market, retail demand is tailwinding the breakouts in DOGE, SHIB, and PEPE.
Technically, the meme coins are gaining traction, but key resistances stand overhead, keeping the situation edgy.
Risk-on sentiment returns among meme coin investors
The sudden recovery on Sunday has boosted interest in top meme coins amid speculation. CoinGlass data shows a 10%, 9%, and 14% rise in Dogecoin, Shiba Inu, and Pepe futures Open Interest (OI) over the last 24 hours, reaching $1.99 billion, $84.07 million, $253.30 million, respectively. An increase in OI suggests more risk exposure from investors with either leverage or new long positions.
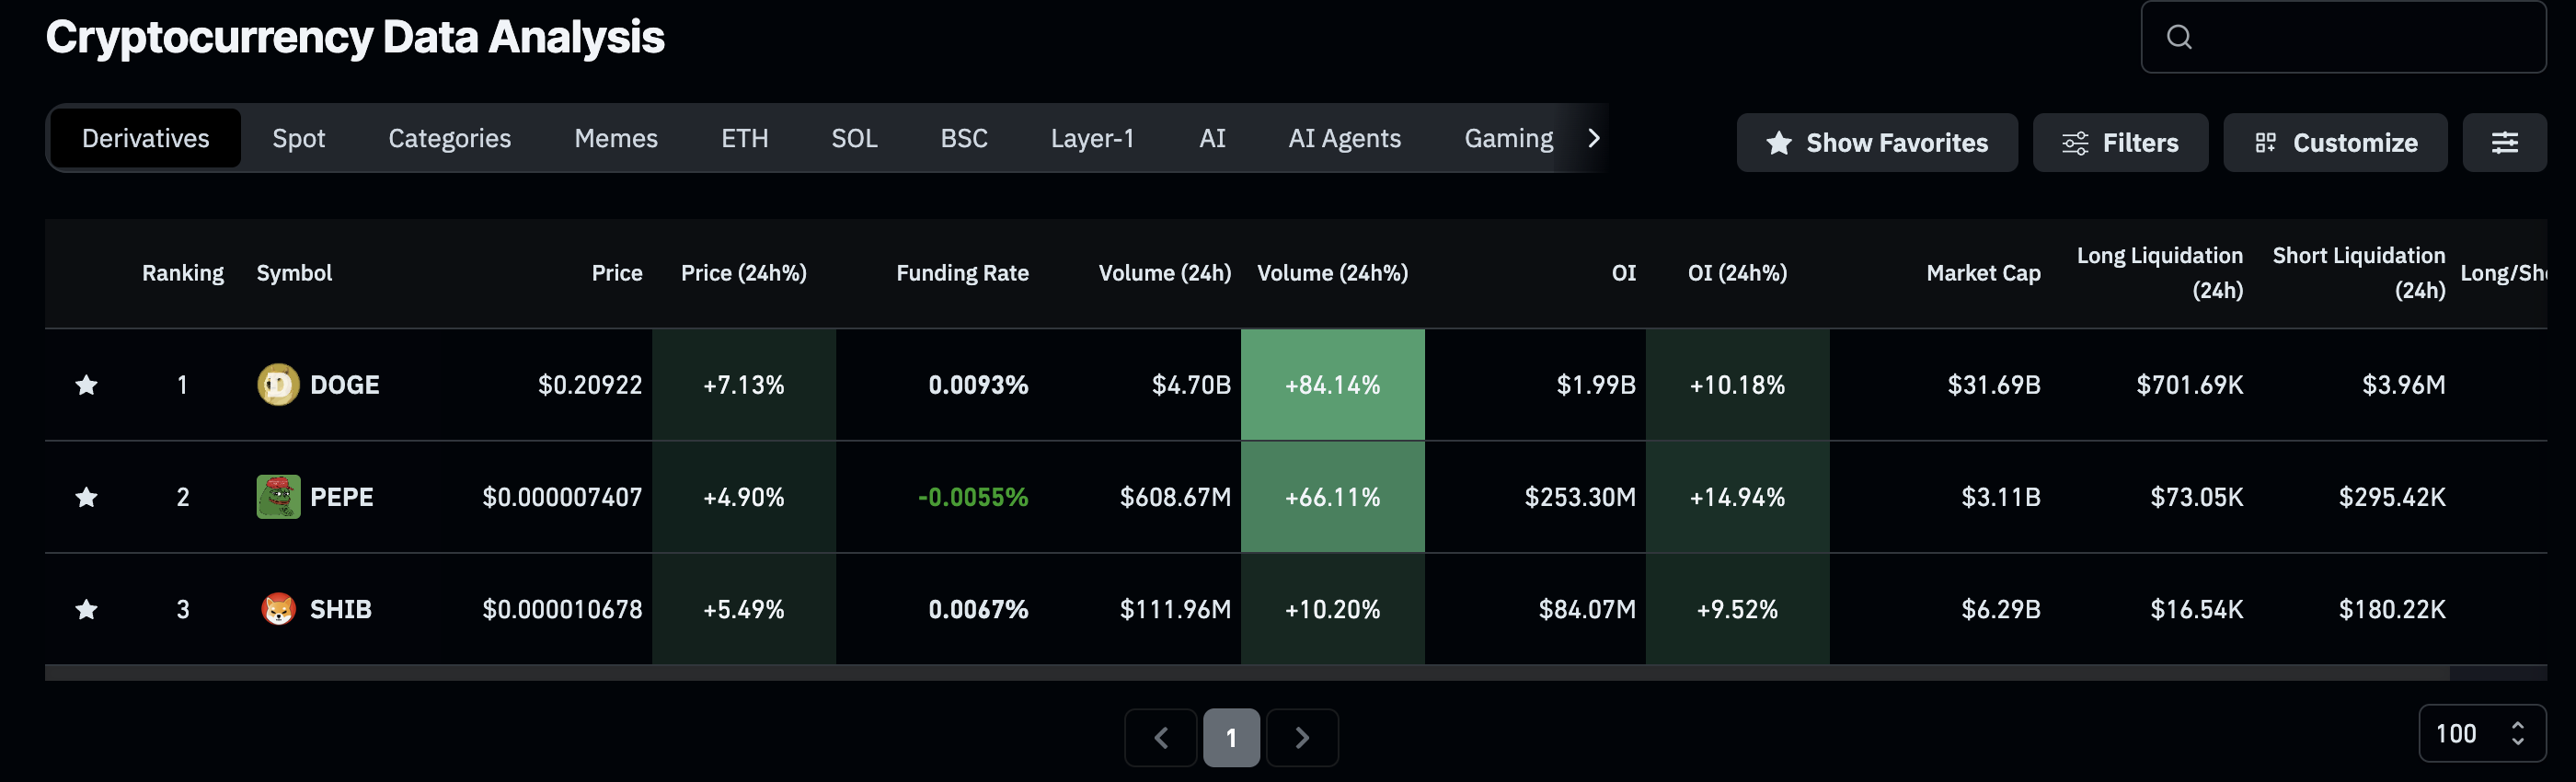
Meme coins derivatives data. Source: CoinGlass
Dogecoin triangle breakout gains traction
Dogecoin edges higher by 1% at press time on Monday, advancing the nearly 5% gains from Sunday. The rebound in DOGE marks a descending triangle pattern on the 4-hour chart, as previously anticipated in an FXStreet report.
Dogecoin’s breakout rally targets the 200-period Exponential Moving Average (EMA) at $0.21490, slightly above the R1 Pivot Point.
Adding to the upside potential, the technical indicators on the same chart suggest a rise in bullish momentum. The Moving Average Convergence Divergence (MACD) indicator shows a steady uptrend in the average line as green histograms rise above the zero line.
At the same time, the Relative Strength Index (RSI) at 72 enters the overbought zone, indicating elevated buying pressure.
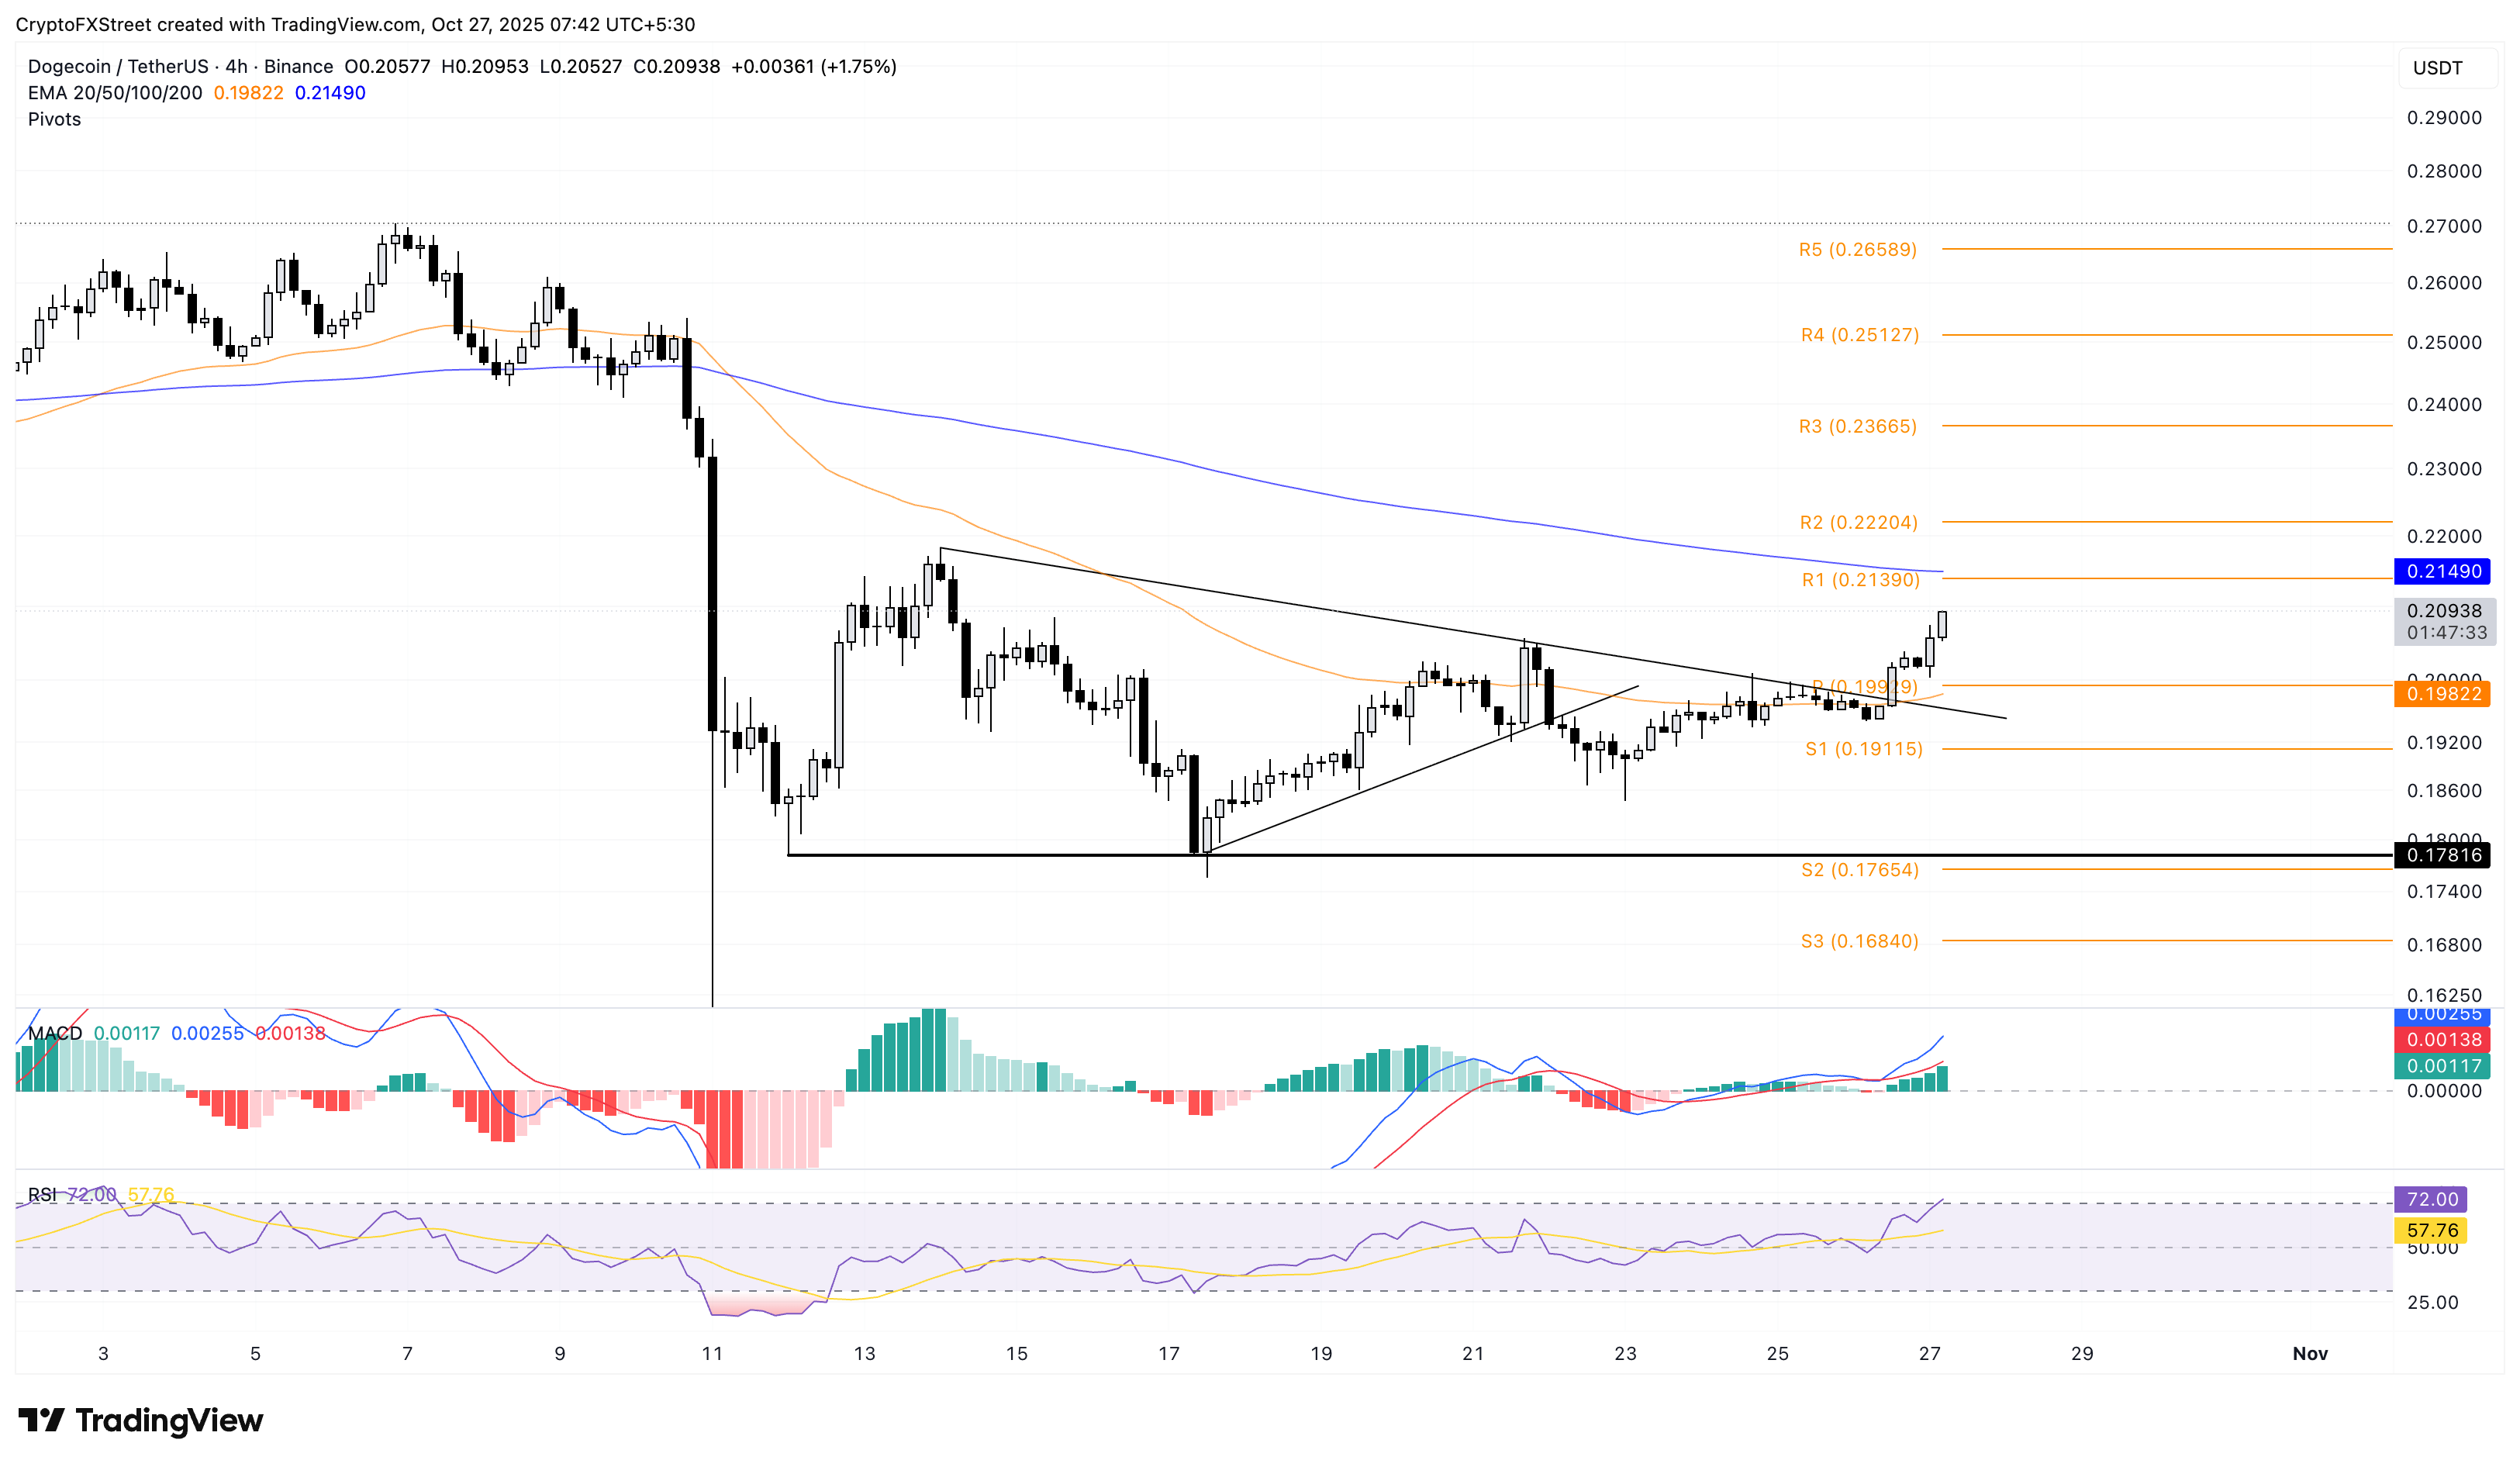
DOGE/USDT 4-hour price chart.
Looking down, if DOGE slips below $0.20000, the immediate support lies at the S1 Pivot Point at $0.19115.
Shiba Inu reclaims key psychological level, eyes further gains
Shiba Inu trades above the $0.00001000 psychological level at the time of writing on Monday, with a nearly 5% rise in the last 24 hours. The meme coin marked a falling channel breakout on the 4-hour chart, aiming for the 200-period EMA at $0.00001104.
A decisive close above this level would put the R2 and R3 Pivot Points at $0.00001138 and $0.00001207, respectively, on the SHIB bulls' radar.
The MACD and signal line on the 4-hour chart mark a fresh positive start above the zero line, extending the uptrend and indicating a rise in bullish momentum. Similarly, the RSI at 72 crosses above the overbought boundary as buying pressure increases.
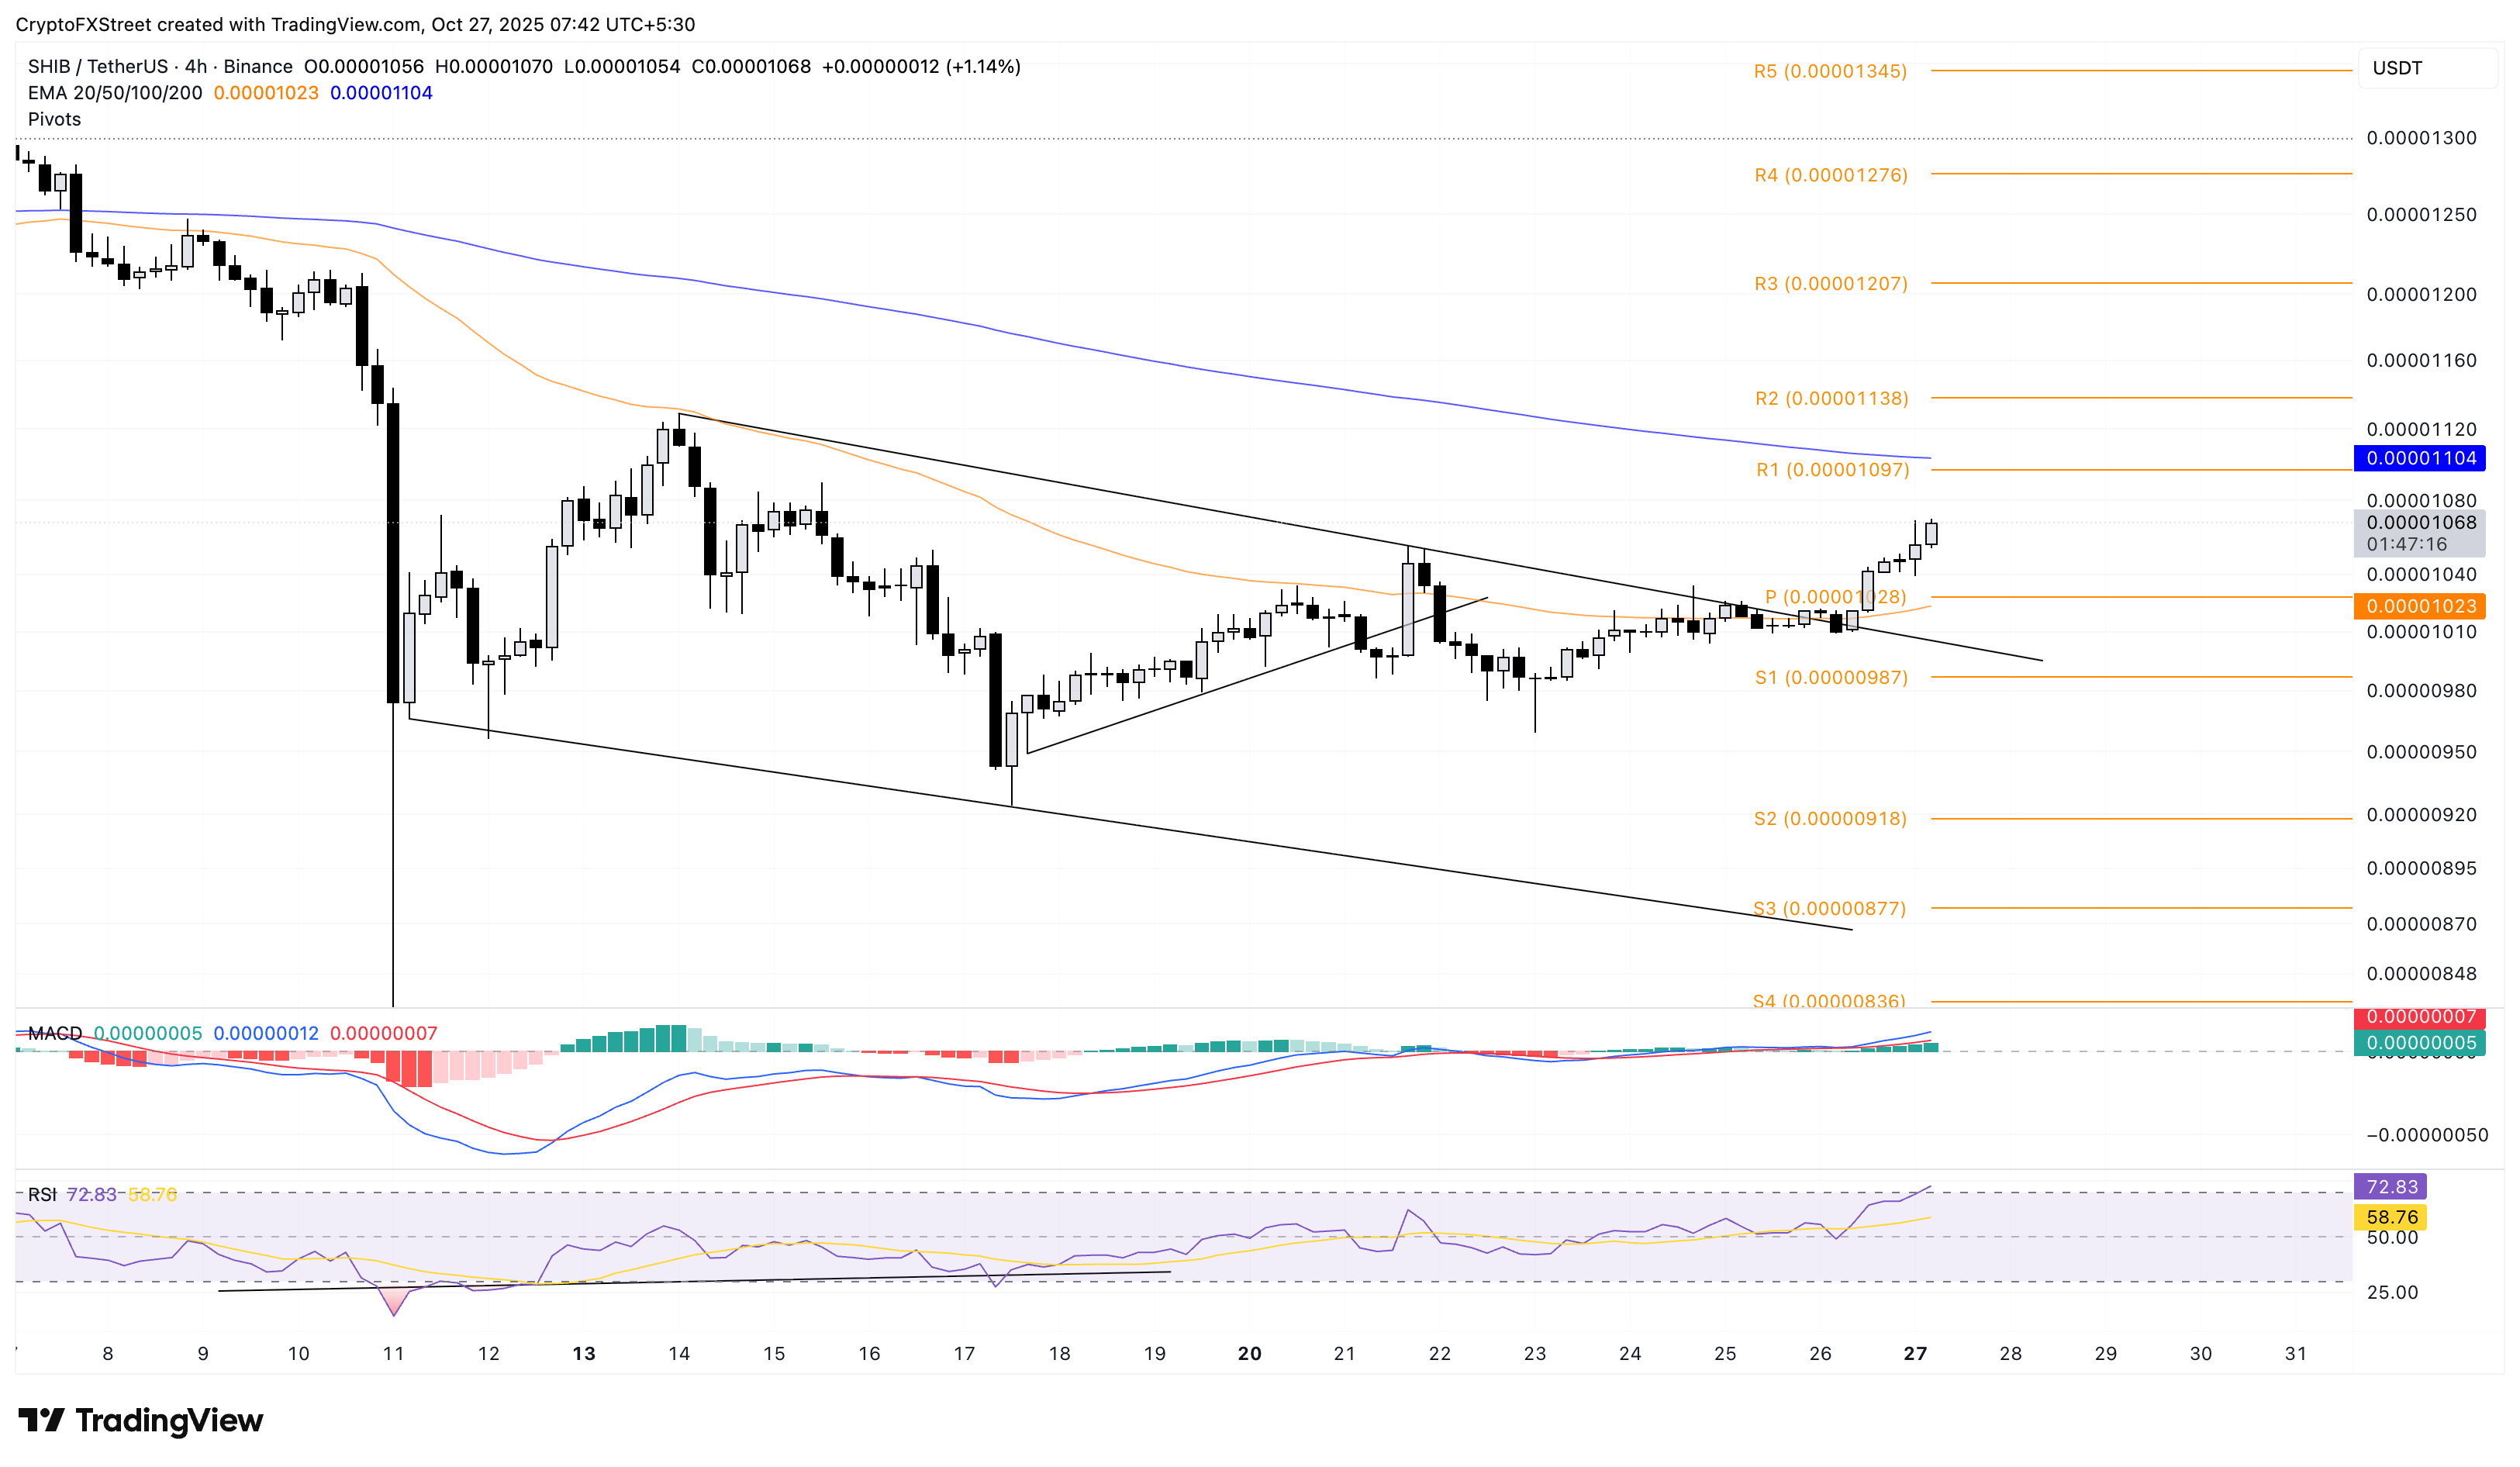
SHIB/USDT 4-hour price chart.
If SHIB fails to hold above $0.00001000, it could revisit the S1 Pivot Point at $0.00000987.
Pepe recovers with a steady rise in bullish momentum
Similar to Shiba Inu, Pepe extends a falling channel breakout rally on the 4-hour chart. PEPE trades above $0.00000700 at press time on Monday, advancing the uptrend for the fifth day.
The frog-themed meme coin aims for the R1 Pivot Point at $0.00000771, followed by the 200-period EMA at $0.00000815.
Technically, the rise in bullish momentum flashes upside potential in Pepe. The MACD and signal line are in an uptrend, and the RSI at 64 is approaching the overbought zone, both maintaining a bullish inclination.
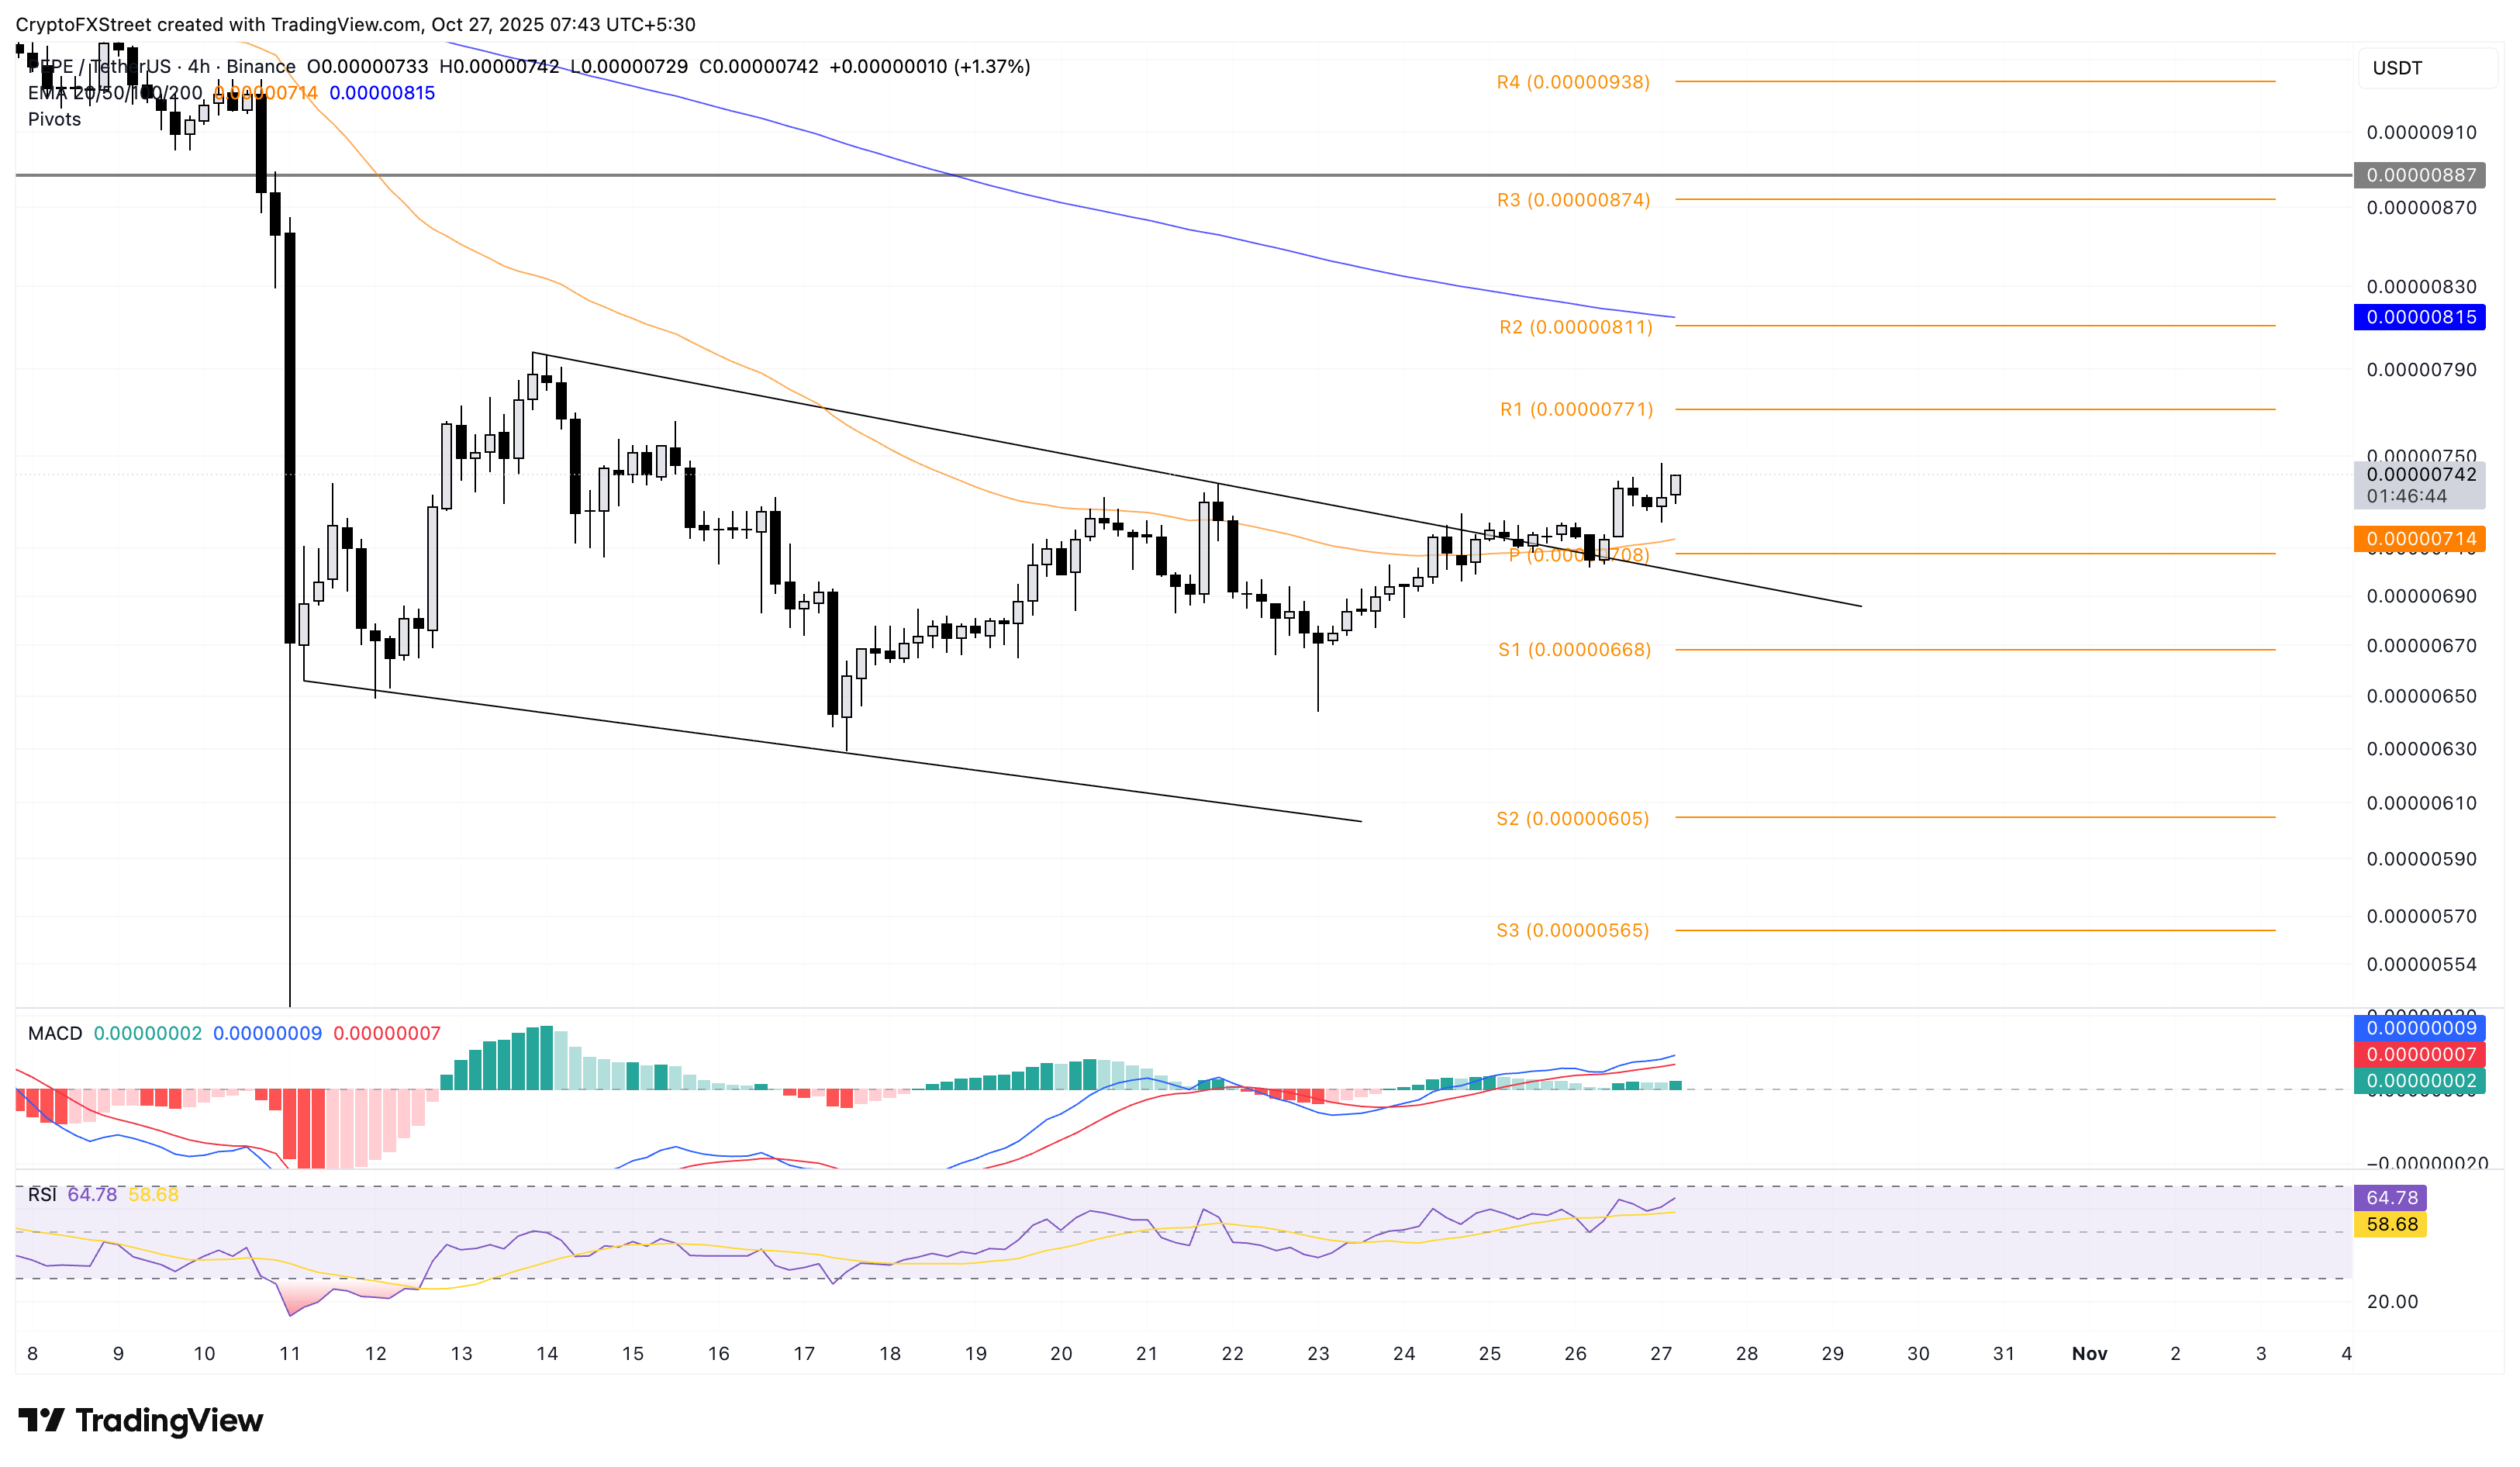
PEPE/USDT 4-hour price chart.
On the downside, the 50-period EMA at $0.00000714 remains a crucial support for PEPE, followed by the S1 Pivot Point at $0.00000668.

FXStreet
Hơn một triệu người dùng dựa vào FXStreet để có dữ liệu thị trường thời gian thực, công cụ biểu đồ, góc nhìn chuyên gia và tin tức Forex. Lịch kinh tế toàn diện và các hội thảo web giáo dục giúp nhà giao dịch luôn cập nhật và đưa ra quyết định có tính toán. FXStreet có khoảng 60 nhân sự, chia giữa trụ sở Barcelona và nhiều khu vực toàn cầu.
Read More


