
Trade The World
Meme Coins Price Prediction: Dogecoin, Shiba Inu, Pepe rally on Venezuela’s shadow BTC reserve
Bởi Vishal Dixit
Ngày xuất bản: 5 Jan 2026 | Ngày chỉnh sửa: 5 Jan 2026


POPULAR ARTICLES

Meme coins such as Dogecoin (DOGE), Shiba Inu (SHIB), and Pepe (PEPE) are leading the cryptocurrency market rally driven by the US cross-border operation to capture Venezuelan President Nicolás Maduro. Dogecoin extends its gain for the fifth consecutive day while SHIB and PEPE take a pause.
- Dogecoin is up 2% after Sunday’s 4% recovery, extending its fifth straight day of gains.
- Shiba Inu takes a breather following a nearly 12% rise on Sunday, breaking out of a falling channel pattern.
- Pepe nears the 200-day EMA with bulls aiming for a breakout after a 77% rally over the last four days.
Meme coins such as Dogecoin (DOGE), Shiba Inu (SHIB), and Pepe (PEPE) are leading the cryptocurrency market rally driven by the US cross-border operation to capture Venezuelan President Nicolás Maduro. Dogecoin extends its gain for the fifth consecutive day while SHIB and PEPE take a pause. Still, the technical outlook for the major meme coins remains bullish.
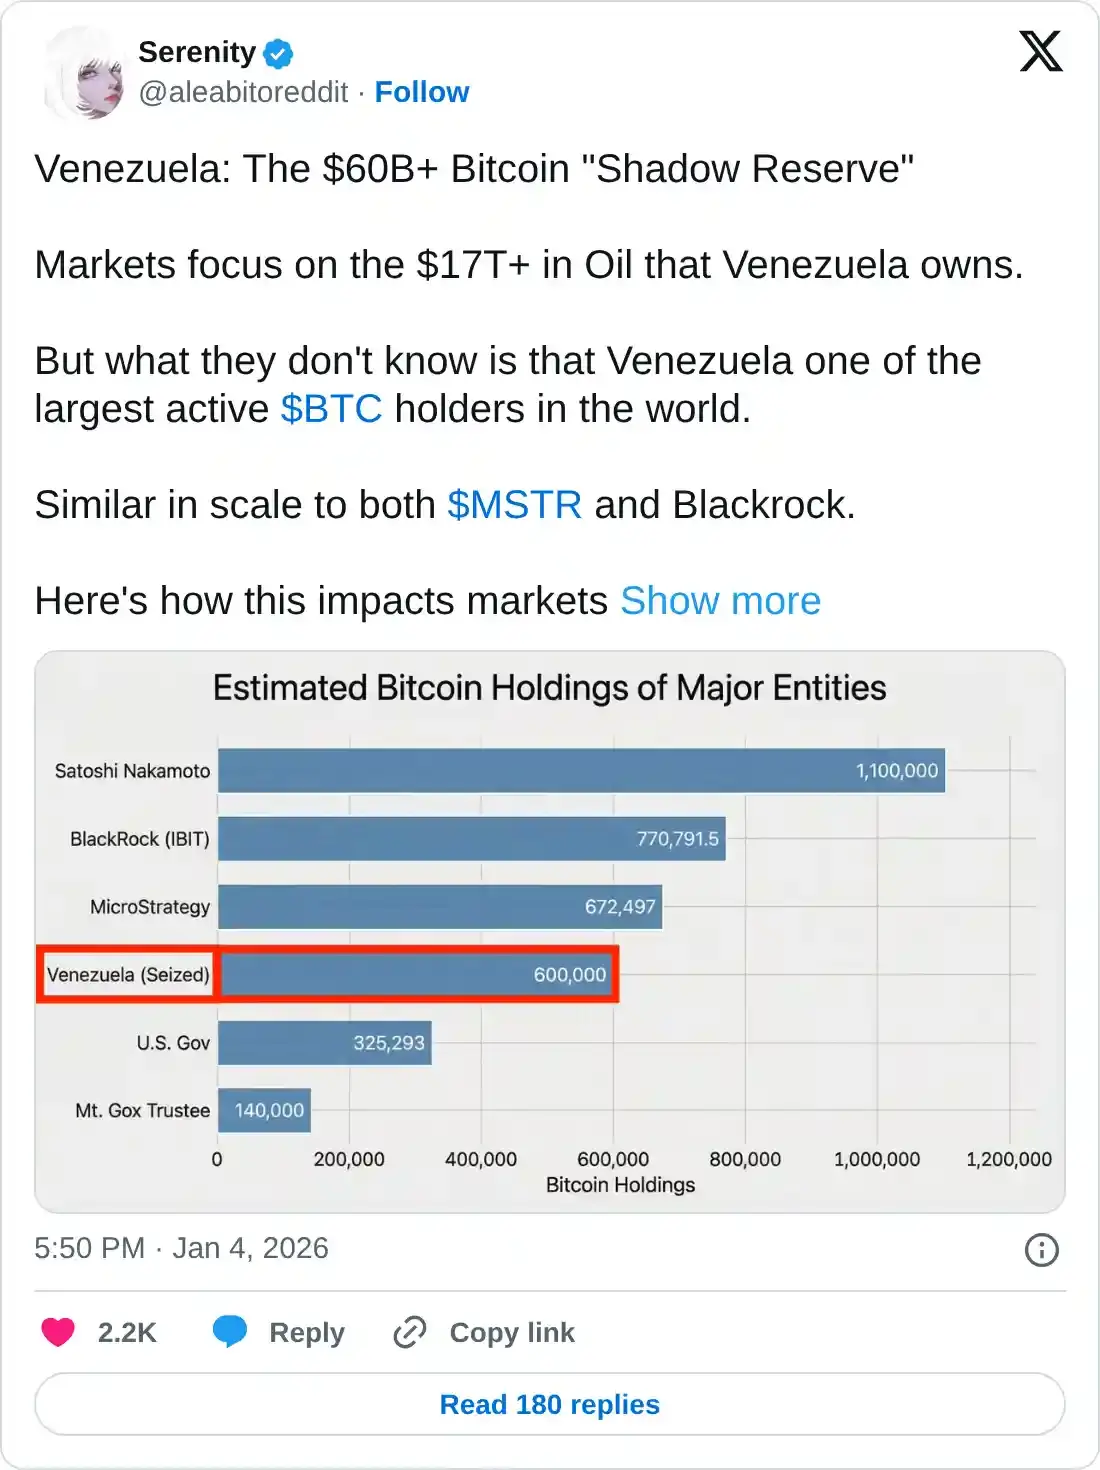
Venezuela’s shadow Bitcoin reserve boosts the crypto market rally
Venezuela’s shift to crypto, such as Tether’s US Dollar stablecoin USDT, from the petrodollar to settle crude oil sales is estimated to have roughly $10 billion to $15 billion. Maduro is believed to have converted USDT for BTC to avoid a wallet freeze.
Combined with the $2 billion Gold swap for Bitcoin between 2018 and 2020 and BTC mining seizure, Venezuela’s shadow reserve is likely to hold roughly 600,000 BTC.
If the US Strategic Bitcoin Reserve absorbs Venezuela’s BTC holdings or freezes them, it would effectively reduce supply, leading to a surge in demand. The ongoing market recovery reflects the market anticipation of a potential supply reduction.
Dogecoin above $0.15 gains bullish momentum
Dogecoin is up 2% at press time on Monday, building on the 4% gains from Sunday. The dog-themed meme coin extends its recovery over the 50-day Exponential Moving Average (EMA) at $0.14339 and trades above the $0.15000 round figure.
Dogecoin’s recovery reflects the breakout rally of a descending wedge pattern on the daily logarithmic chart. The breakout rally aims for the 200-day EMA at $0.18202, aligning with the overhead supply zone between $0.18100 and $0.18500.
The momentum indicators on the daily chart indicate a buy-side dominance. The Relative Strength Index (RSI) is at 65, with further room before reaching the overbought zone. At the same time, the Moving Average Convergence Divergence (MACD) continues to rise alongside green histogram bars, signaling a surge in bullish momentum.
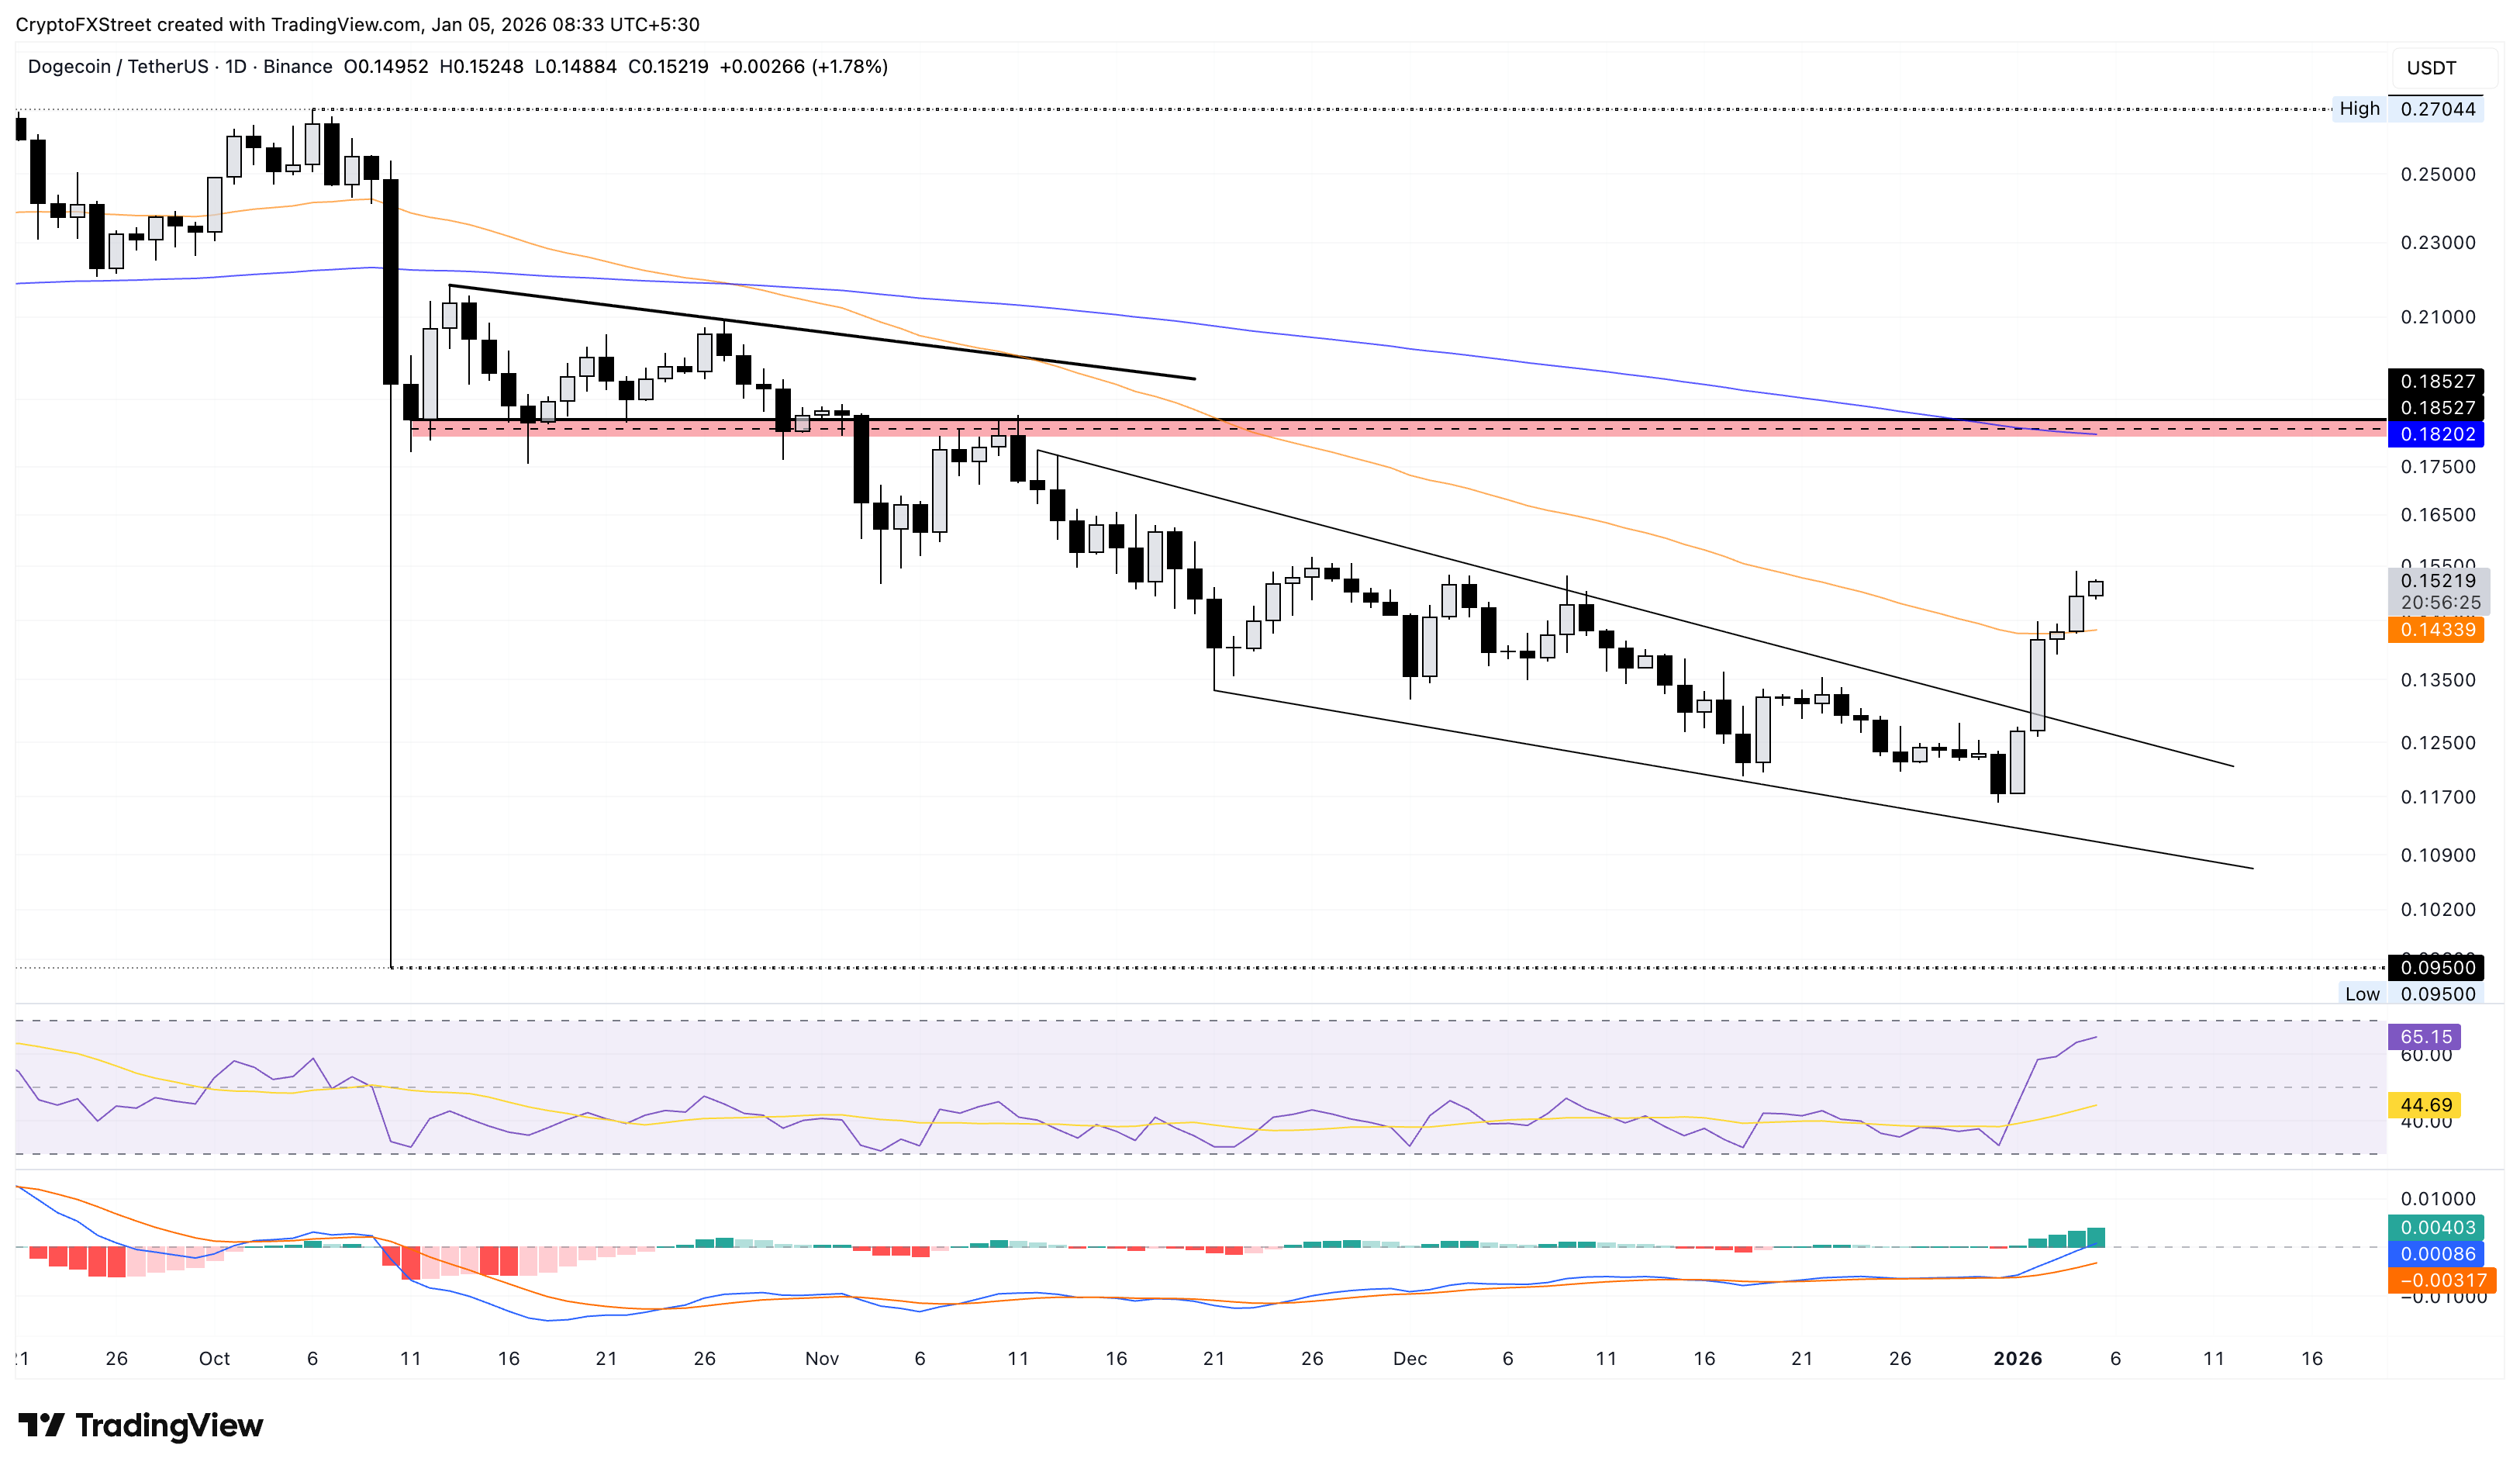
If DOGE slips below $0.14399, it could offset the breakout rally, potentially risking the $0.13000 round figure.
Shiba Inu’s four-day rally takes a breather above the 50-day EMA
Shiba Inu jumped nearly 12% on Sunday, breaking above the resistance trendline connecting October 13 and November 11 highs. At the time of writing, SHIB is down over 1% on Monday.
If SHIB extends recovery, it could aim for the 200-day EMA at $0.00001065.
Similar to Dogecoin, the momentum indicators on the daily timeframe signal a surge in bullish momentum for Shiba Inu. The RSI at 65 hovers close to the overbought zone, and the MACD crosses above the zero line, accompanied by successively rising green histogram bars.
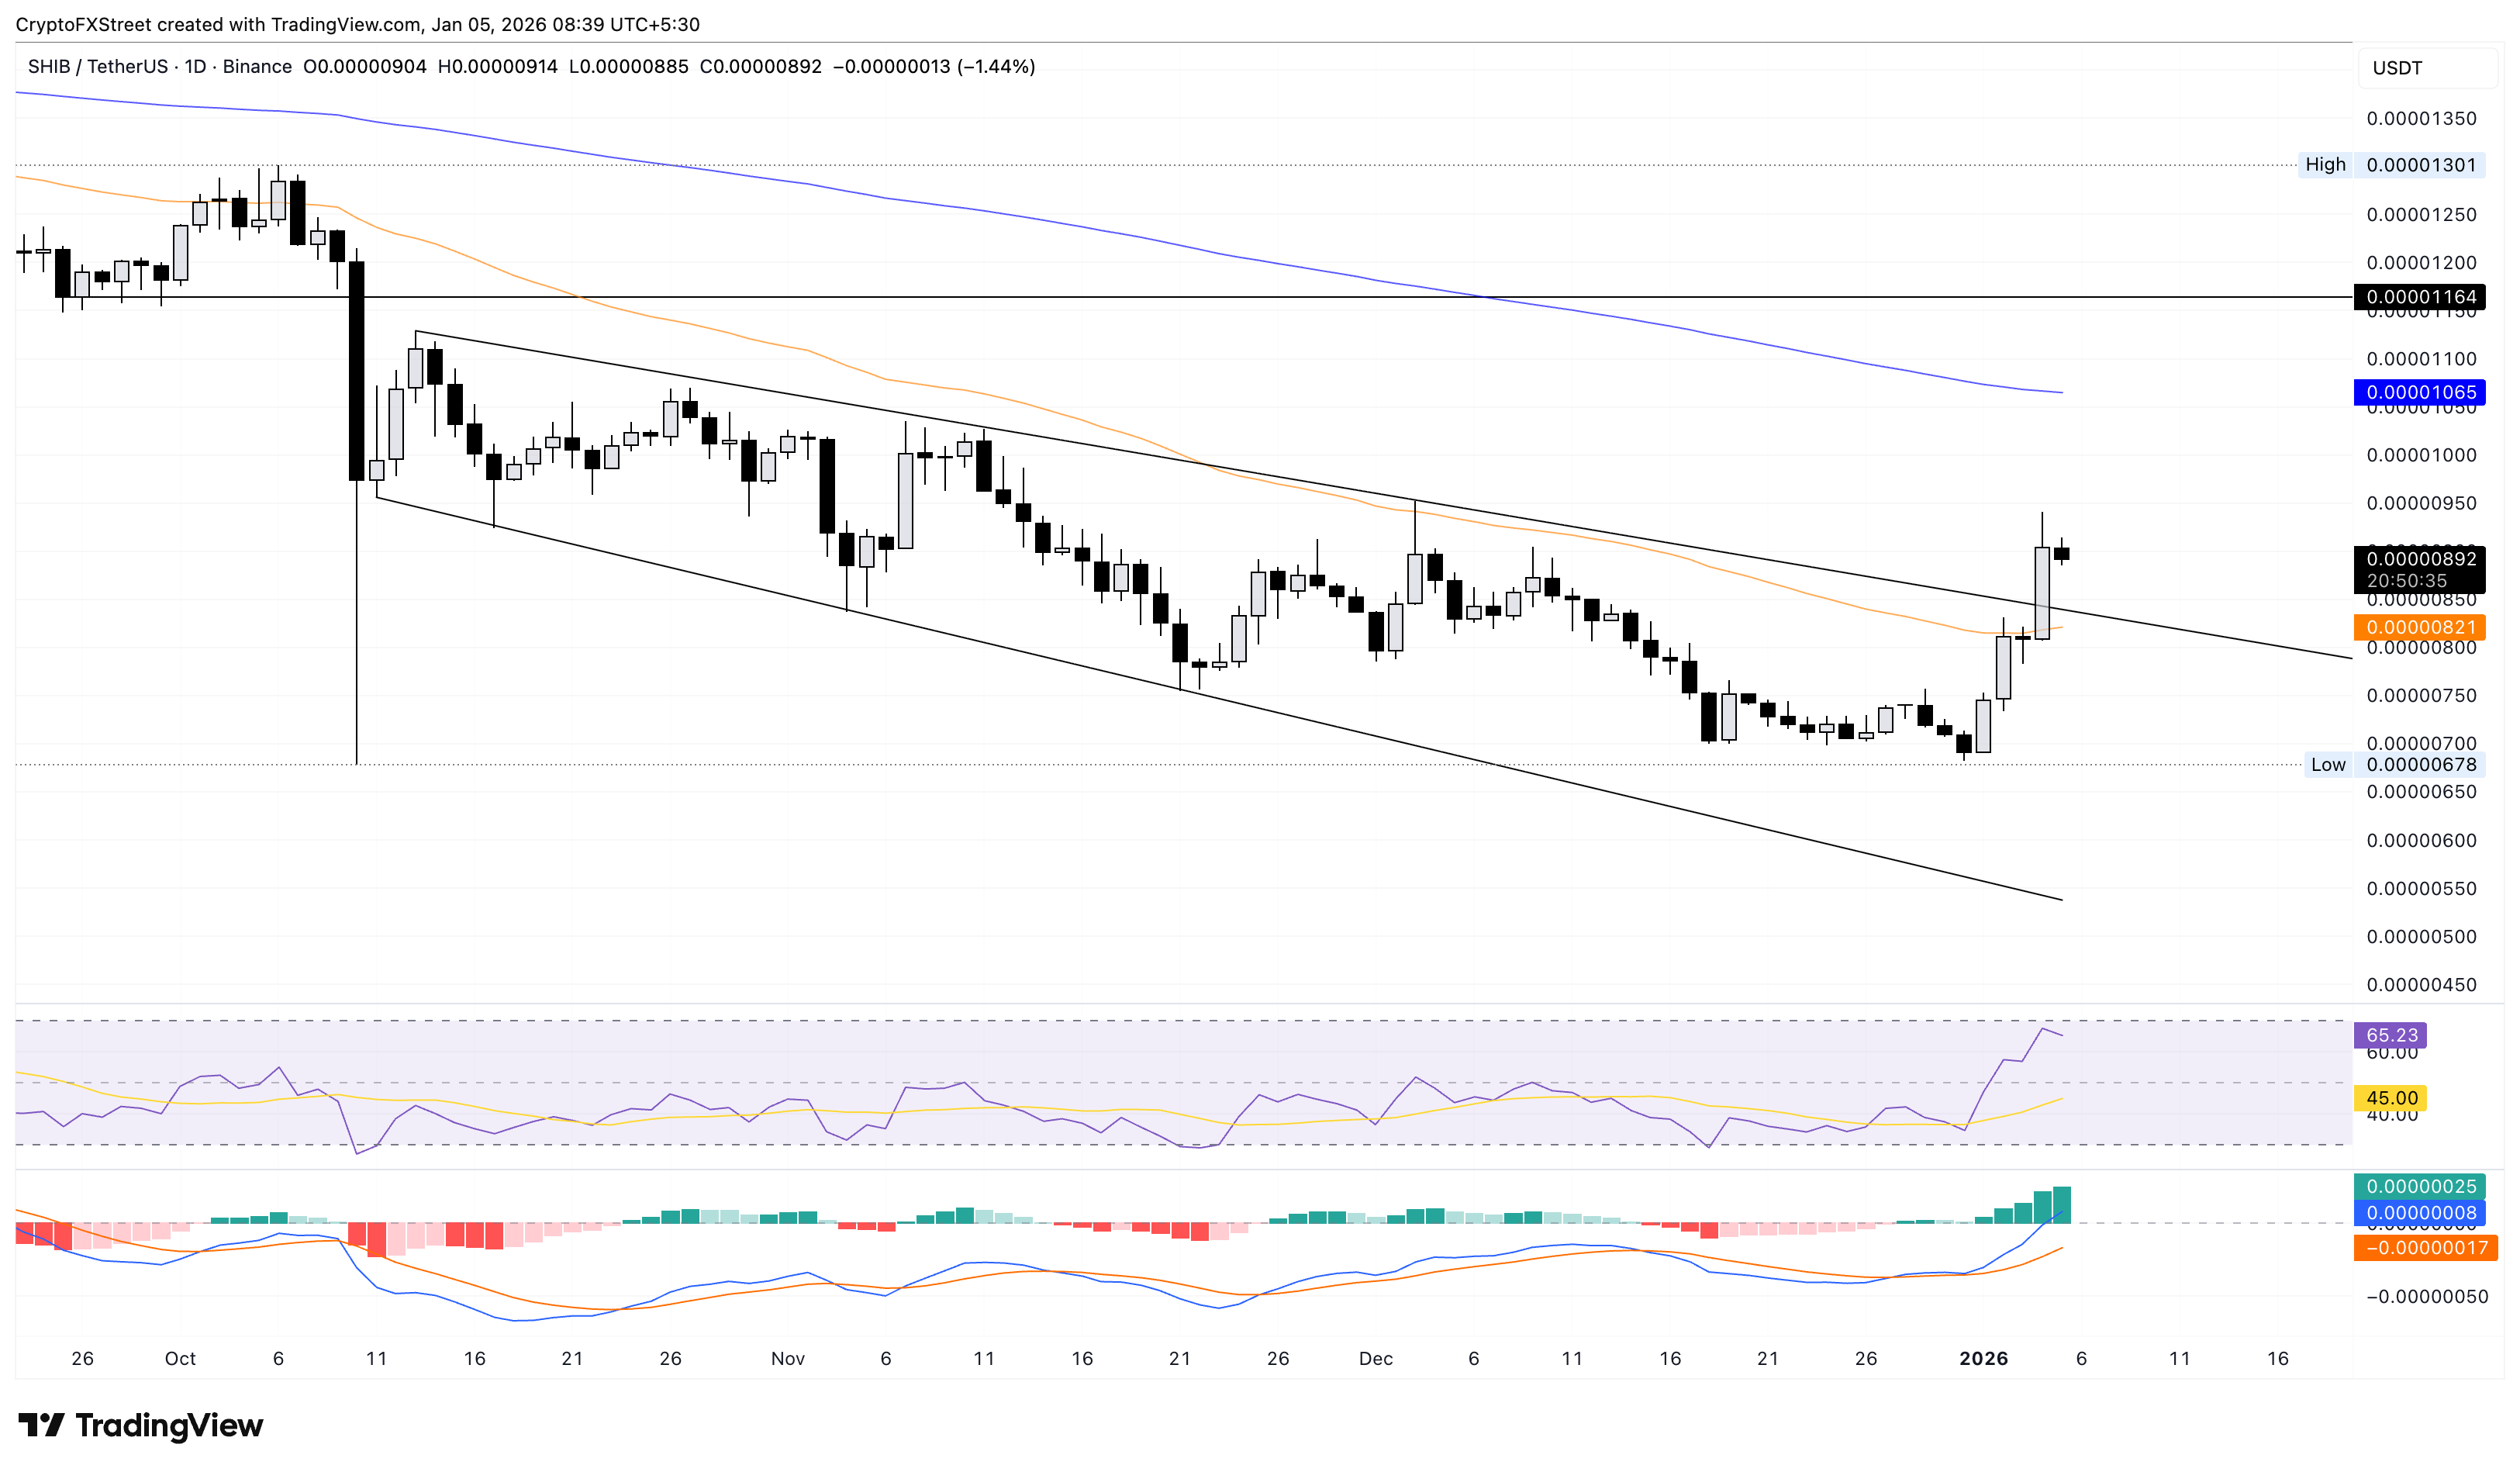
Looking down, if SHIB fails to hold above the 50-day EMA at $0.00000821, it would nullify the breakout rally, risking a decline to the October 10 low at $0.00000678.
Pepe targets the 200-day EMA breakout
Pepe edges lower by nearly 2% at press time on Monday after rising almost 18% on Sunday. The sudden halt in the four-day rally of over 77% in the frog-themed meme coin reflects overhead pressure near the 200-day EMA at $0.00000749.
If PEPE exceeds this moving average, it could extend the rally to the September 25 low at $0.00000886.
The RSI at 79 is deep into overbought territory, which could signal unsustainable buying pressure. However, the surge in MACD signals a bullish momentum boost.
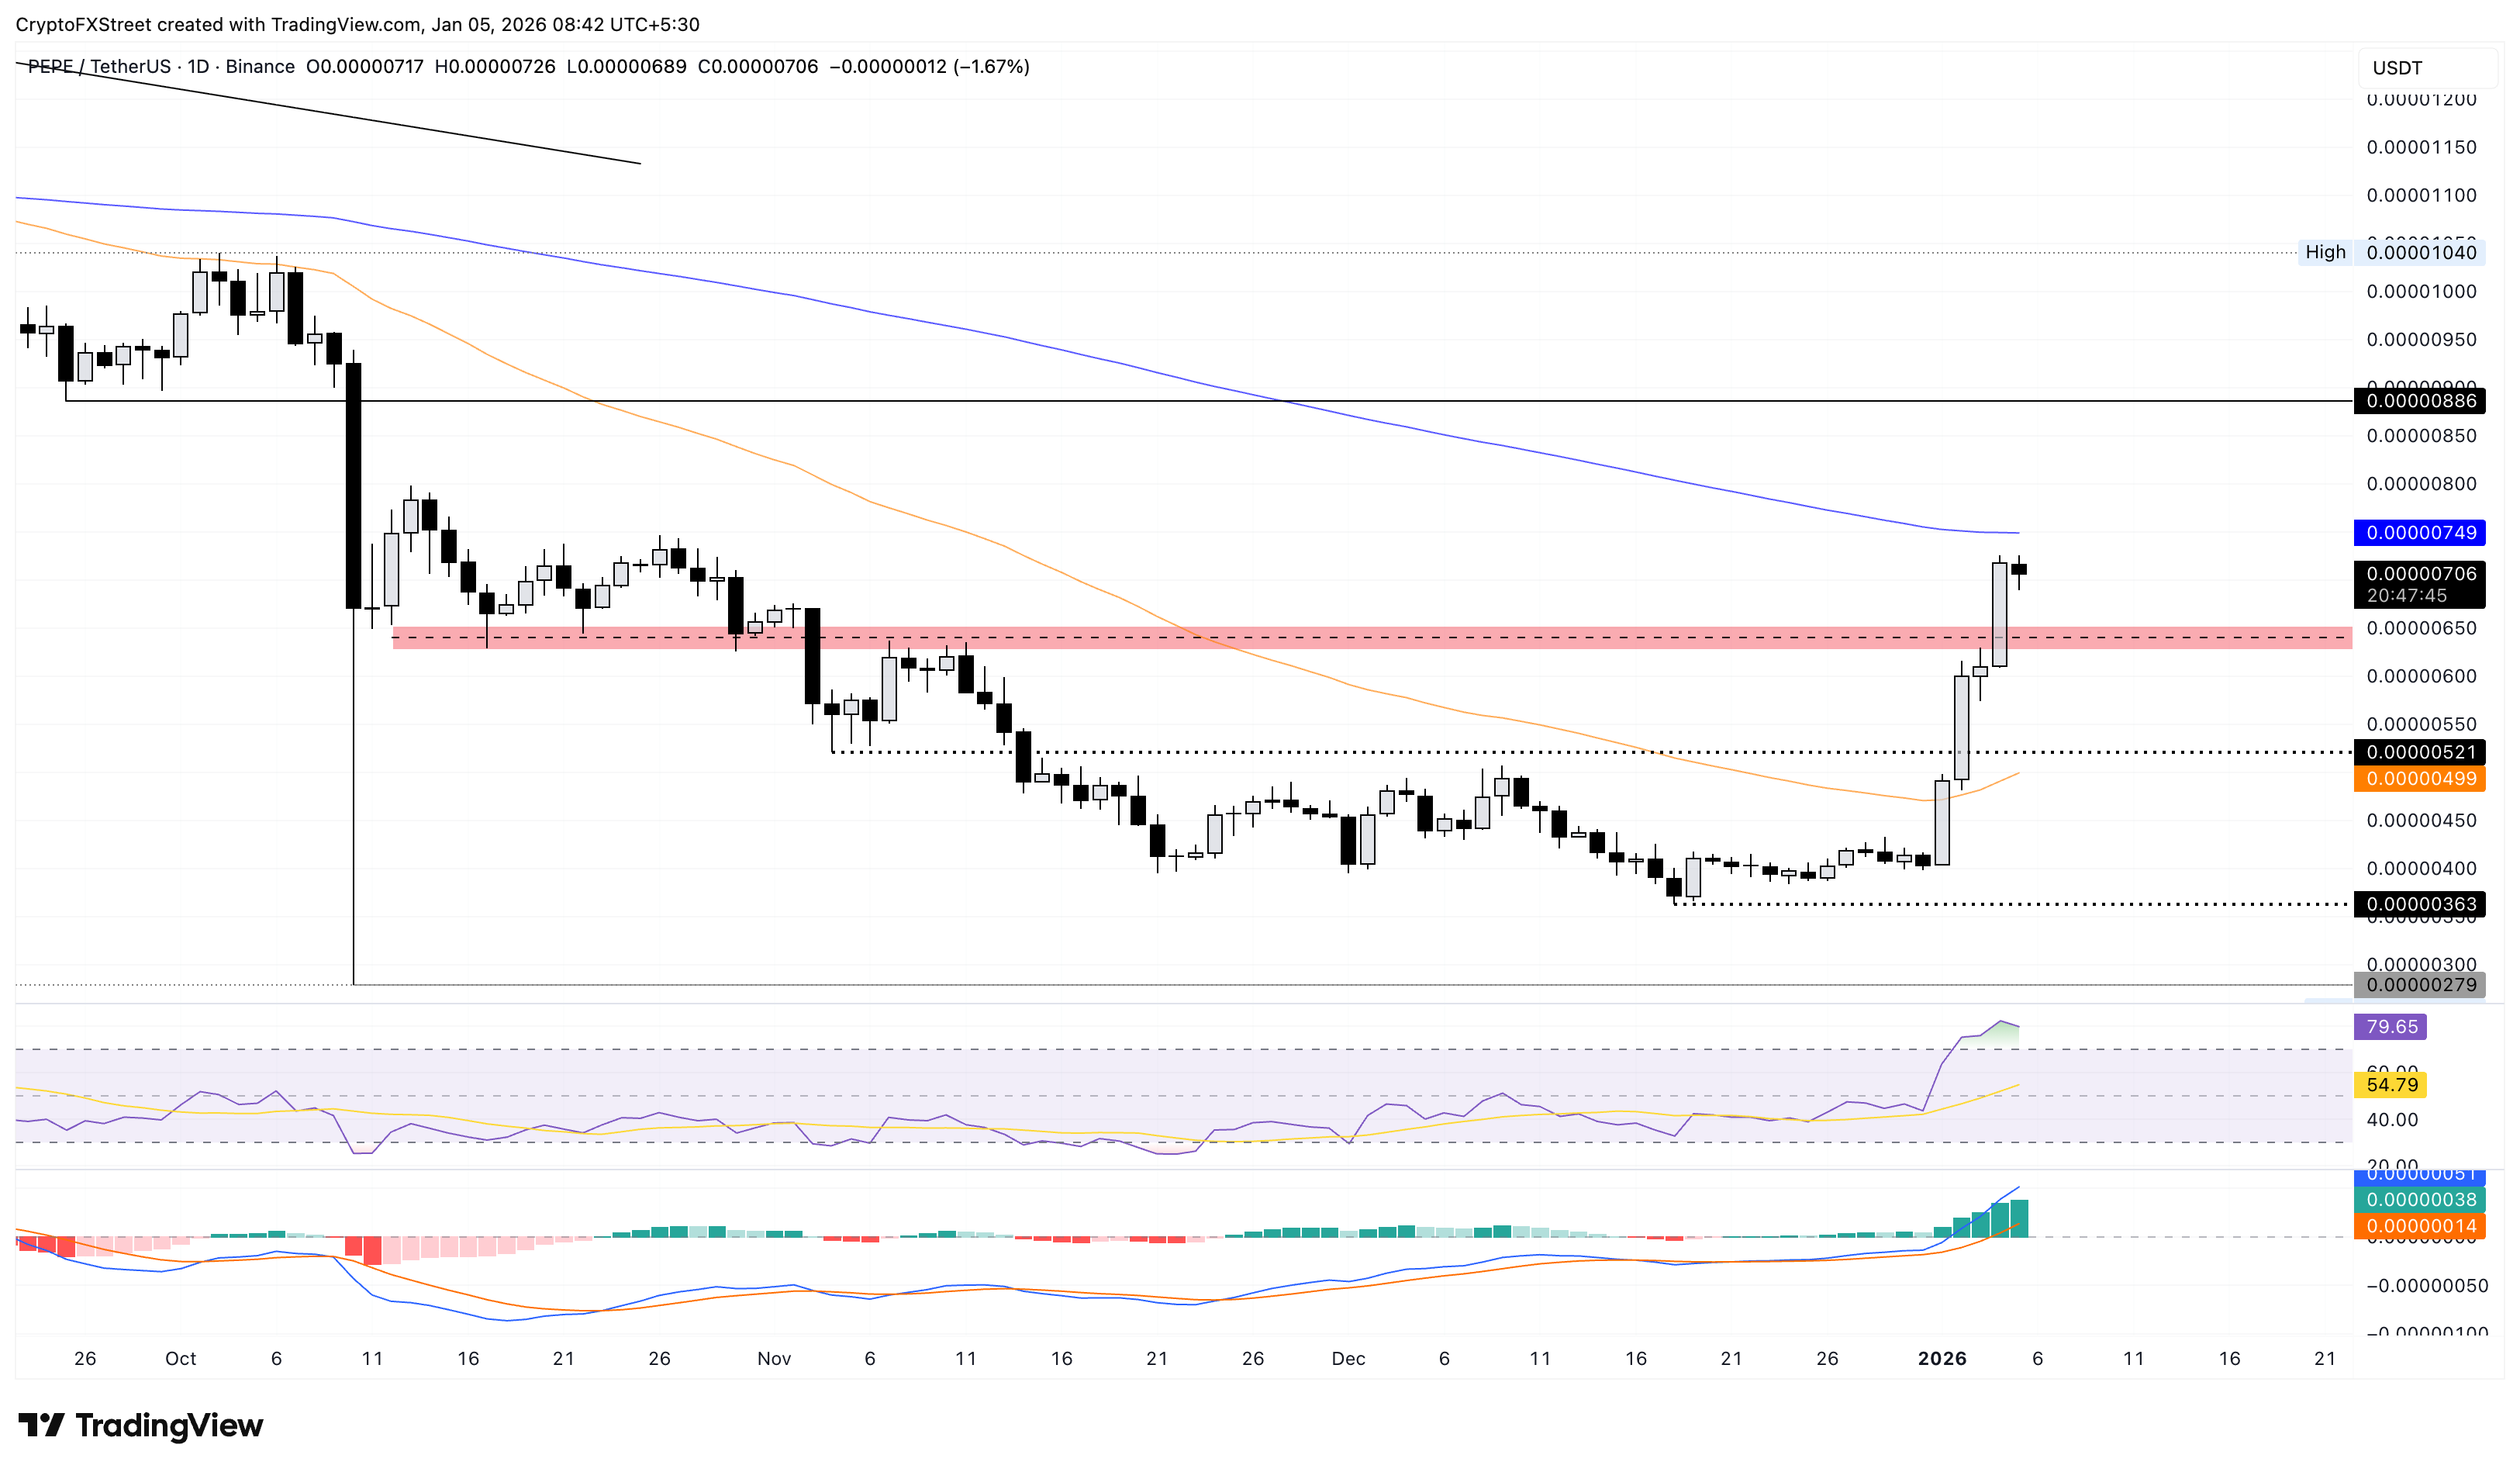
Looking down, a potential reversal in PEPE could test the resistance-turned-support zone at $0.00000650.

FXStreet
Hơn một triệu người dùng dựa vào FXStreet để có dữ liệu thị trường thời gian thực, công cụ biểu đồ, góc nhìn chuyên gia và tin tức Forex. Lịch kinh tế toàn diện và các hội thảo web giáo dục giúp nhà giao dịch luôn cập nhật và đưa ra quyết định có tính toán. FXStreet có khoảng 60 nhân sự, chia giữa trụ sở Barcelona và nhiều khu vực toàn cầu.
Read More


