
Trade The World
Near Protocol partners with Aptos for cross-chain swaps as NEAR eyes 20% breakout
Bởi John Isige
Ngày xuất bản: 4 Sep 2025 | Ngày chỉnh sửa: 4 Sep 2025


POPULAR ARTICLES

Near Protocol (NEAR), the second-largest Artificial Intelligence (AI) token, is trading above $2.40 on Thursday. The AI token faces growing headwinds amid risk-off sentiment in the broader cryptocurrency market.
- Near Protocol consolidates above $2.40 short-term support with bulls preparing for a falling wedge pattern breakout.
- Near Protocol and Aptos launch cross-chain swap, eliminating the need for bridges.
- The NEAR futures Open Interest rebounds to $265 million, as risk-on sentiment builds.
Near Protocol (NEAR), the second-largest Artificial Intelligence (AI) token, is trading above $2.40 on Thursday. The AI token faces growing headwinds amid risk-off sentiment in the broader cryptocurrency market. Still, network developments and stability in the derivatives market could increase the chances of a bullish breakout aiming for the $3.00 level.
Near Protocol and Aptos collaborate on cross-chain swaps
Near Protocol and Aptos (APT) have entered into a partnership agreement, which will see the two crypto networks collaborate on cross-chain swaps. The feature will be executed via Near Intents, an open-source cross-chain and chain-abstraction protocol powered by Near’s blockchain technology.
Near Protocol and Aptos aim to provide access to one-click cross-chain swaps between the two networks and other supported protocols, eliminating the need for traditional bridges.
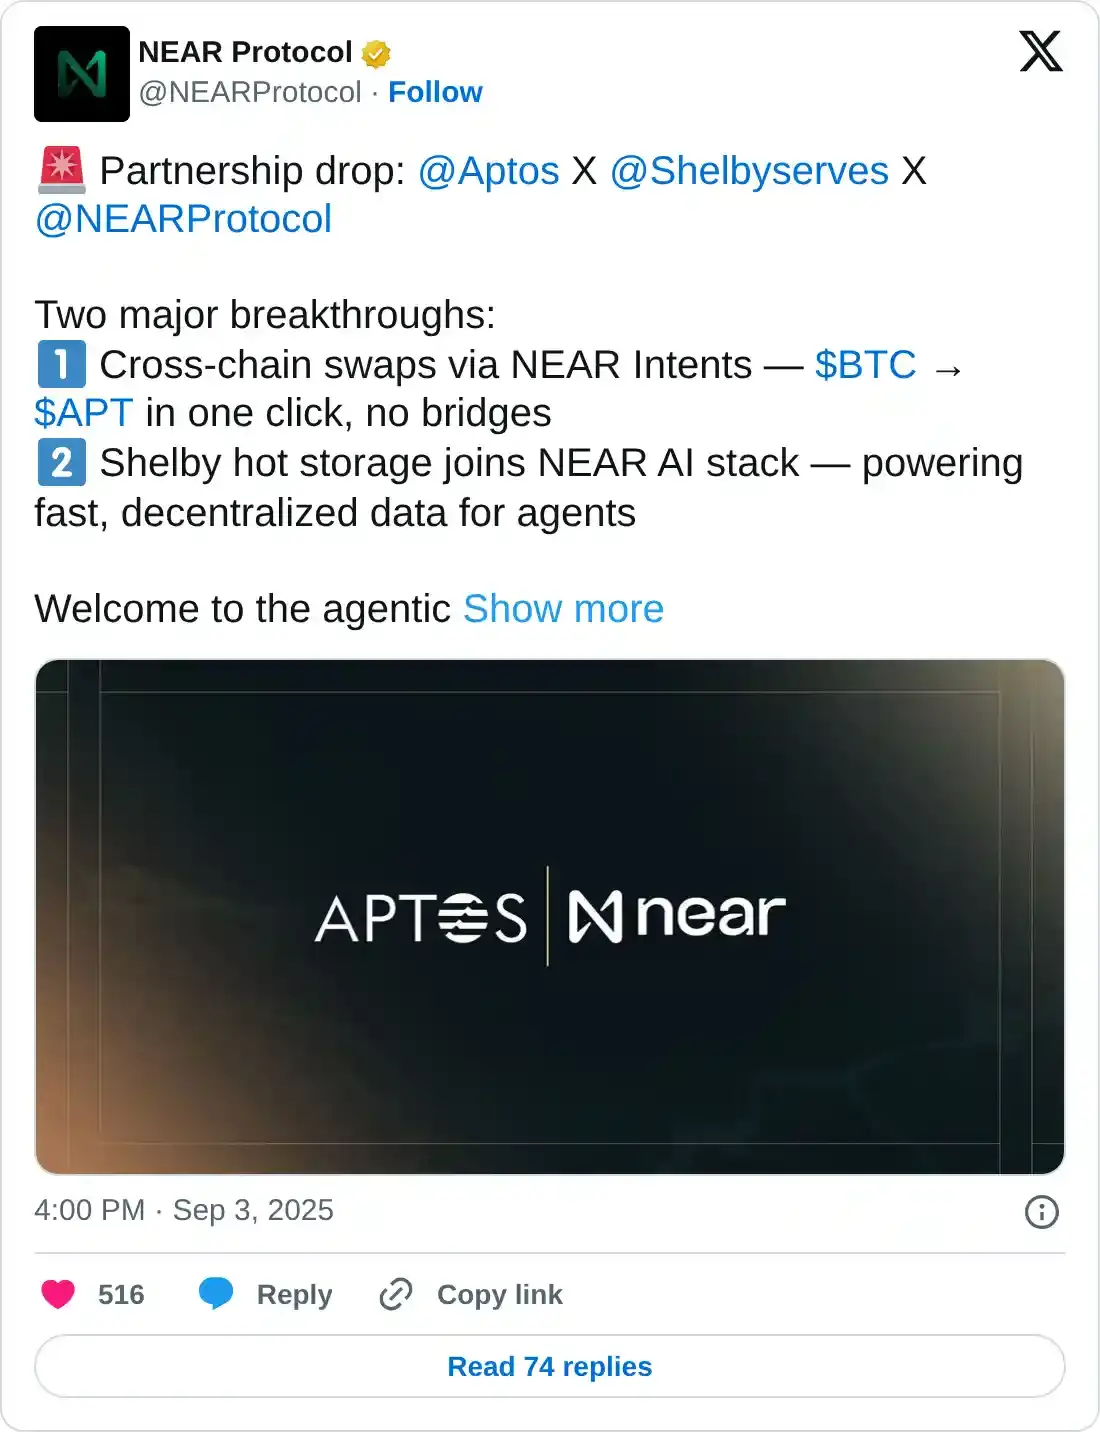
The development taps Near Protocol’s Chain Signatures and Multi-Party Computation (MPC) nodes, ensuring node security and intent-based interactions. Aptos is now the 20th protocol to join Near Intents, providing users with access to leading networks like Bitcoin (BTC) and Ethereum (ETH), as well as low-cost protocols such as Solana (SOL).
Technical outlook: NEAR eyes wedge pattern breakout
NEAR price is inching closer to a falling wedge pattern breakout on the 4-hour chart. This is a bullish pattern formed by two converging trendlines. As trading volume decreases, bears gradually lose their grip on the trend, paving the way for a bullish breakout at the end of the consolidation period.
Traders will anticipate a breakout above the upper trendline accompanied by a spike in volume. A 20% move toward the $3.00 level would change NEAR’s technical outlook. The target is determined by measuring the distance between the pattern’s widest points, extrapolating above the breakout point.
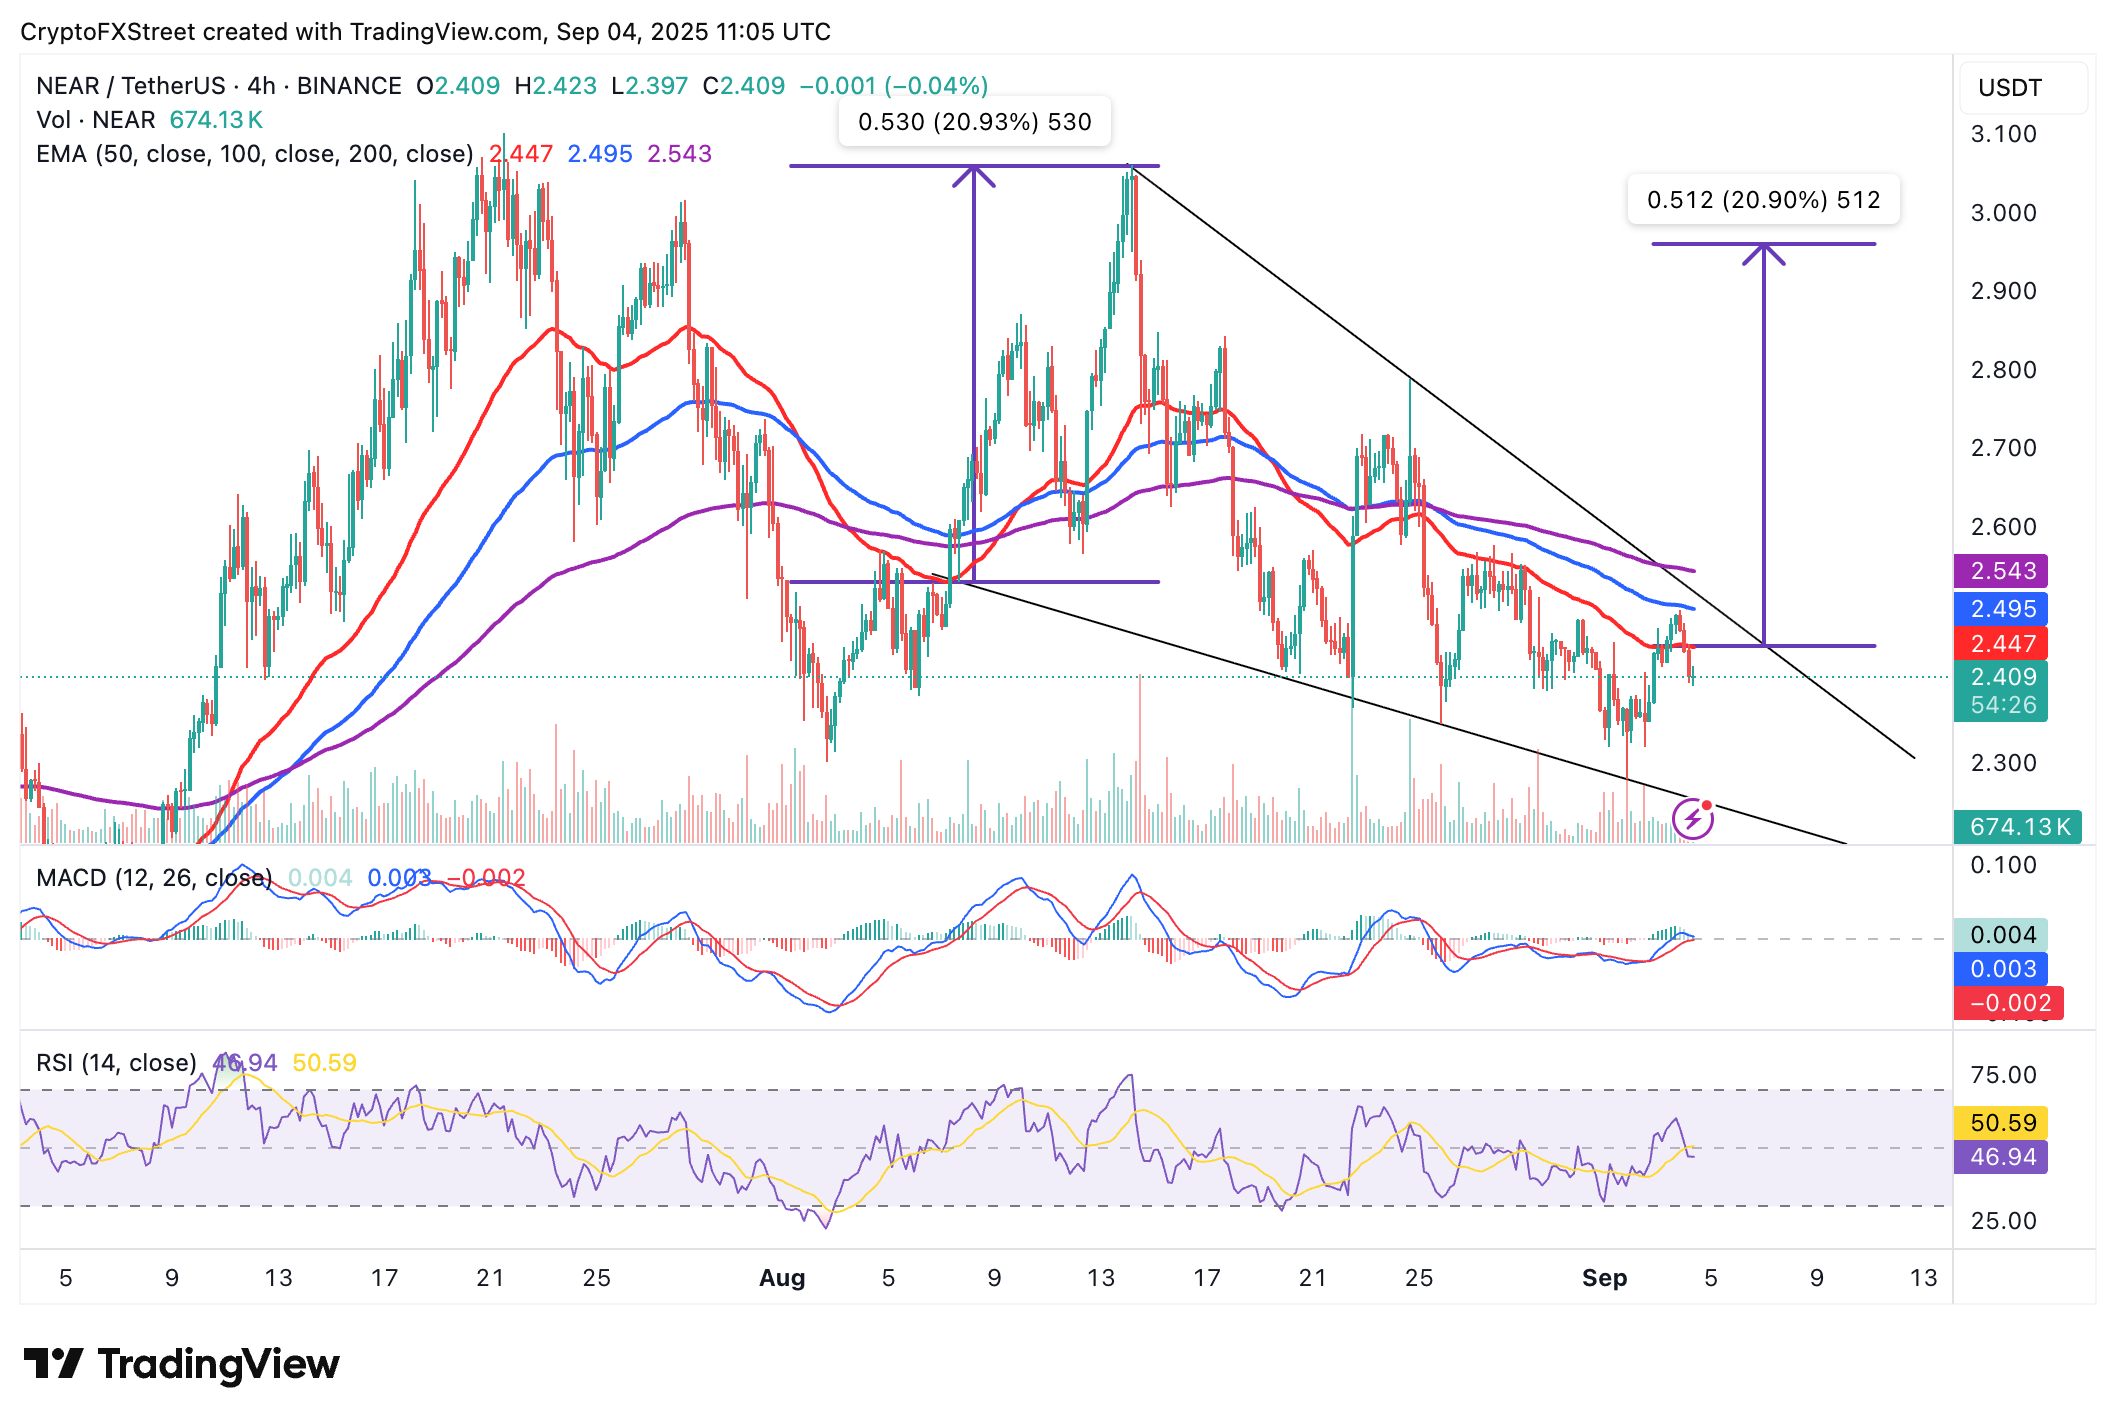
NEAR/USDT 4-hour chart
Meanwhile, sideways trading could take precedence in the short-term as the Relative Strength Index (RSI) stabilizes at 47. If the RSI rises above the midline, the path with the least resistance could shift upward, increasing the chances of the falling wedge pattern breakout.
CoinGlass data shows that NEAR’s futures Open Interest (OI) has rebounded to $265 million following a drop to $248 million on Monday. OI represents the notional value of outstanding futures contracts.
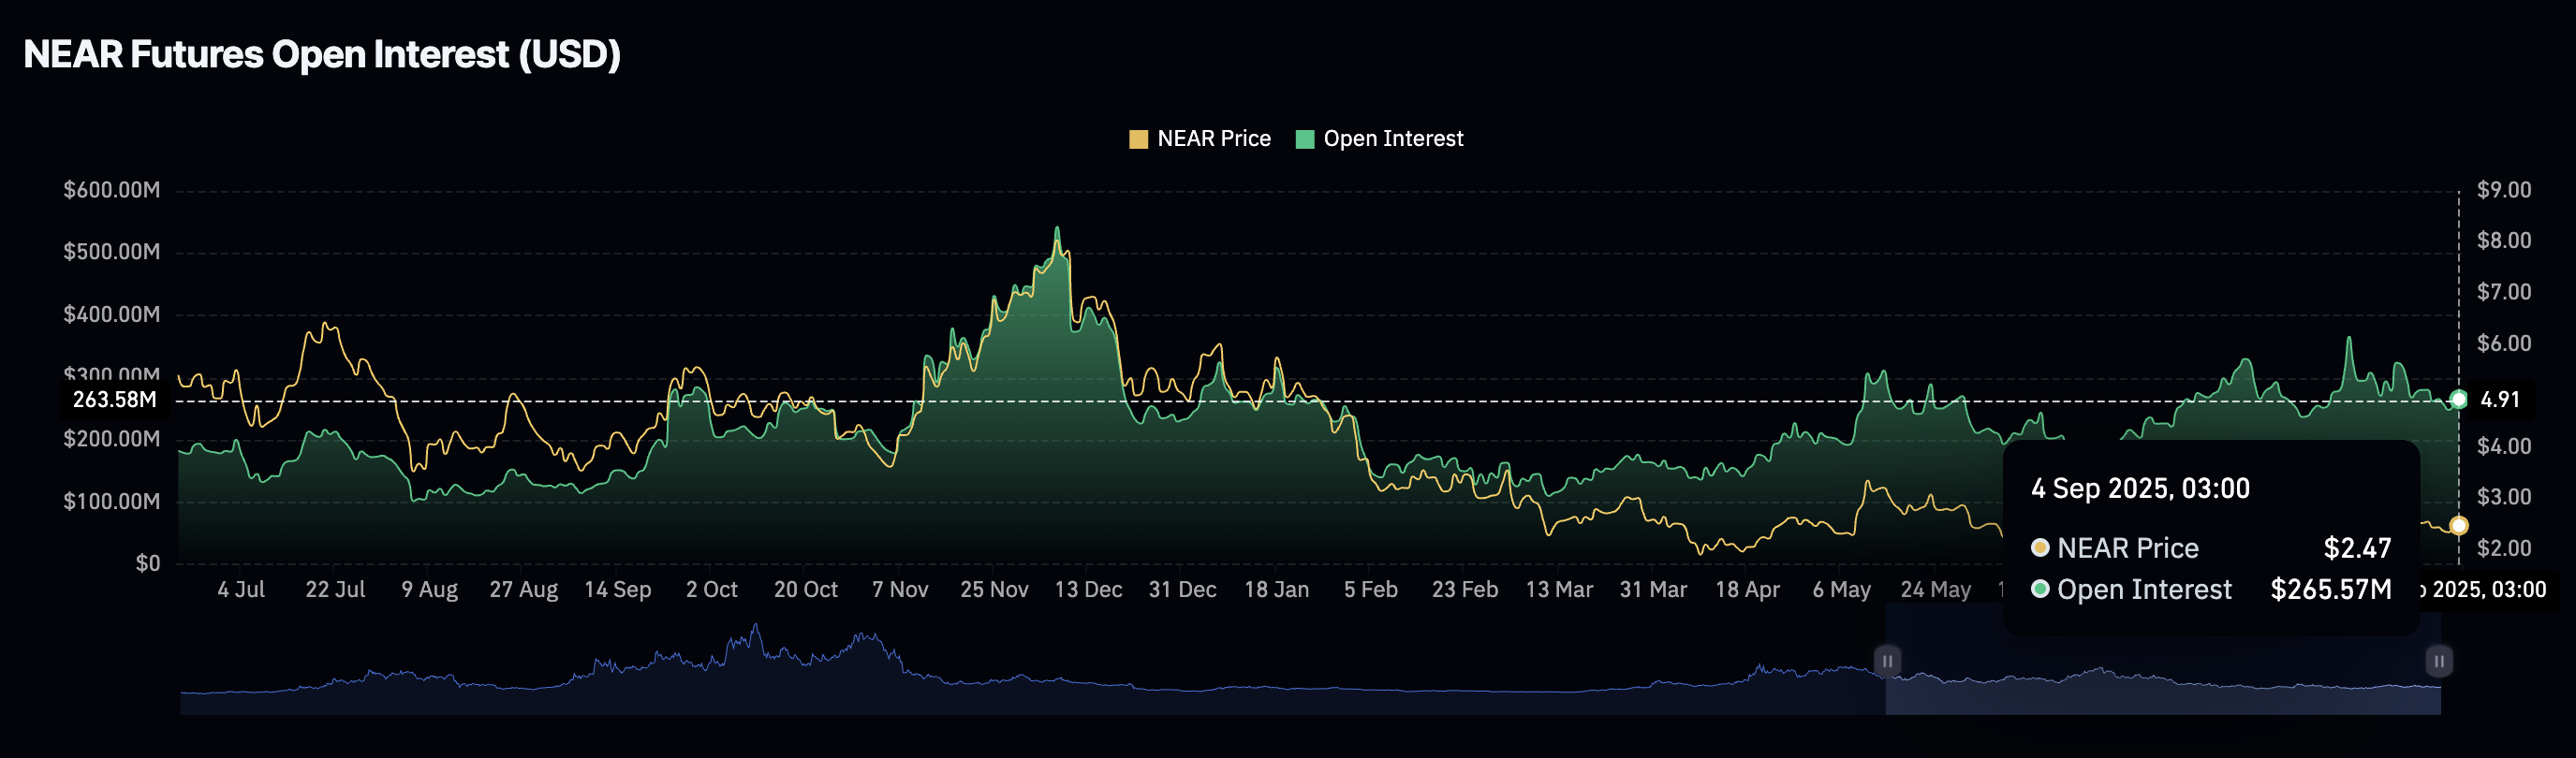
NEAR Futures Open Interest | Source: CoinGlass
If retail demand sustains the uptrend in OI, traders will increasingly bet on the NEAR price rising in the short term, indicating a growing risk-on sentiment.
Open Interest, funding rate FAQs
Higher Open Interest is associated with higher liquidity and new capital inflow to the market. This is considered the equivalent of increase in efficiency and the ongoing trend continues. When Open Interest decreases, it is considered a sign of liquidation in the market, investors are leaving and the overall demand for an asset is on a decline, fueling a bearish sentiment among investors.
Funding fees bridge the difference between spot prices and prices of futures contracts of an asset by increasing liquidation risks faced by traders. A consistently high and positive funding rate implies there is a bullish sentiment among market participants and there is an expectation of a price hike. A consistently negative funding rate for an asset implies a bearish sentiment, indicating that traders expect the cryptocurrency’s price to fall and a bearish trend reversal is likely to occur.

FXStreet
Hơn một triệu người dùng dựa vào FXStreet để có dữ liệu thị trường thời gian thực, công cụ biểu đồ, góc nhìn chuyên gia và tin tức Forex. Lịch kinh tế toàn diện và các hội thảo web giáo dục giúp nhà giao dịch luôn cập nhật và đưa ra quyết định có tính toán. FXStreet có khoảng 60 nhân sự, chia giữa trụ sở Barcelona và nhiều khu vực toàn cầu.
Read More


