
Trade The World
NZD/USD Price Forecast: Rises to near 0.5850 after breaking above nine-day EMA
Bởi Akhtar Faruqui
Ngày xuất bản: 2 Oct 2025 | Ngày chỉnh sửa: 2 Oct 2025


POPULAR ARTICLES

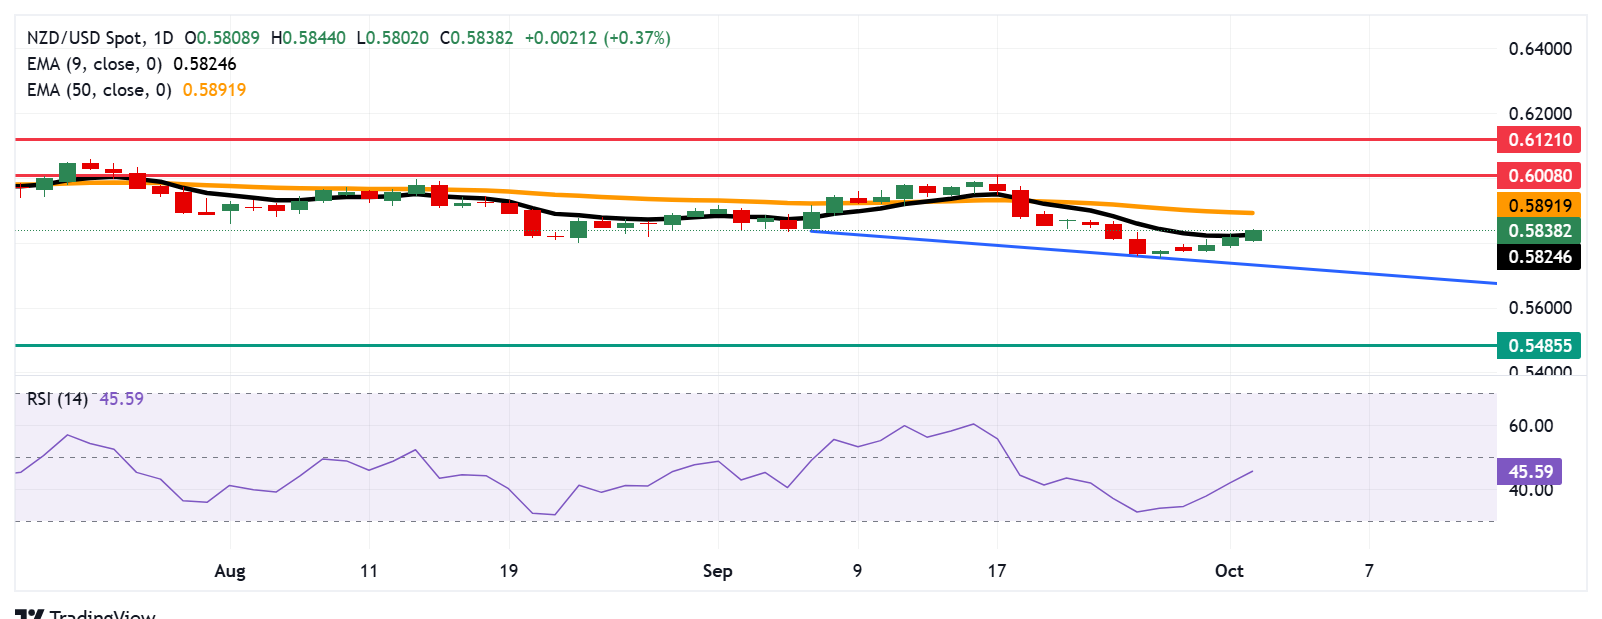
NZD/USD extends its gains for the third successive session, trading around 0.5840 during the European hours on Thursday. The daily chart’s technical analysis shows that short-term price momentum has strengthened as the pair trades above the nine-day Exponential Moving Average (EMA).
- NZD/USD may approach the initial barrier at the 50-day EMA of 0.5891.
- The market sentiment remains bearish as the 14-day RSI is positioned below the 50 mark.
- The initial support lies at the nine-day EMA of 0.5824.
NZD/USD extends its gains for the third successive session, trading around 0.5840 during the European hours on Thursday. The daily chart’s technical analysis shows that short-term price momentum has strengthened as the pair trades above the nine-day Exponential Moving Average (EMA).
However, the 14-day Relative Strength Index (RSI) is still positioned below the 50 mark, suggesting a bearish bias is active. Further advances toward the 50 mark may improve the market bias.
On the upside, the NZD/USD pair may target the 50-day EMA at 0.5891. A break above this level would improve the medium-term price momentum and support the pair to test the three-month high of 0.6008, reached on September 17, followed by 0.6121, the highest since October 2024.
The NZD/USD pair could find its initial support at the nine-day EMA of 0.5824. A break below this level would weaken the short-term price momentum and prompt the pair to test the downward trendline around 0.5730. Further declines below the trendline would open the doors for the pair to navigate the area around 0.5485, the lowest level since March 2020, which was recorded on April 9, 2025.
NZD/USD: Daily Chart
New Zealand Dollar Price Today
The table below shows the percentage change of New Zealand Dollar (NZD) against listed major currencies today. New Zealand Dollar was the strongest against the Japanese Yen.
| USD | EUR | GBP | JPY | CAD | AUD | NZD | CHF | |
|---|---|---|---|---|---|---|---|---|
| USD | -0.22% | -0.14% | -0.09% | 0.00% | -0.10% | -0.51% | -0.15% | |
| EUR | 0.22% | 0.07% | 0.12% | 0.21% | 0.10% | -0.18% | 0.05% | |
| GBP | 0.14% | -0.07% | 0.06% | 0.11% | 0.06% | -0.24% | 0.00% | |
| JPY | 0.09% | -0.12% | -0.06% | 0.08% | -0.02% | -0.53% | -0.03% | |
| CAD | -0.01% | -0.21% | -0.11% | -0.08% | -0.11% | -0.37% | -0.15% | |
| AUD | 0.10% | -0.10% | -0.06% | 0.02% | 0.11% | -0.35% | -0.06% | |
| NZD | 0.51% | 0.18% | 0.24% | 0.53% | 0.37% | 0.35% | 0.40% | |
| CHF | 0.15% | -0.05% | -0.00% | 0.03% | 0.15% | 0.06% | -0.40% |
The heat map shows percentage changes of major currencies against each other. The base currency is picked from the left column, while the quote currency is picked from the top row. For example, if you pick the New Zealand Dollar from the left column and move along the horizontal line to the US Dollar, the percentage change displayed in the box will represent NZD (base)/USD (quote).

FXStreet
Hơn một triệu người dùng dựa vào FXStreet để có dữ liệu thị trường thời gian thực, công cụ biểu đồ, góc nhìn chuyên gia và tin tức Forex. Lịch kinh tế toàn diện và các hội thảo web giáo dục giúp nhà giao dịch luôn cập nhật và đưa ra quyết định có tính toán. FXStreet có khoảng 60 nhân sự, chia giữa trụ sở Barcelona và nhiều khu vực toàn cầu.
Read More


