
Trade The World
NZD/USD rebounds, eyes 0.5800 with bullish reversal signal in focus
Bởi Christian Borjon Valencia
Ngày xuất bản: 9 Oct 2025 | Ngày chỉnh sửa: 9 Oct 2025


POPULAR ARTICLES

The New Zealand Dollar trimmed some of its losses on Wednesday still finished the session with losses of over 0.20% after reaching a six-month low of 0.5737. Nevertheless, as it recovered and closed above 0.5750, the NZD/USD formed a ‘hammer,’ indicating that bulls outweighed bears.
- NZD/USD rebounds from 0.5737, forming a bullish reversal signal as traders target 0.5800.
- A decisive break could expose convergence of 20- and 200-day SMAs near 0.5847/49, opening room for further upside.
- Failure to hold above 0.5800 risks renewed pressure toward 0.5737, 0.5700, and the April low at 0.5485.
The New Zealand Dollar trimmed some of its losses on Wednesday still finished the session with losses of over 0.20% after reaching a six-month low of 0.5737. Nevertheless, as it recovered and closed above 0.5750, the NZD/USD formed a ‘hammer,’ indicating that bulls outweighed bears. At the time of writing, the pair trades at 0.5786 virtually unchanged as Thursday’s Asian session begins.
NZD/USD Price Forecast: Technical outlook
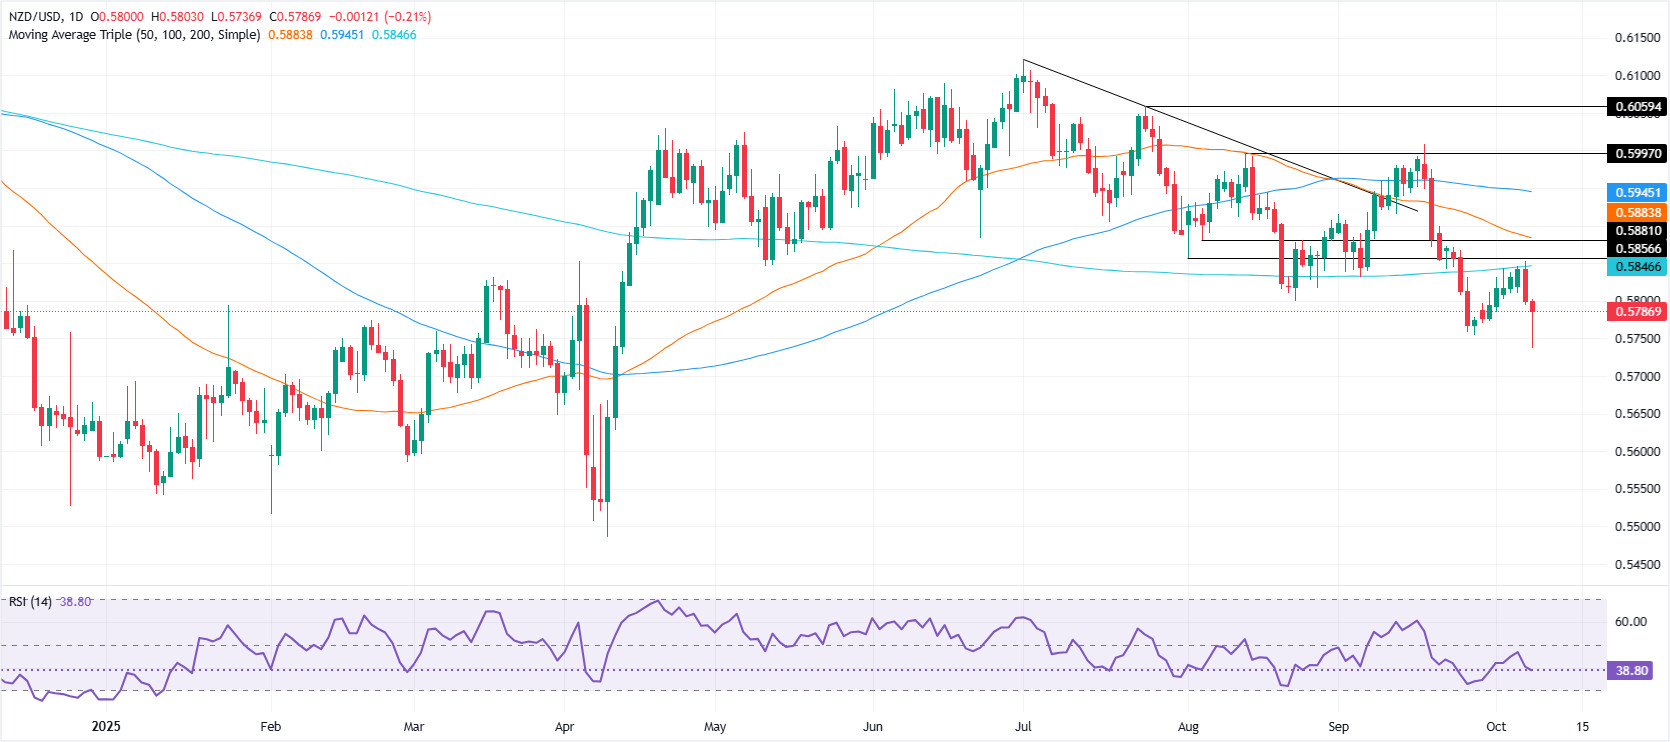
The technical picture shows the NZD/USD has bottomed after diving to multi-month lows. However, a sustained break above 0.5800 would increase bulls’ chances of testing higher prices, like the convergence of the 20 and 200-day Simple Moving Averages (SMAs) around 0.5847/49. If cleared, the next stop would be the 50-day SMA at 0.5881, before reaching the 100-day SMA At 0.5944.
Conversely, if NZD/USD stays below 0.5800m the first support would be 0.5737, followed by 0.5700, before challenging the yearly low of 0.5485 hit on April 9.
NZD/USD Chart – Daily
New Zealand Dollar Price This week
The table below shows the percentage change of New Zealand Dollar (NZD) against listed major currencies this week. New Zealand Dollar was the strongest against the Japanese Yen.
| USD | EUR | GBP | JPY | CAD | AUD | NZD | CHF | |
|---|---|---|---|---|---|---|---|---|
| USD | 0.77% | 0.33% | 2.09% | -0.02% | -0.03% | 0.56% | 0.66% | |
| EUR | -0.77% | -0.54% | 1.24% | -0.82% | -0.83% | -0.24% | -0.15% | |
| GBP | -0.33% | 0.54% | 1.88% | -0.28% | -0.29% | 0.30% | 0.40% | |
| JPY | -2.09% | -1.24% | -1.88% | -2.02% | -2.13% | -1.57% | -1.45% | |
| CAD | 0.02% | 0.82% | 0.28% | 2.02% | 0.04% | 0.58% | 0.68% | |
| AUD | 0.03% | 0.83% | 0.29% | 2.13% | -0.04% | 0.60% | 0.69% | |
| NZD | -0.56% | 0.24% | -0.30% | 1.57% | -0.58% | -0.60% | 0.09% | |
| CHF | -0.66% | 0.15% | -0.40% | 1.45% | -0.68% | -0.69% | -0.09% |
The heat map shows percentage changes of major currencies against each other. The base currency is picked from the left column, while the quote currency is picked from the top row. For example, if you pick the New Zealand Dollar from the left column and move along the horizontal line to the US Dollar, the percentage change displayed in the box will represent NZD (base)/USD (quote).

FXStreet
Hơn một triệu người dùng dựa vào FXStreet để có dữ liệu thị trường thời gian thực, công cụ biểu đồ, góc nhìn chuyên gia và tin tức Forex. Lịch kinh tế toàn diện và các hội thảo web giáo dục giúp nhà giao dịch luôn cập nhật và đưa ra quyết định có tính toán. FXStreet có khoảng 60 nhân sự, chia giữa trụ sở Barcelona và nhiều khu vực toàn cầu.
Read More


