
Trade The World
Sei Price Forecast: SEI eyes recovery amid ETF filing, robust network activity
Bởi Vishal Dixit
Ngày xuất bản: 2 Sep 2025 | Ngày chỉnh sửa: 2 Sep 2025


POPULAR ARTICLES

Sei (SEI) edges higher by over 2% at press time on Tuesday, gradually recovering from the 3% loss on the previous day. The on-chain data suggest increased network activity, and the recently filed S-1 submission for the 21Shares SEI Exchange Traded Fund (ETF) implies a potential rebound.
- SEI ticks up by more than 2% on Tuesday, with bulls planning a rebound to the upper Bollinger Band.
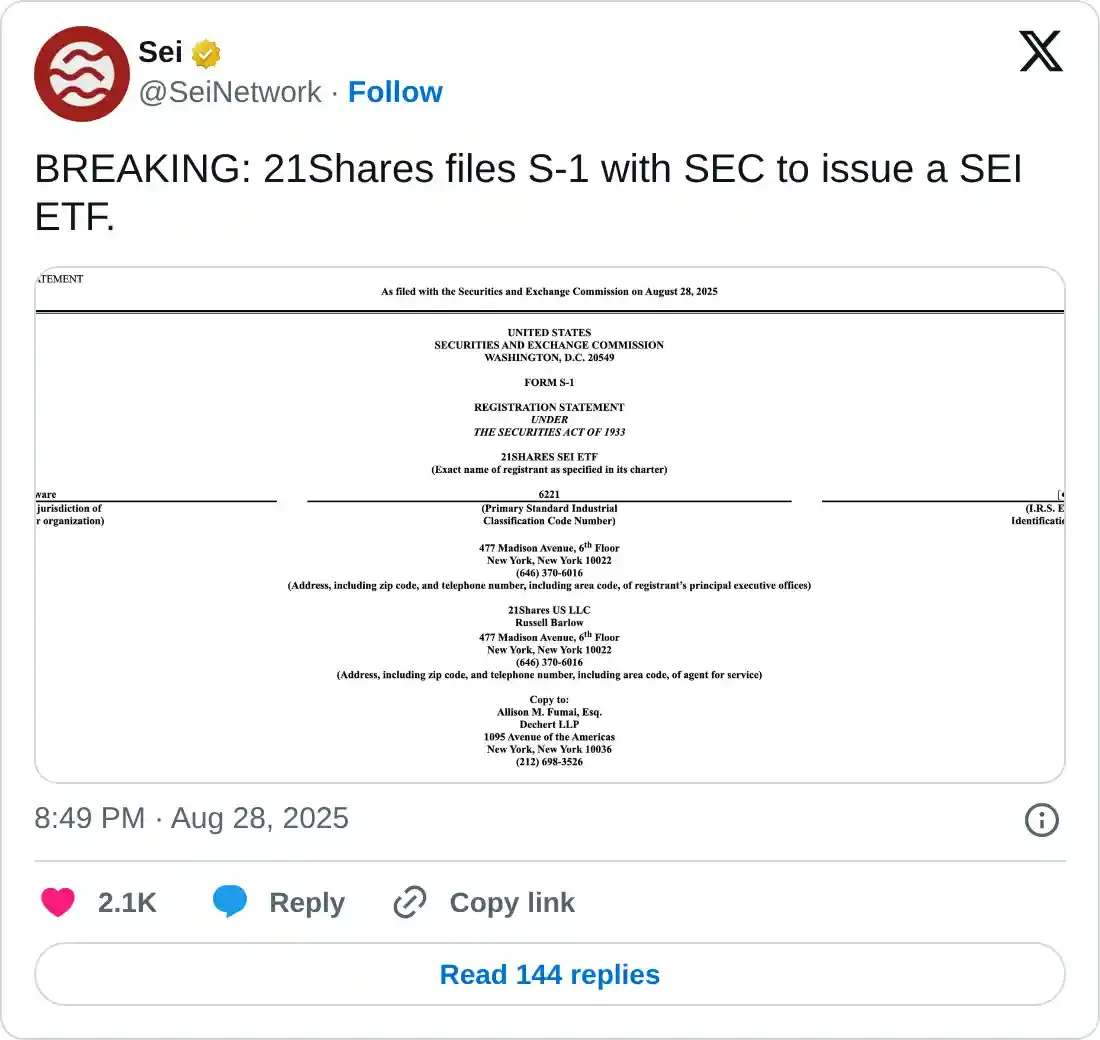
- 21Shares files S-1 with the US SEC for a SEI ETF.
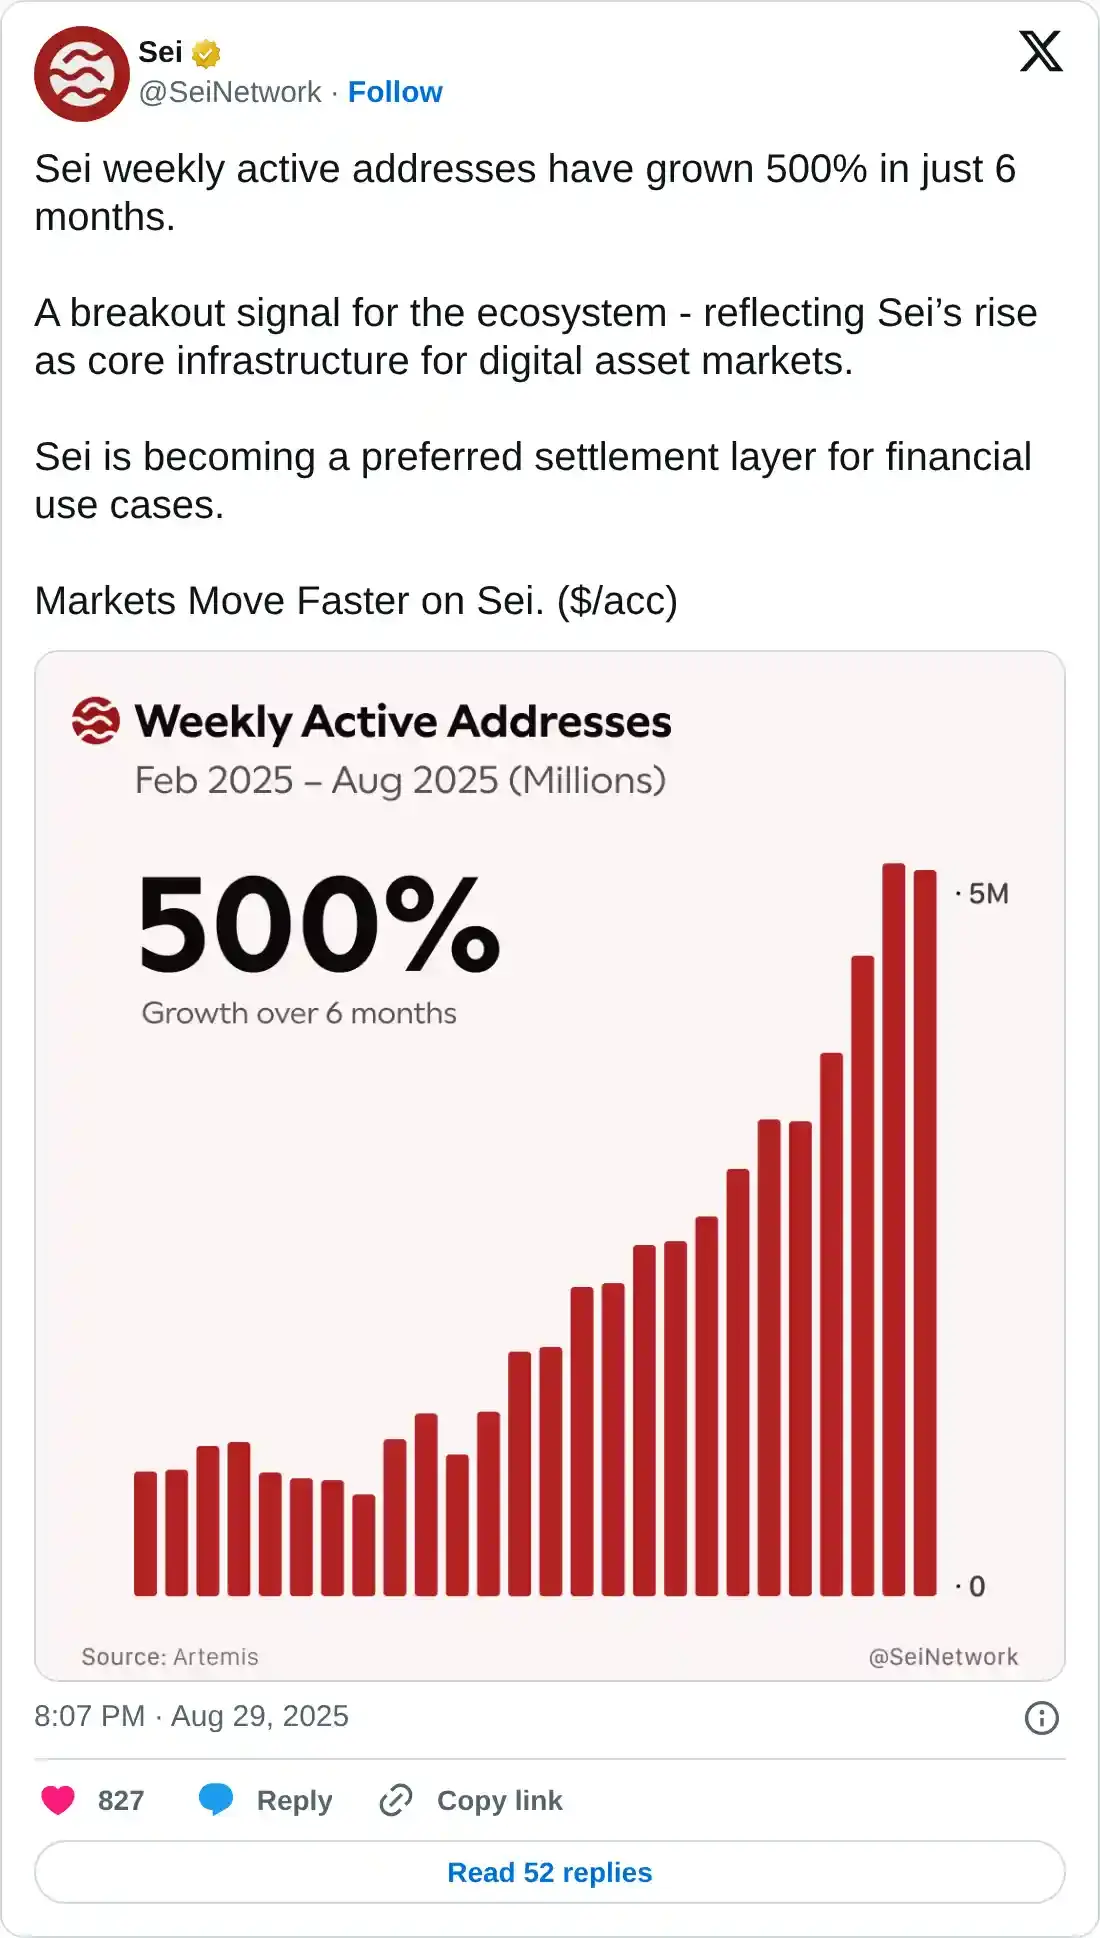
- A 500% rise in the weekly active addresses in the last six months signals significant network growth.
Sei (SEI) edges higher by over 2% at press time on Tuesday, gradually recovering from the 3% loss on the previous day. The on-chain data suggest increased network activity, and the recently filed S-1 submission for the 21Shares SEI Exchange Traded Fund (ETF) implies a potential rebound.
SEI optimistic developments
21Shares filed an S-1 submission with the US Securities and Exchange Commission (SEC) on Friday, joining the queue with Canary Capital. The increased institutional interest in the altcoin fuels the investors’ sentiment.
SEI announced a 500% rise in weekly active addresses in the last six months on Saturday. Notably, the active addresses crossed 5 million for the second consecutive week, indicating increased network adoption and activity.
DeFiLlama data indicates that the Total Value Locked (TVL) on the network is valued at $565.42 million, up from $559.35 million on Monday. A rise in the TVL is a healthy signal for network growth.
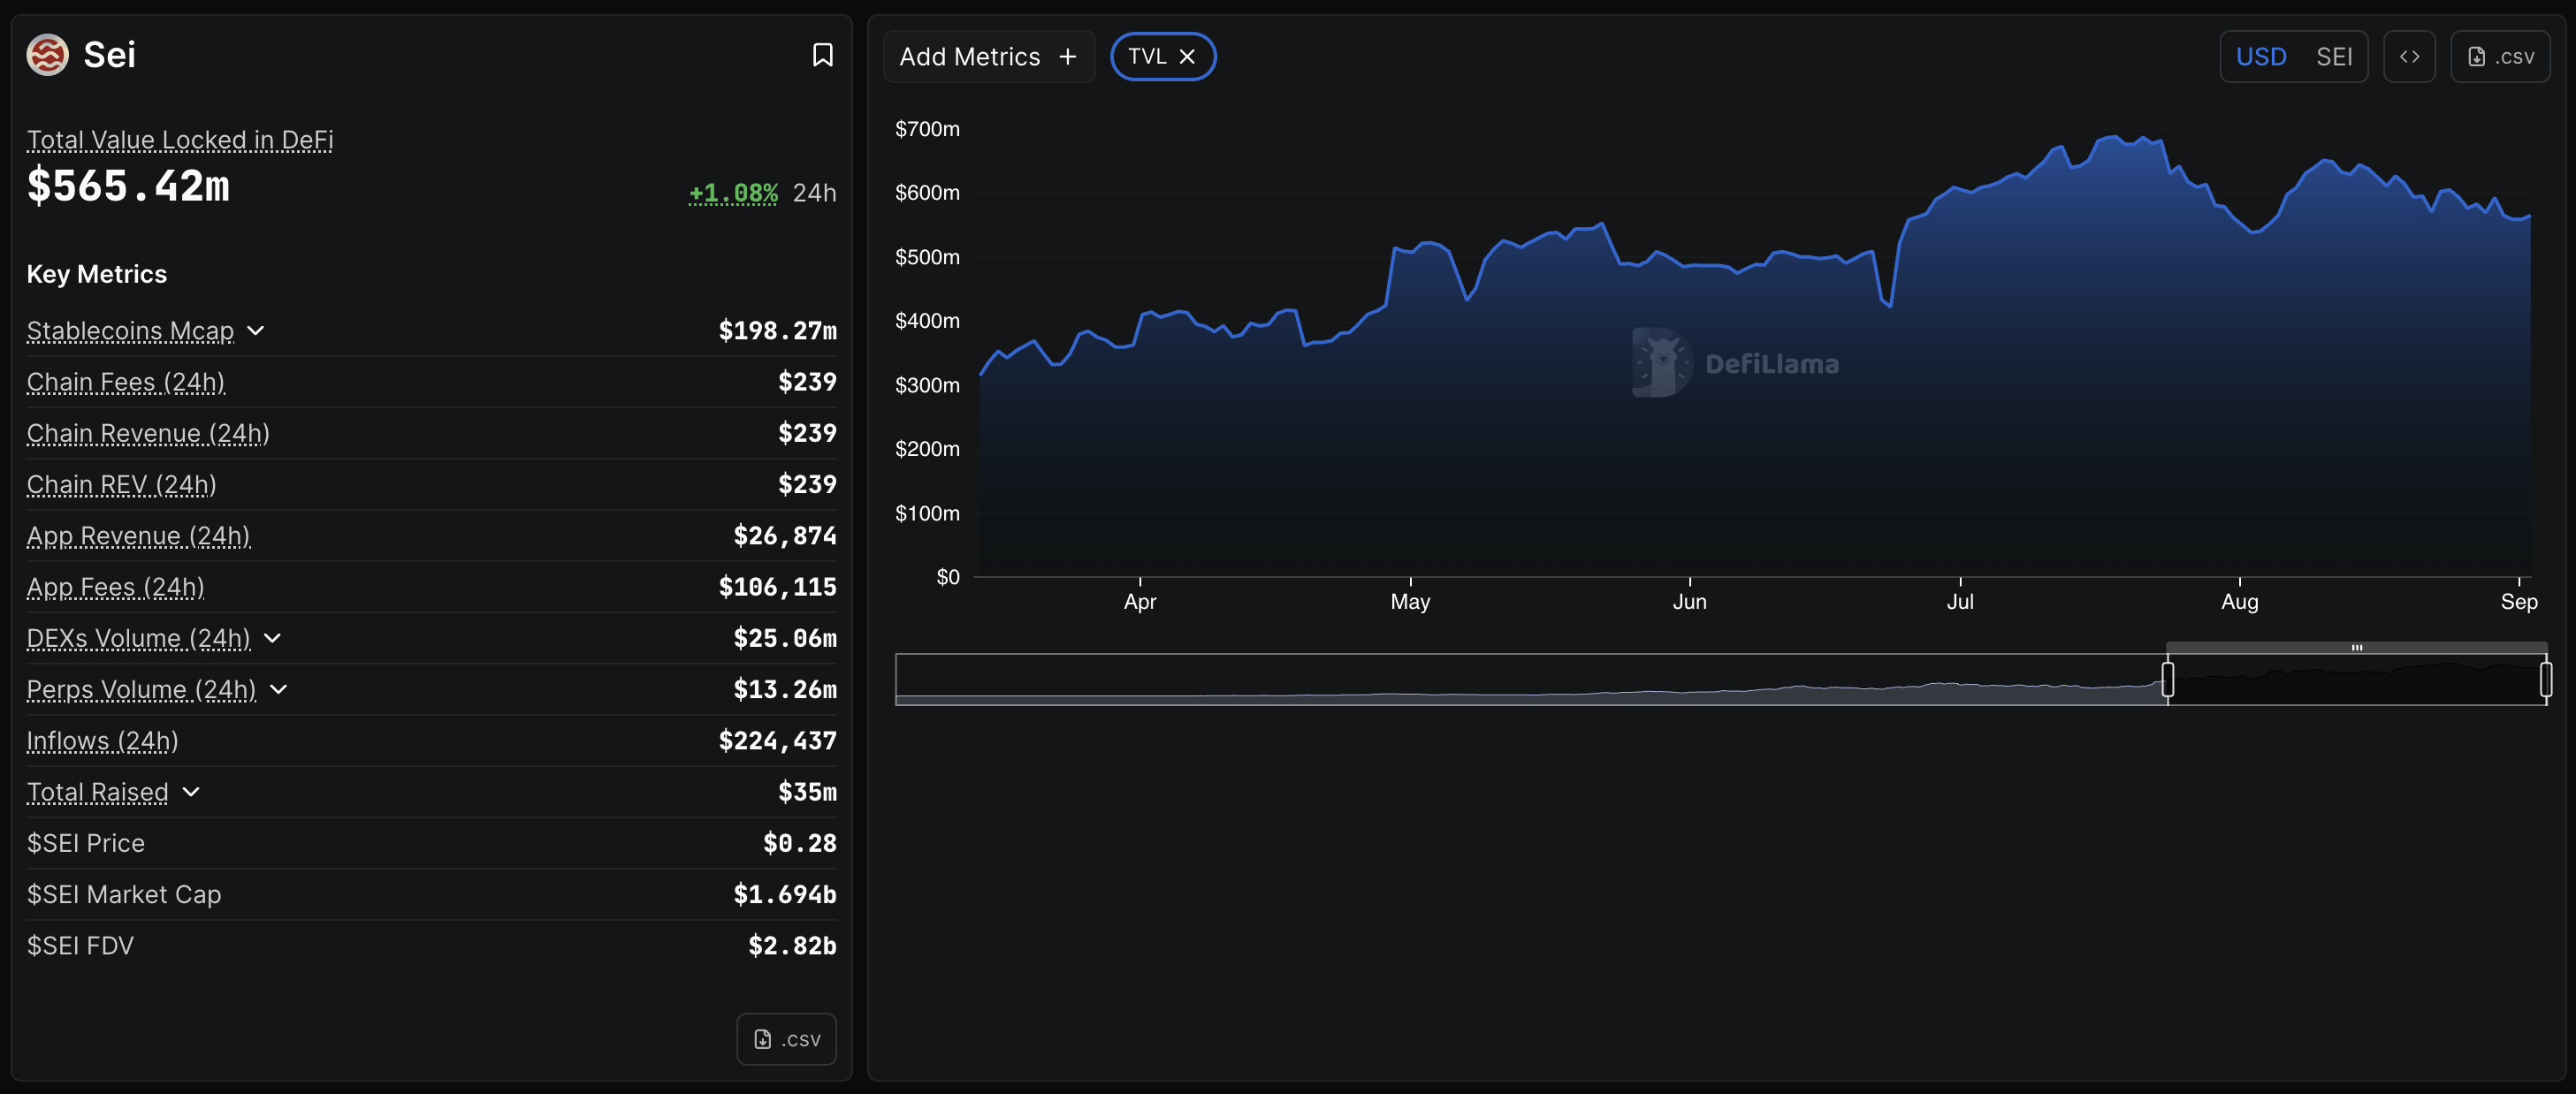
SEI TVL. Source: DeFiLlama
SEI is at a crucial crossroads
SEI rebounds from the lower Bollinger Band on the daily chart, avoiding a drop to the 38.2% Fibonacci level, which is drawn from the $0.7357 peak from December 5 to $0.1303 low from April 7, at $0.2524. The Bollinger Bands are moving sideways, reflecting a low-volatility contraction phase, while the lower band provides support, hinting at a potential bounce back.
A potential extended recovery could target the 50% Fibonacci retracement level at $0.3097.
CoinGlass data indicates that the SEI Open Interest (OI) has decreased significantly to $233.28 million, down from $245.17 million on Monday. This sharp decline in OI translates to investors adopting a wait-and-see approach.
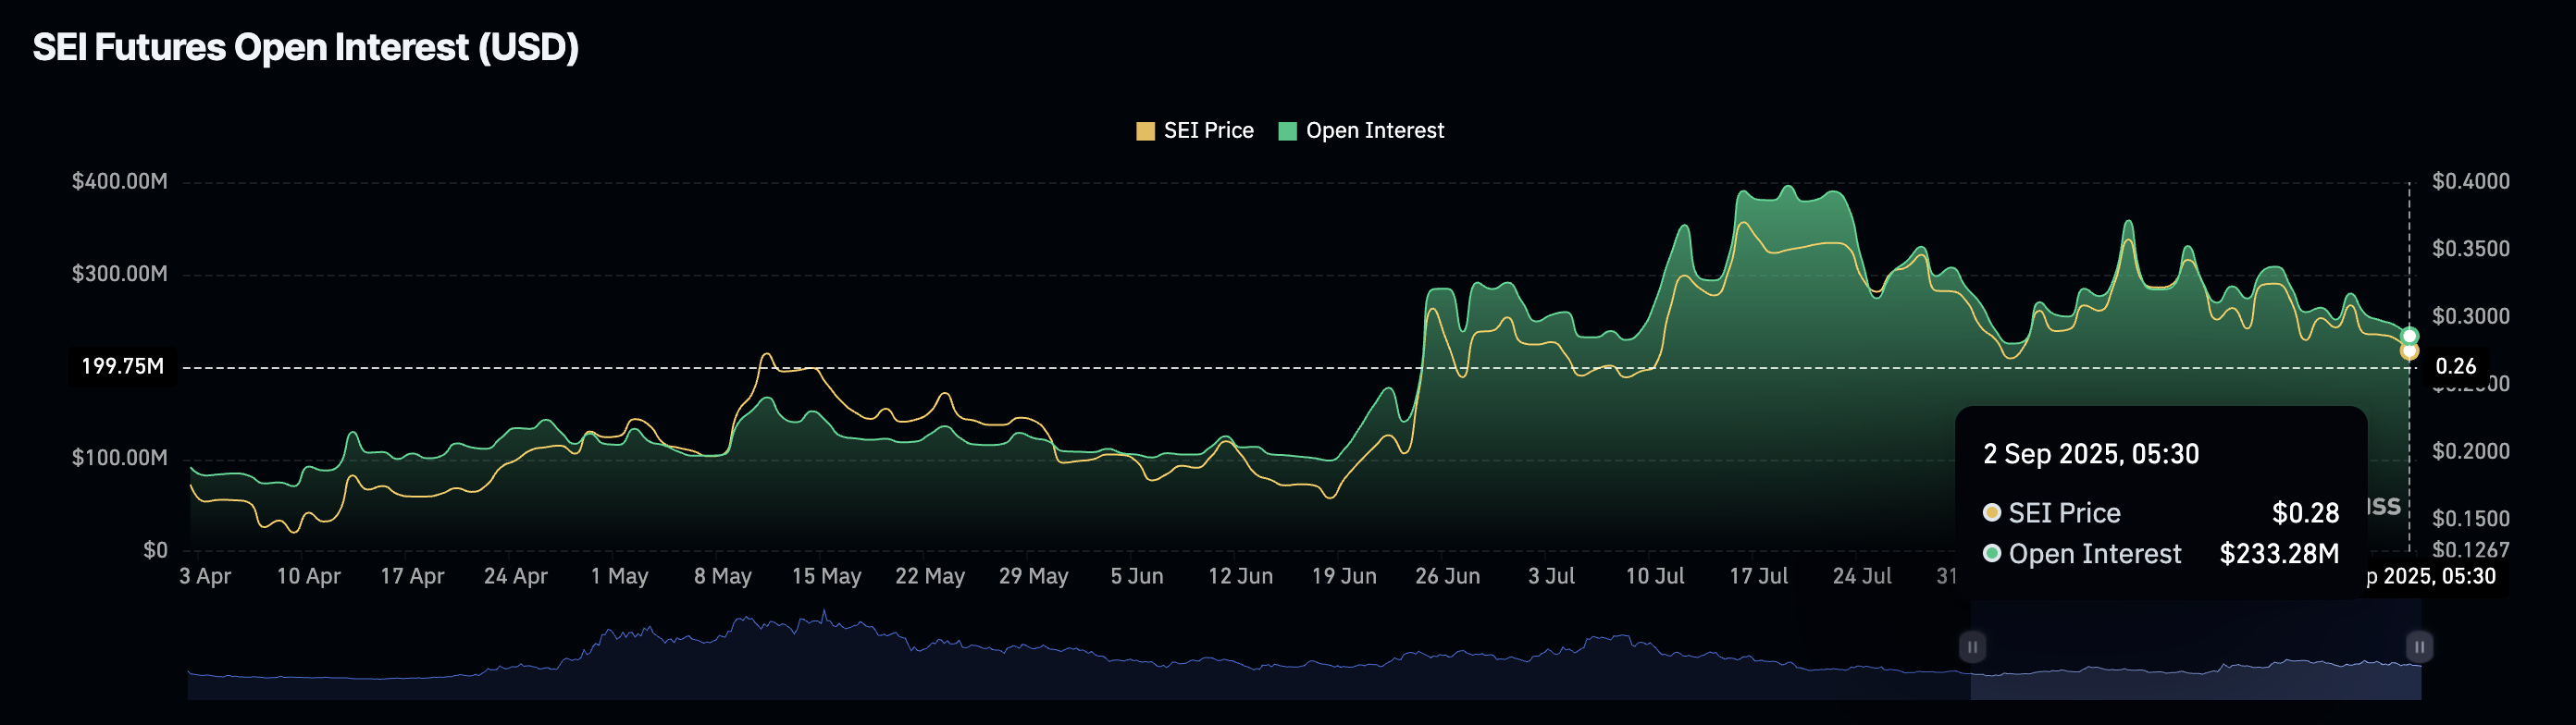
SEI Open Interest. Source: Coinglass
Adding to the lowered optimism among traders, the Taker sell volume dominates 50.44%, reducing the long-to-short ratio to 0.9826.
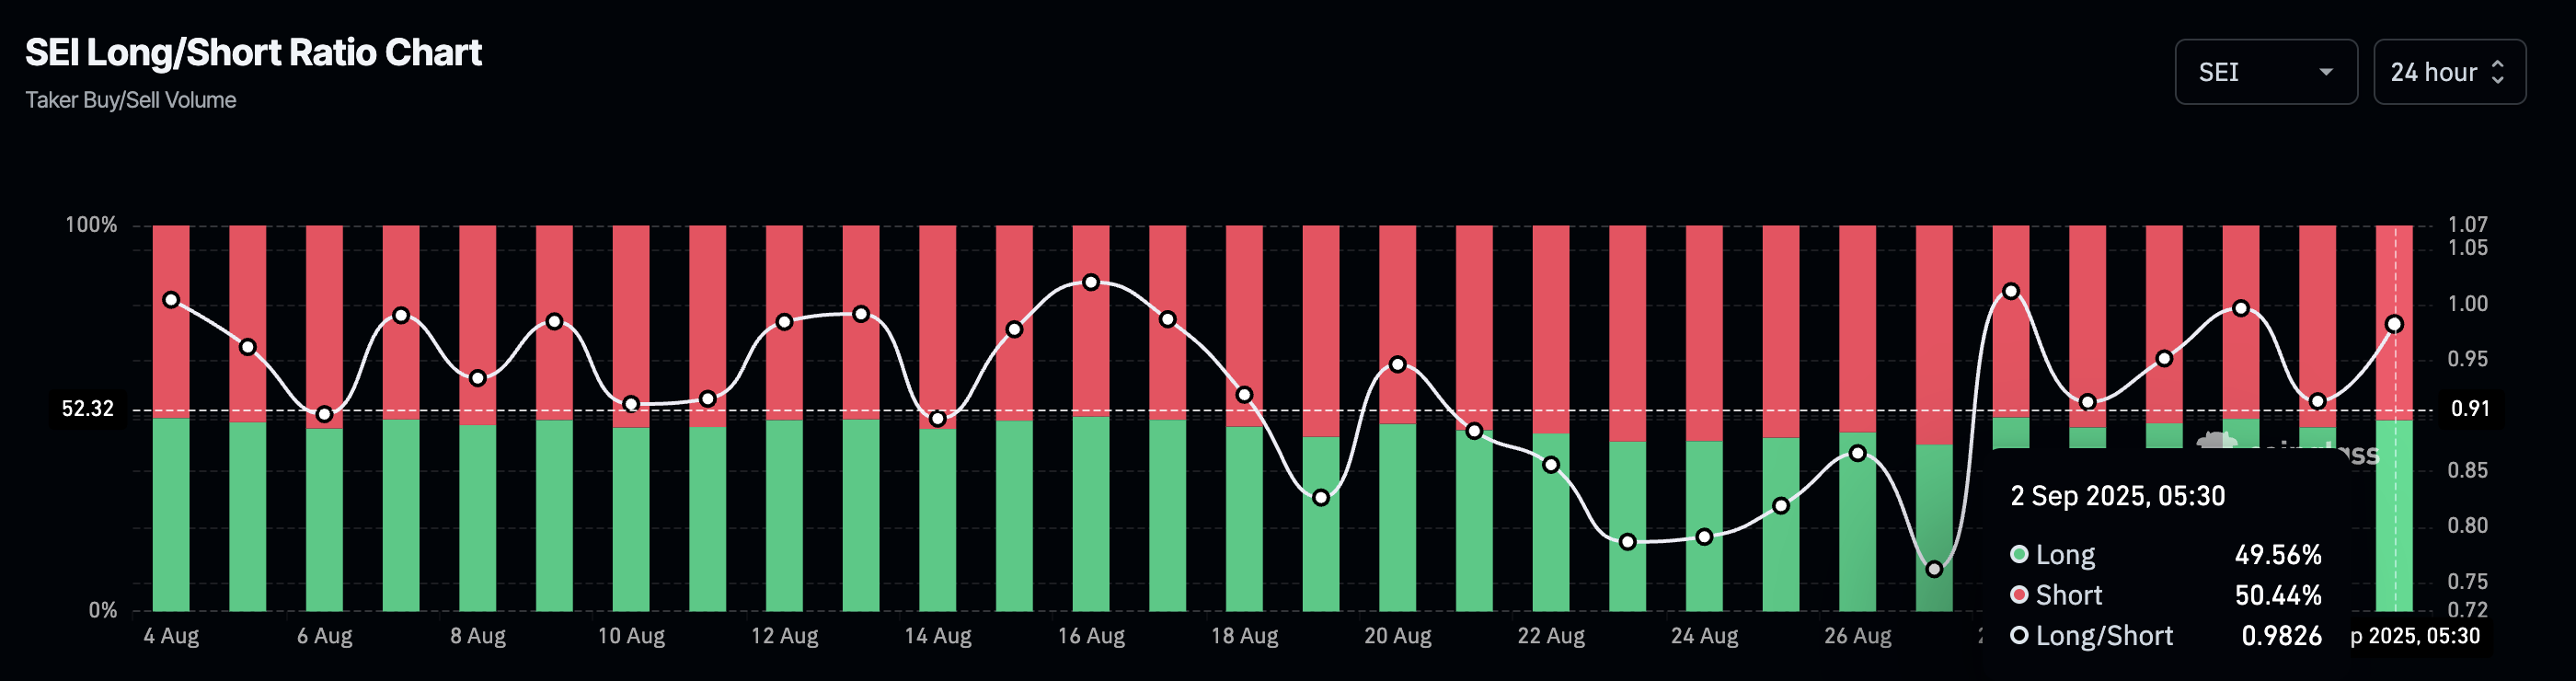
SEI long/short ratio chart. Source: Coinglass
The momentum indicators on the daily chart display diminishing signs of a bullish recovery, as the Moving Average Convergence Divergence (MACD) and its signal line move in a sloping downward direction, indicating rising bearish pressure.
Additionally, the Relative Strength Index (RSI) at 43 hovers below the midpoint, indicating mild bearish momentum.
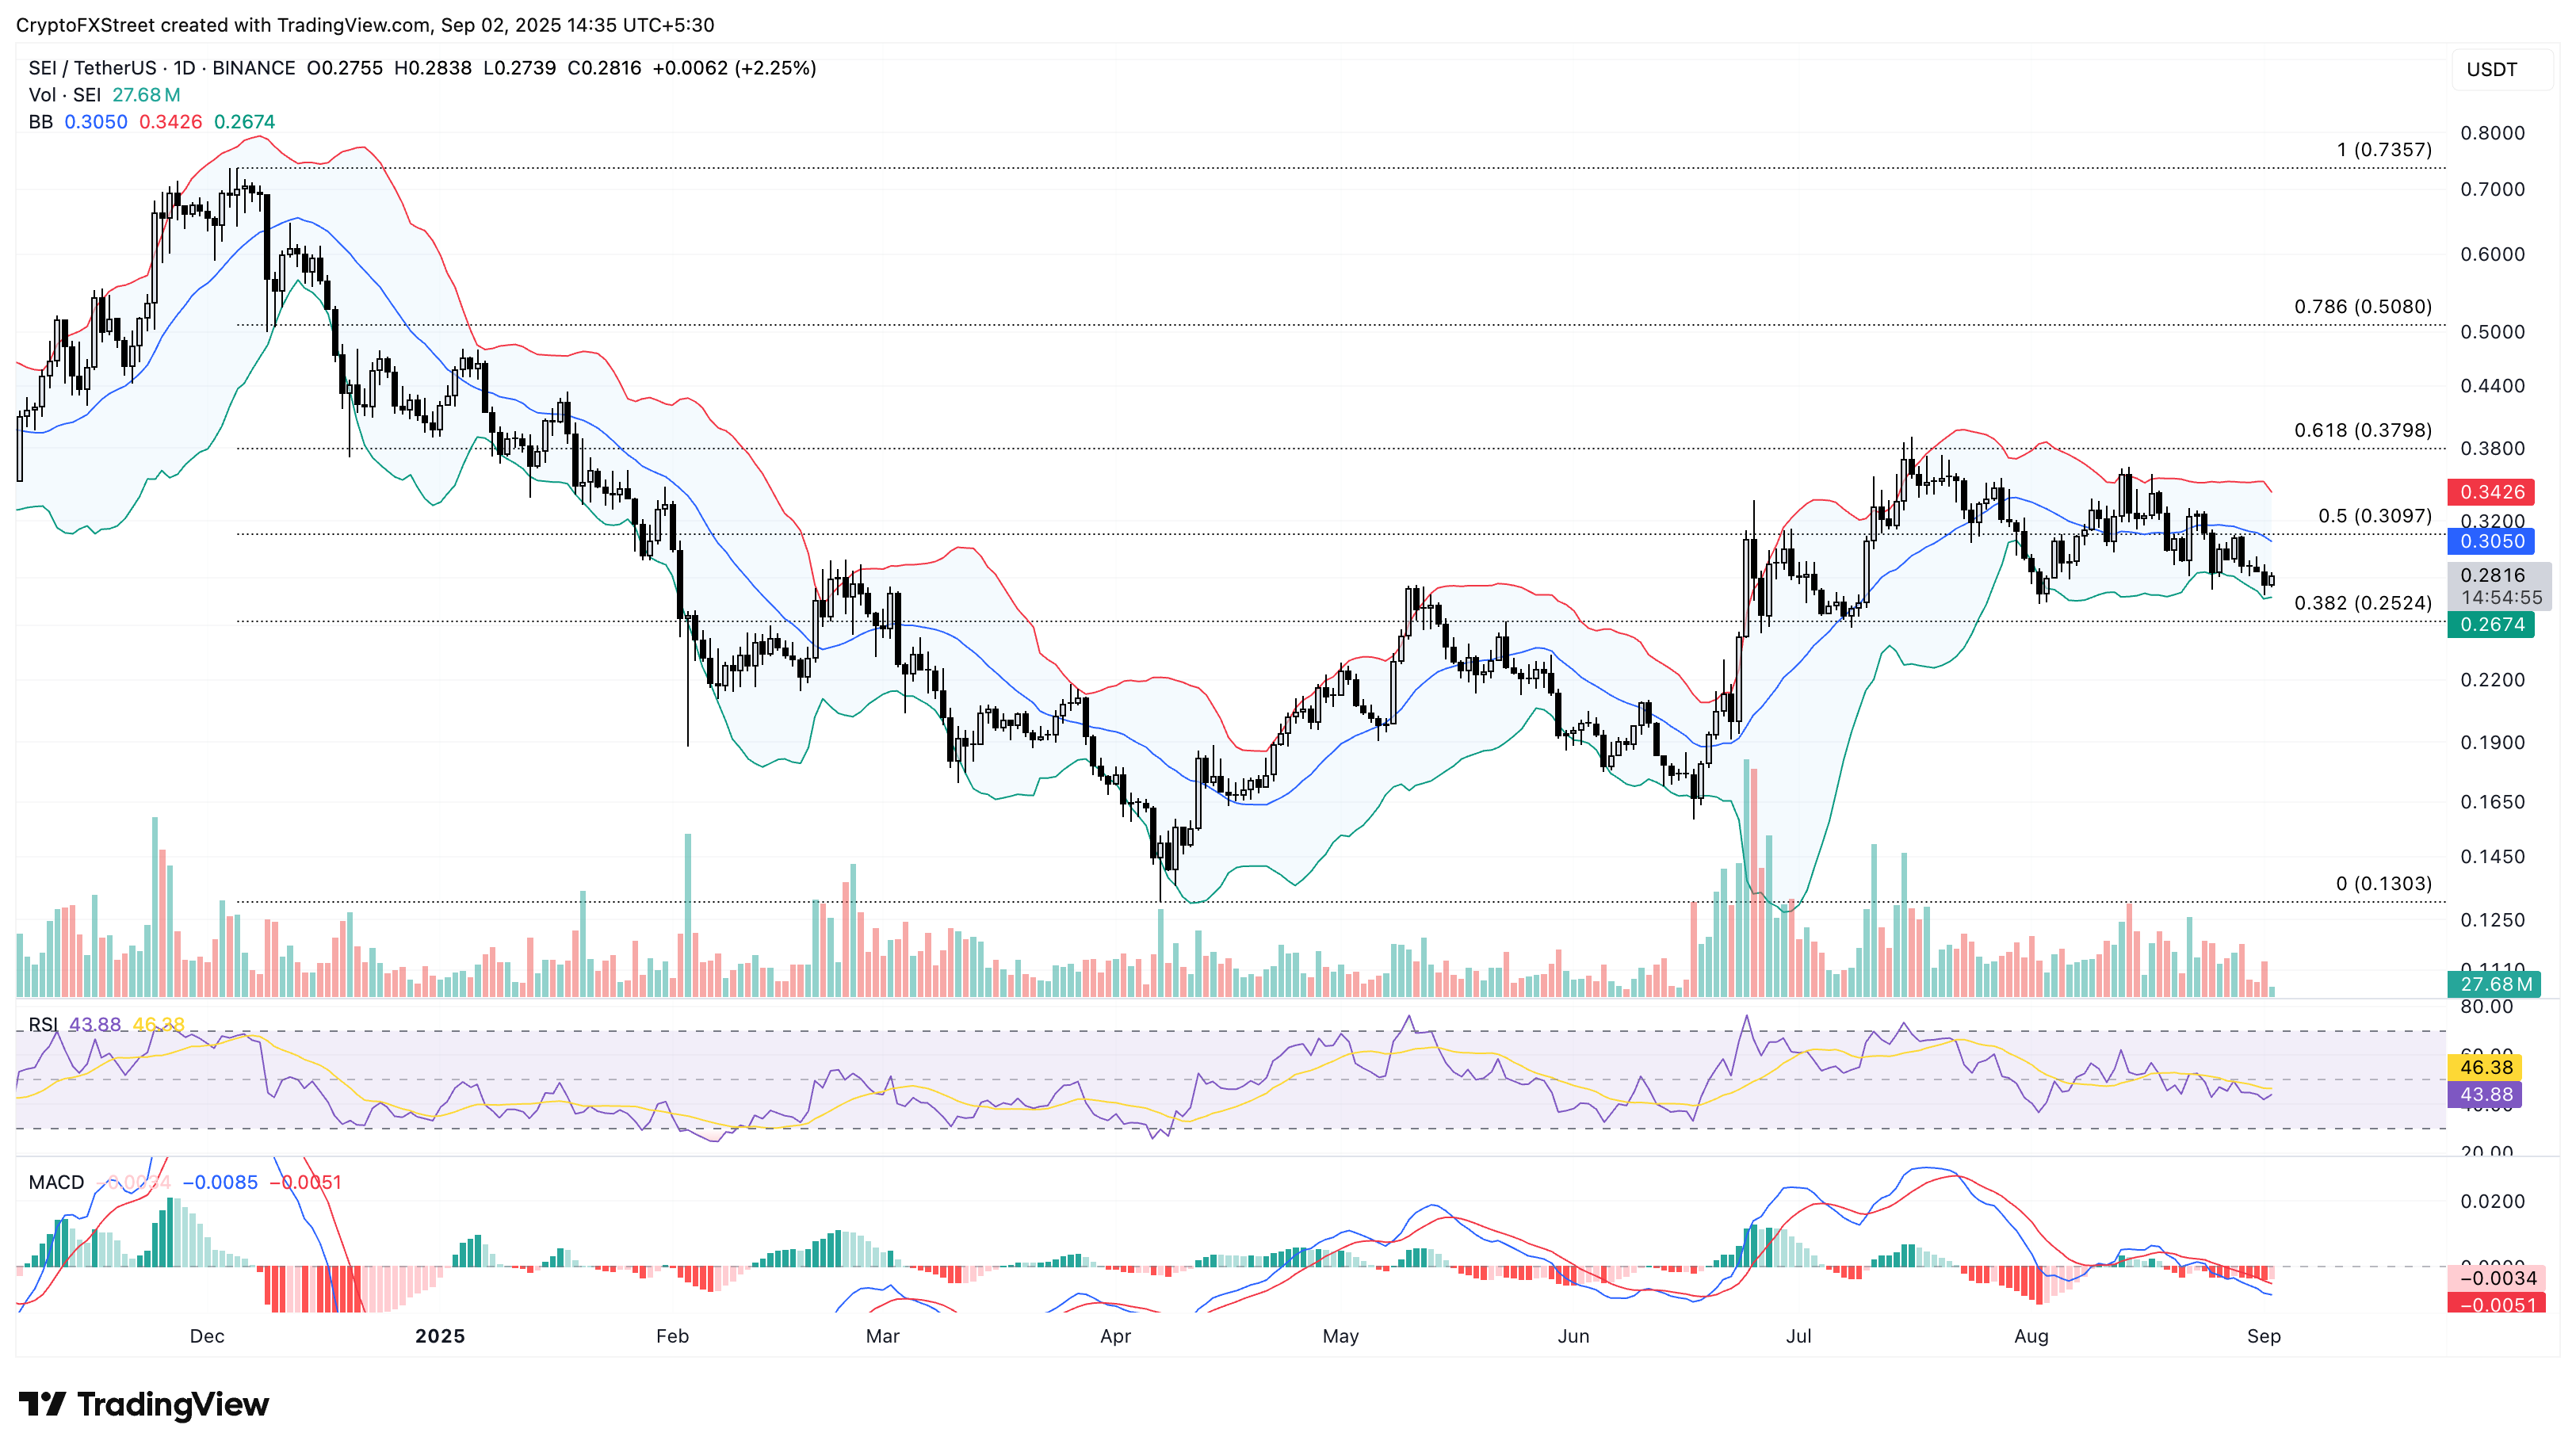
SEI/USDT daily price chart.
Looking down, if SEI marks a close below the 38.2% Fibonacci level at $0.2524, it could test the $0.2000 psychological support.

FXStreet
Hơn một triệu người dùng dựa vào FXStreet để có dữ liệu thị trường thời gian thực, công cụ biểu đồ, góc nhìn chuyên gia và tin tức Forex. Lịch kinh tế toàn diện và các hội thảo web giáo dục giúp nhà giao dịch luôn cập nhật và đưa ra quyết định có tính toán. FXStreet có khoảng 60 nhân sự, chia giữa trụ sở Barcelona và nhiều khu vực toàn cầu.
Read More


