
Trade The World
Solana Price Forecast: SOL steadies near $140 as new spot ETFs launch, boosts sentiment
Bởi Manish Chhetri
Ngày xuất bản: 19 Nov 2025 | Ngày chỉnh sửa: 19 Nov 2025


POPULAR ARTICLES

Solana (SOL) price trades around $140 at the time of writing on Wednesday after rebounding from a key support level the previous day.
- Solana price hovers around $140 on Wednesday, after rebounding from its key support level the previous day.
- Canary Capital and Fidelity announced the launch of their spot Solana ETFs SOLC and FSOL on Tuesday, boosting market sentiment.
- The technical outlook suggests further recovery if SOL holds above $128.68, the weekly support level.
Solana (SOL) price trades around $140 at the time of writing on Wednesday after rebounding from a key support level the previous day. Canary Capital and Fidelity announced the launch of their spot Solana Exchange Traded Funds (ETFs), SOLC and FSOL, on Tuesday, lifting market sentiment amid growing institutional interest. The technical outlook suggests further upside if SOL holds above the weekly support level at $128.68.
Institutional demand rises as multiple asset managers launch Solana ETFs
Canary Capital announced the launch of its spot Solana ETF, SOLC, on Tuesday, coinciding with Fidelity’s debut of the FSOL Solana ETF on the same day.

Fidelity becomes the fourth asset manager to roll out an SOL ETF and the first from the firm to feature staking. Moreover, Bitwise, which launched its product in late October, and Grayscale, whose fund also includes a staking component.
This succession of launches underscores accelerating institutional interest in Solana-based investment products, which projects a bullish outlook for Solana and its native token in the long term.
Solana Price Forecast: SOL momentum indicators hint at fading bearish strength
Solana price faced rejection at the daily level of $168.79 on November 11 and declined 22% over the next 6 days. On Tuesday, it recovered more than 7% after retesting the weekly support at $128.68. At the time of writing on Wednesday, it hovers around $139.71.
If the weekly support at $128.68 continues to hold, it could extend the recovery toward the next resistance at $160.
The Relative Strength Index (RSI) on the daily chart is 35, rebounding from the oversold territory, suggesting bearish momentum may be slowing and a potential short-term rebound could emerge.
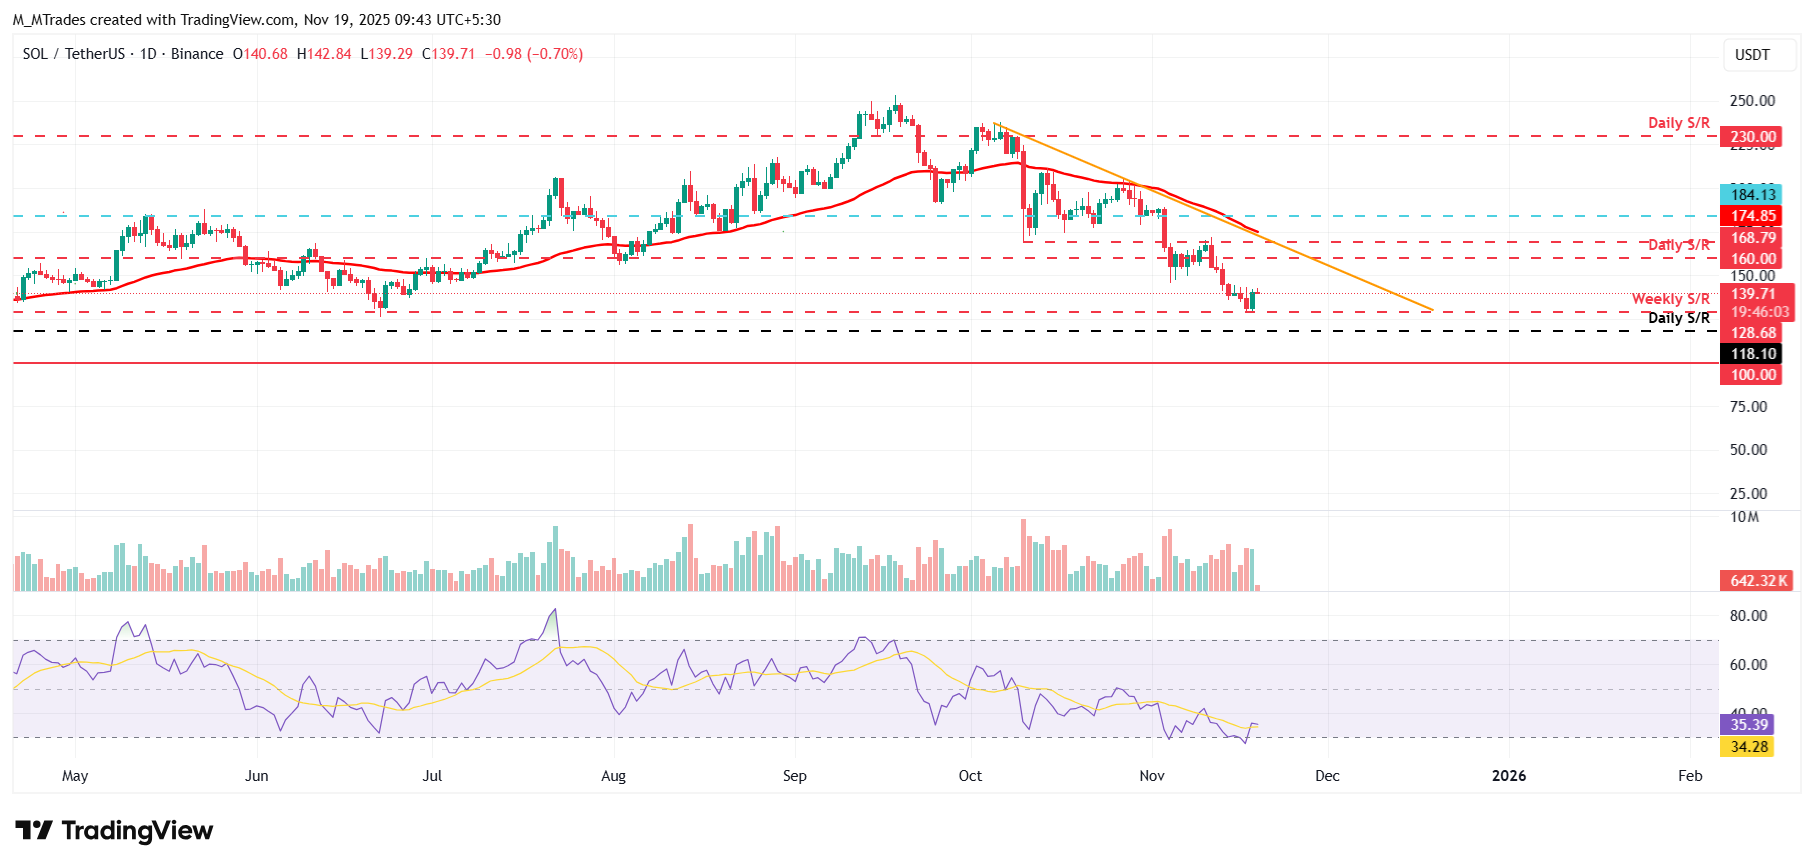
On the other hand, if SOL closes below $128.68, it could extend the decline toward the next daily support at $118.10.

FXStreet
Hơn một triệu người dùng dựa vào FXStreet để có dữ liệu thị trường thời gian thực, công cụ biểu đồ, góc nhìn chuyên gia và tin tức Forex. Lịch kinh tế toàn diện và các hội thảo web giáo dục giúp nhà giao dịch luôn cập nhật và đưa ra quyết định có tính toán. FXStreet có khoảng 60 nhân sự, chia giữa trụ sở Barcelona và nhiều khu vực toàn cầu.
Read More


