
Trade The World
SPX6900 Price Forecast: SPX bears take control, signaling further downside
Bởi Manish Chhetri
Ngày xuất bản: 21 Oct 2025 | Ngày chỉnh sửa: 21 Oct 2025


POPULAR ARTICLES

SPX6900 (SPX) price slides down by nearly 5%, trading around $0.98 at the time of writing on Tuesday after facing rejection from a previously broken trendline. The derivatives data projects a bearish sentiment, with SPX’s Open Interest (OI) falling and bearish bets rising among traders.
- SPX6900 price trades in red on Tuesday after facing rejection from a previously broken trendline.
- Derivatives data show falling Open Interest and a rise in bearish positions, suggesting growing downside pressure.
- The technical outlook suggests weakness, with bears targeting a drop toward the $0.81 level.
SPX6900 (SPX) price slides down by nearly 5%, trading around $0.98 at the time of writing on Tuesday after facing rejection from a previously broken trendline. The derivatives data projects a bearish sentiment, with SPX’s Open Interest (OI) falling and bearish bets rising among traders. The technical side further supports a bearish outlook, suggesting that SPX6900 could extend its decline toward the $0.81 level in the upcoming days.
SPX derivatives data show bearish bias
Coinglass’s futures Open Interest for the SPX meme coin drops to $9.94 million on Tuesday, compared to $18.96 million on October 7. This drop in OI, constantly falling since July, signals waning investor participation and reinforces a weakening market sentiment for the SPX meme coin.
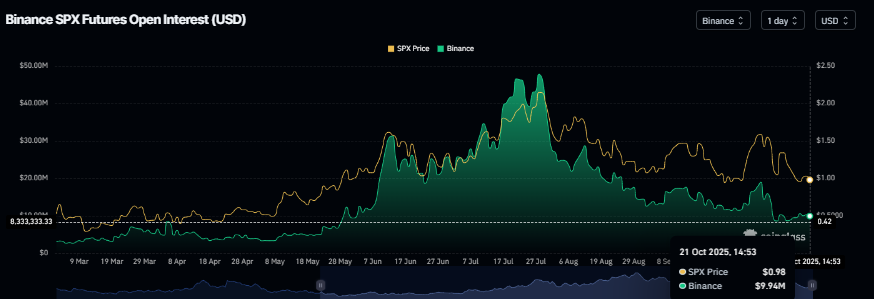
SPX Open Interest chart. Source: Coinglass
Another derivatives metric that strengthens the bearish thesis is CoinGlass’s long-to-short ratio for SPX at 0.86 on Tuesday, the lowest level in over a month, rising bearish bets among traders.
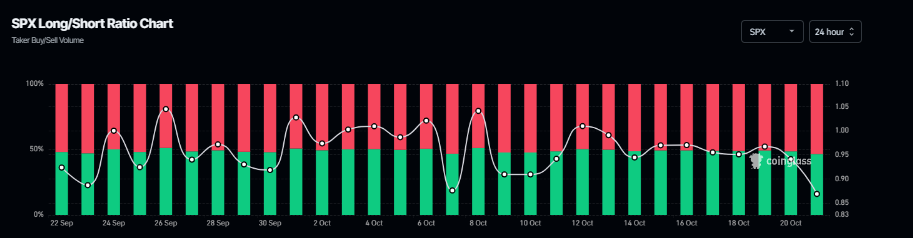
SPX long-to-short ratio chart. Source: Coinglass
SPX6900 Price Forecast: SPX faces rejection from the previously broken trendline
SPX6900 price corrected more than 24% in the previous week after facing rejection around the 50-day Exponential Moving Average (EMA). SPX recovered slightly during the weekend and extended gains on Monday. At the time of writing on Tuesday, SPX trades down by nearly 5% at around $0.98, facing rejection from a previously broken trendline.
If SPX continues its correction, it could extend the decline toward the May 27 low of $0.81.
The Relative Strength Index (RSI) indicator on the daily chart reads 41, below the neutral level of 50, indicating bearish momentum gaining traction. Additionally, the Moving Average Convergence Divergence (MACD) showed a bearish crossover last week, which remains in effect, further supporting the bearish view.
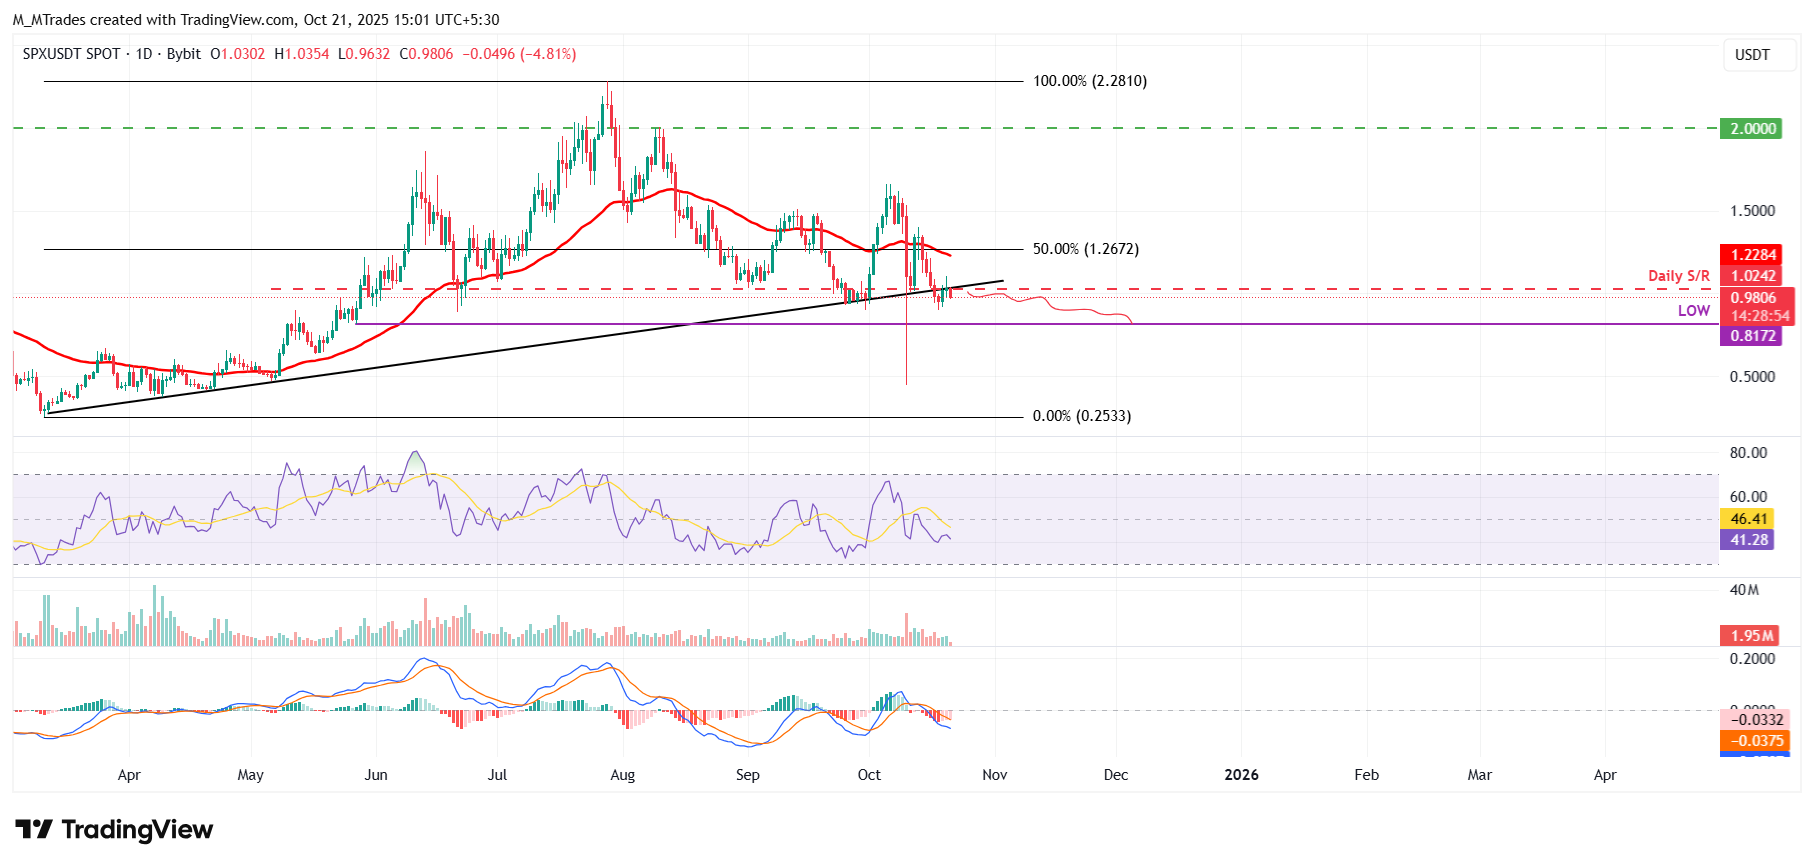
SPX/USDT daily chart
On the other hand, if SPX recovers and closes above the ascending trendline, it could extend the recovery toward the 50-day EMA, currently at $1.22.

FXStreet
Hơn một triệu người dùng dựa vào FXStreet để có dữ liệu thị trường thời gian thực, công cụ biểu đồ, góc nhìn chuyên gia và tin tức Forex. Lịch kinh tế toàn diện và các hội thảo web giáo dục giúp nhà giao dịch luôn cập nhật và đưa ra quyết định có tính toán. FXStreet có khoảng 60 nhân sự, chia giữa trụ sở Barcelona và nhiều khu vực toàn cầu.
Read More


