
Trade The World
Top Crypto Gainers: Brett, Bonk, Dogwifhat – Meme coins rally amid US-Venezuela tensions
Bởi Vishal Dixit
Ngày xuất bản: 5 Jan 2026 | Ngày chỉnh sửa: 5 Jan 2026


POPULAR ARTICLES

Meme coins, including Brett (BRETT), Bonk (BONK), and Dogwifhat (WIF), lead the crypto market rally with double-digit gains over the last 24 hours following the US capture of Venezuelan President Nicolás Maduro on Saturday. Technically, meme coins could extend gains as bulls maintain firm control.
- Brett is up 3%, marking its fifth consecutive day of recovery of over 50%.
- Bonk holds steady after a 28% rally on Sunday, extending the breakout of a falling wedge pattern.
- Dogwifhat holds at $0.40 after a four-day rally of over 50% gains.
Meme coins, including Brett (BRETT), Bonk (BONK), and Dogwifhat (WIF), lead the crypto market rally with double-digit gains over the last 24 hours following the US capture of Venezuelan President Nicolás Maduro on Saturday. Technically, meme coins could extend gains as bulls maintain firm control.
The broader cryptocurrency market is gaining strength amid US President Donald Trump’s attempt to create a new world order, which is also strengthening the US Dollar.
Brett eyes a key resistance breakout for over 50% upside potential
Brett trades above the 50-day Exponential Moving Average (EMA) at $0.1786 after bouncing off the crucial support of $0.01289, marked by the November 22 low. At the time of writing, BRETT is up over 3% on Monday, aiming for the December 2 high at $0.02210.
If the meme coin clears this level, it could aim for the 200-day EMA at $0.03412, suggesting an upside potential of over 50%.
The ongoing five-day recovery records over 50% gains as bullish momentum went into overdrive. The Relative Strength Index (RSI) at 70 hits the overbought boundary, keeping a steady uptrend. This indicates heightened buying pressure, and a sideways movement in the overbought zone could help BRETT extend gains.
At the same time, the Moving Average Convergence Divergence (MACD) crosses above the zero line, reversing upside from the signal line. Additionally, the rising green histogram bars indicate a surge in bullish momentum.
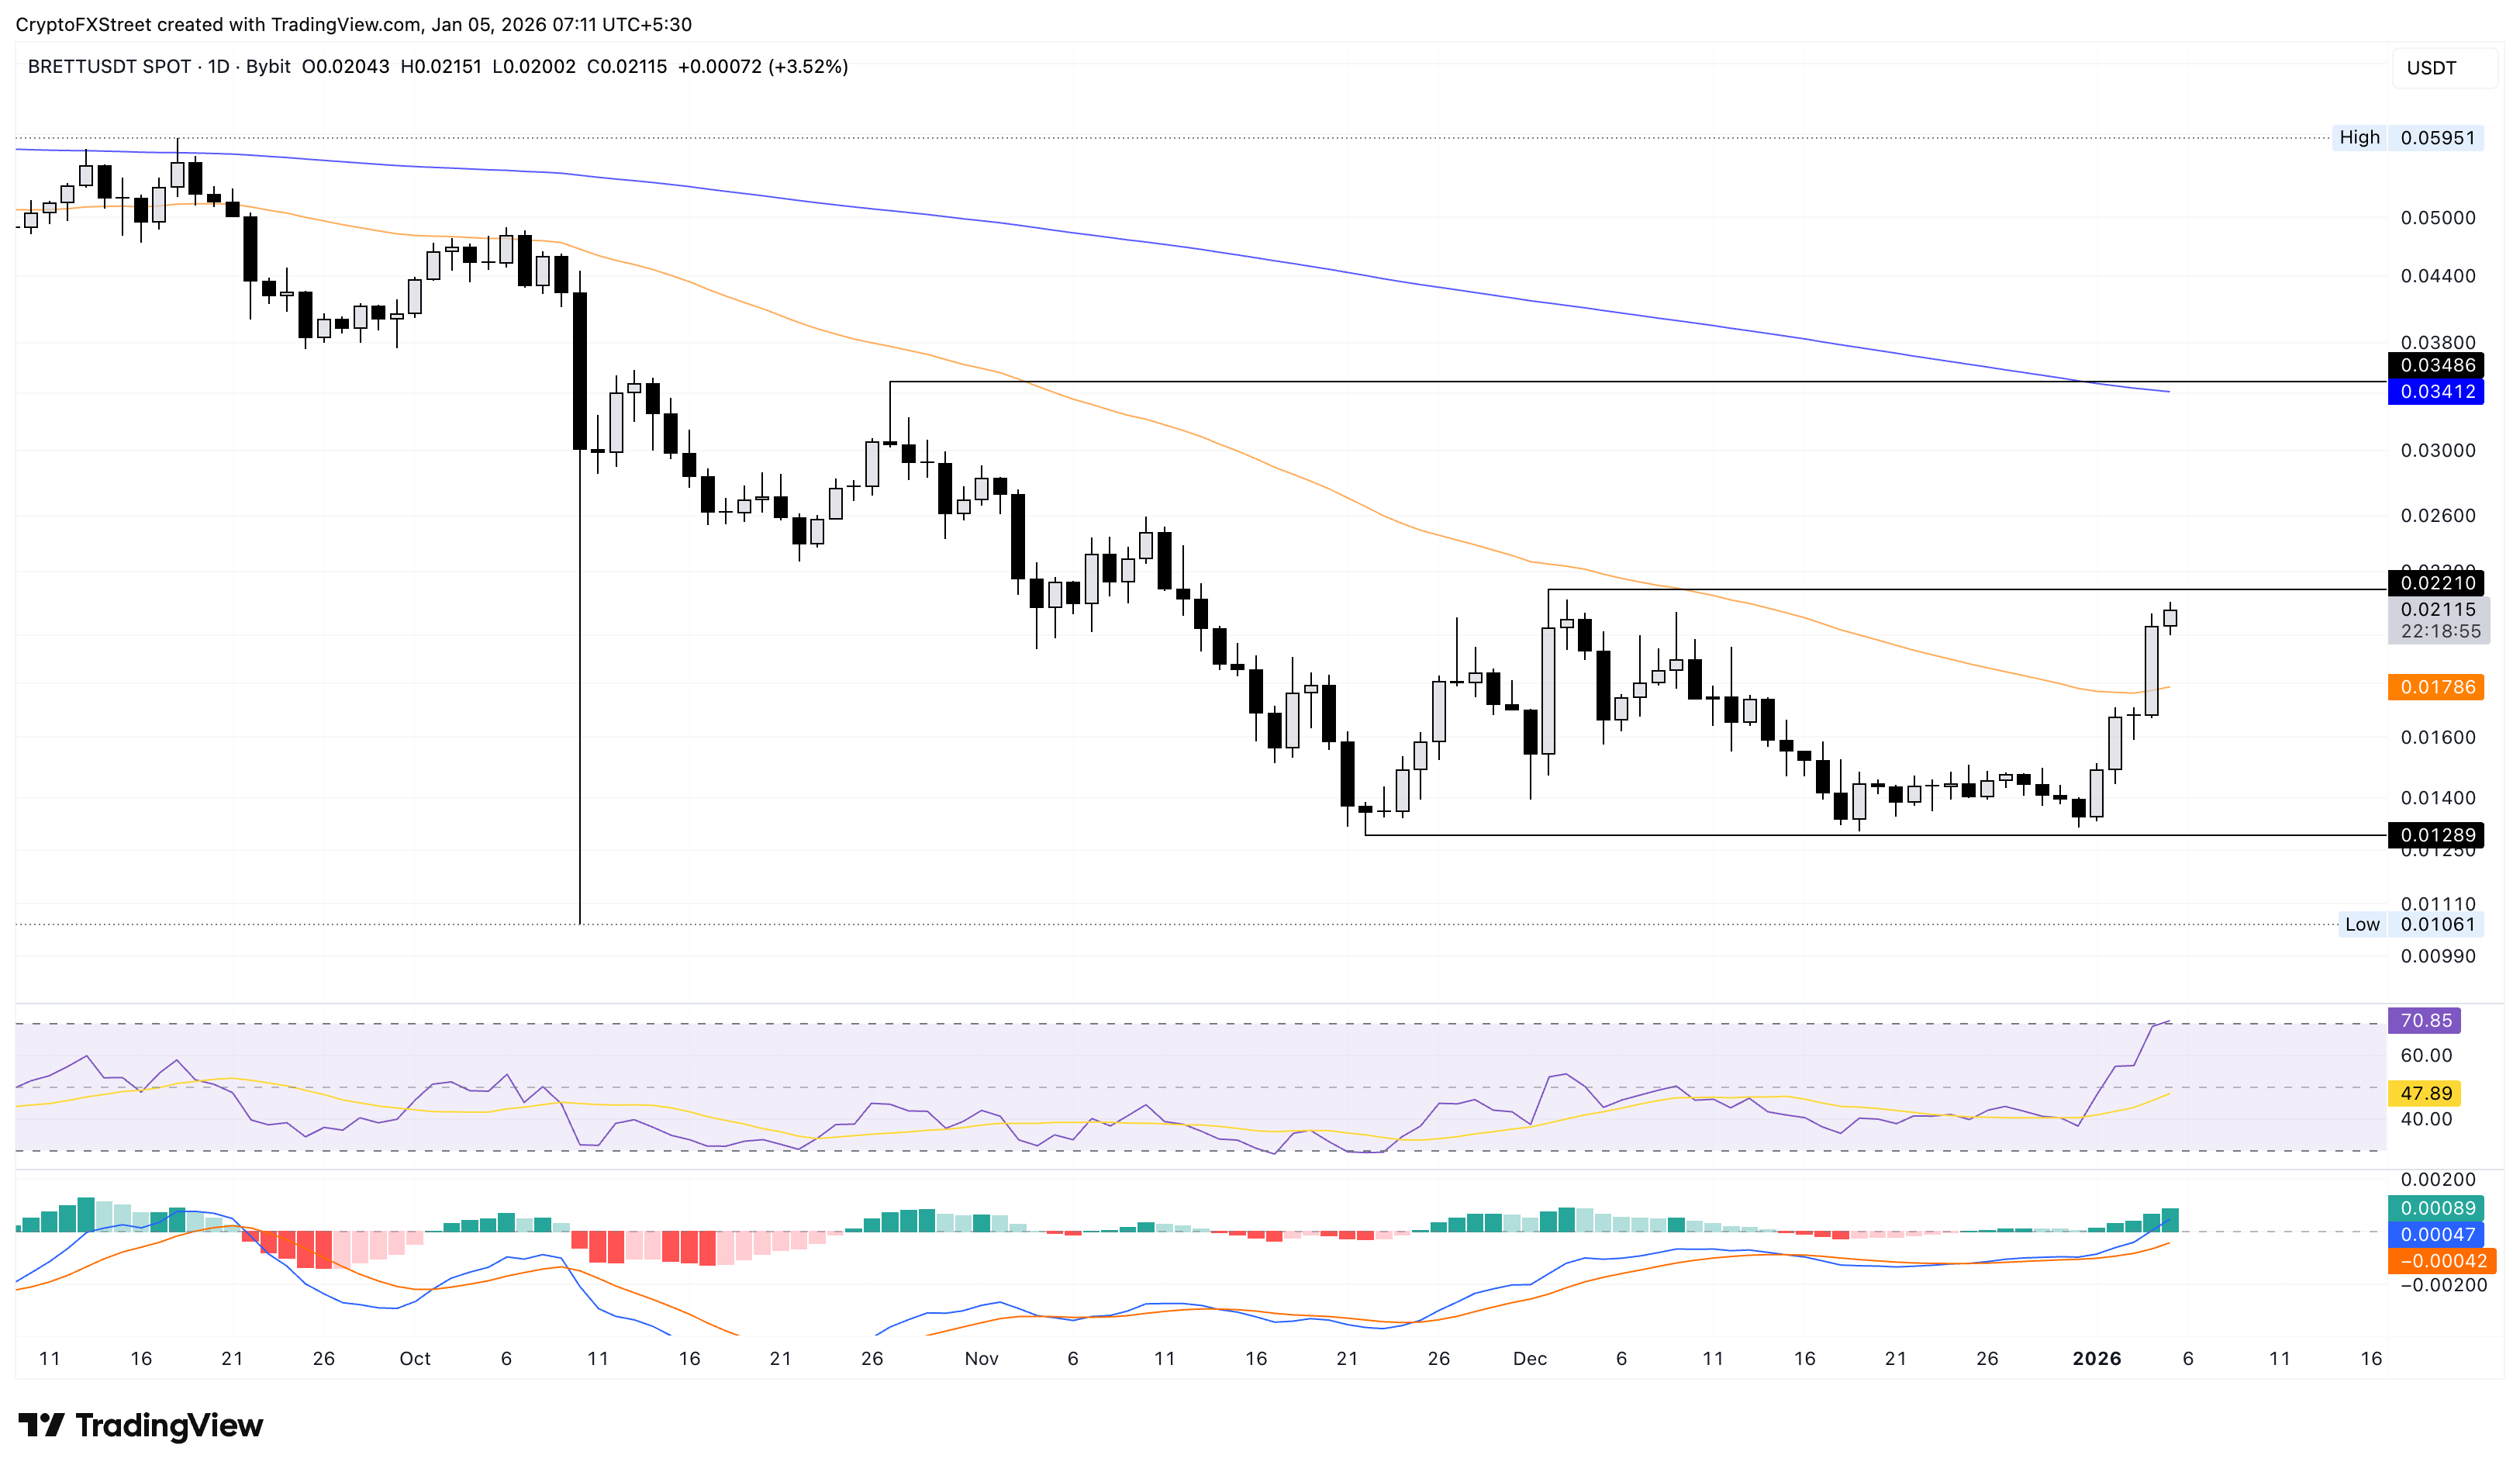
On the flip side, the 50-day EMA at $0.01786 and the November 22 low at $0.01289 could serve as support levels.
Bonk pauses the four-day rally after Sunday’s 28% rise
Bonk is down nearly 1% at press time on Monday, following a 28% jump the previous day that pushed it above the $0.00001000 level. The four-day rally in BONK reflects the breakout rally of a descending wedge pattern, with bulls aiming for the 200-day EMA at $0.00001514.
Similar to BRETT, the momentum indicators on the daily chart suggest an intense bullish momentum. The RSI at 73 enters the overbought zone, while the MACD crosses the zero line and produces successively rising green histogram bars.
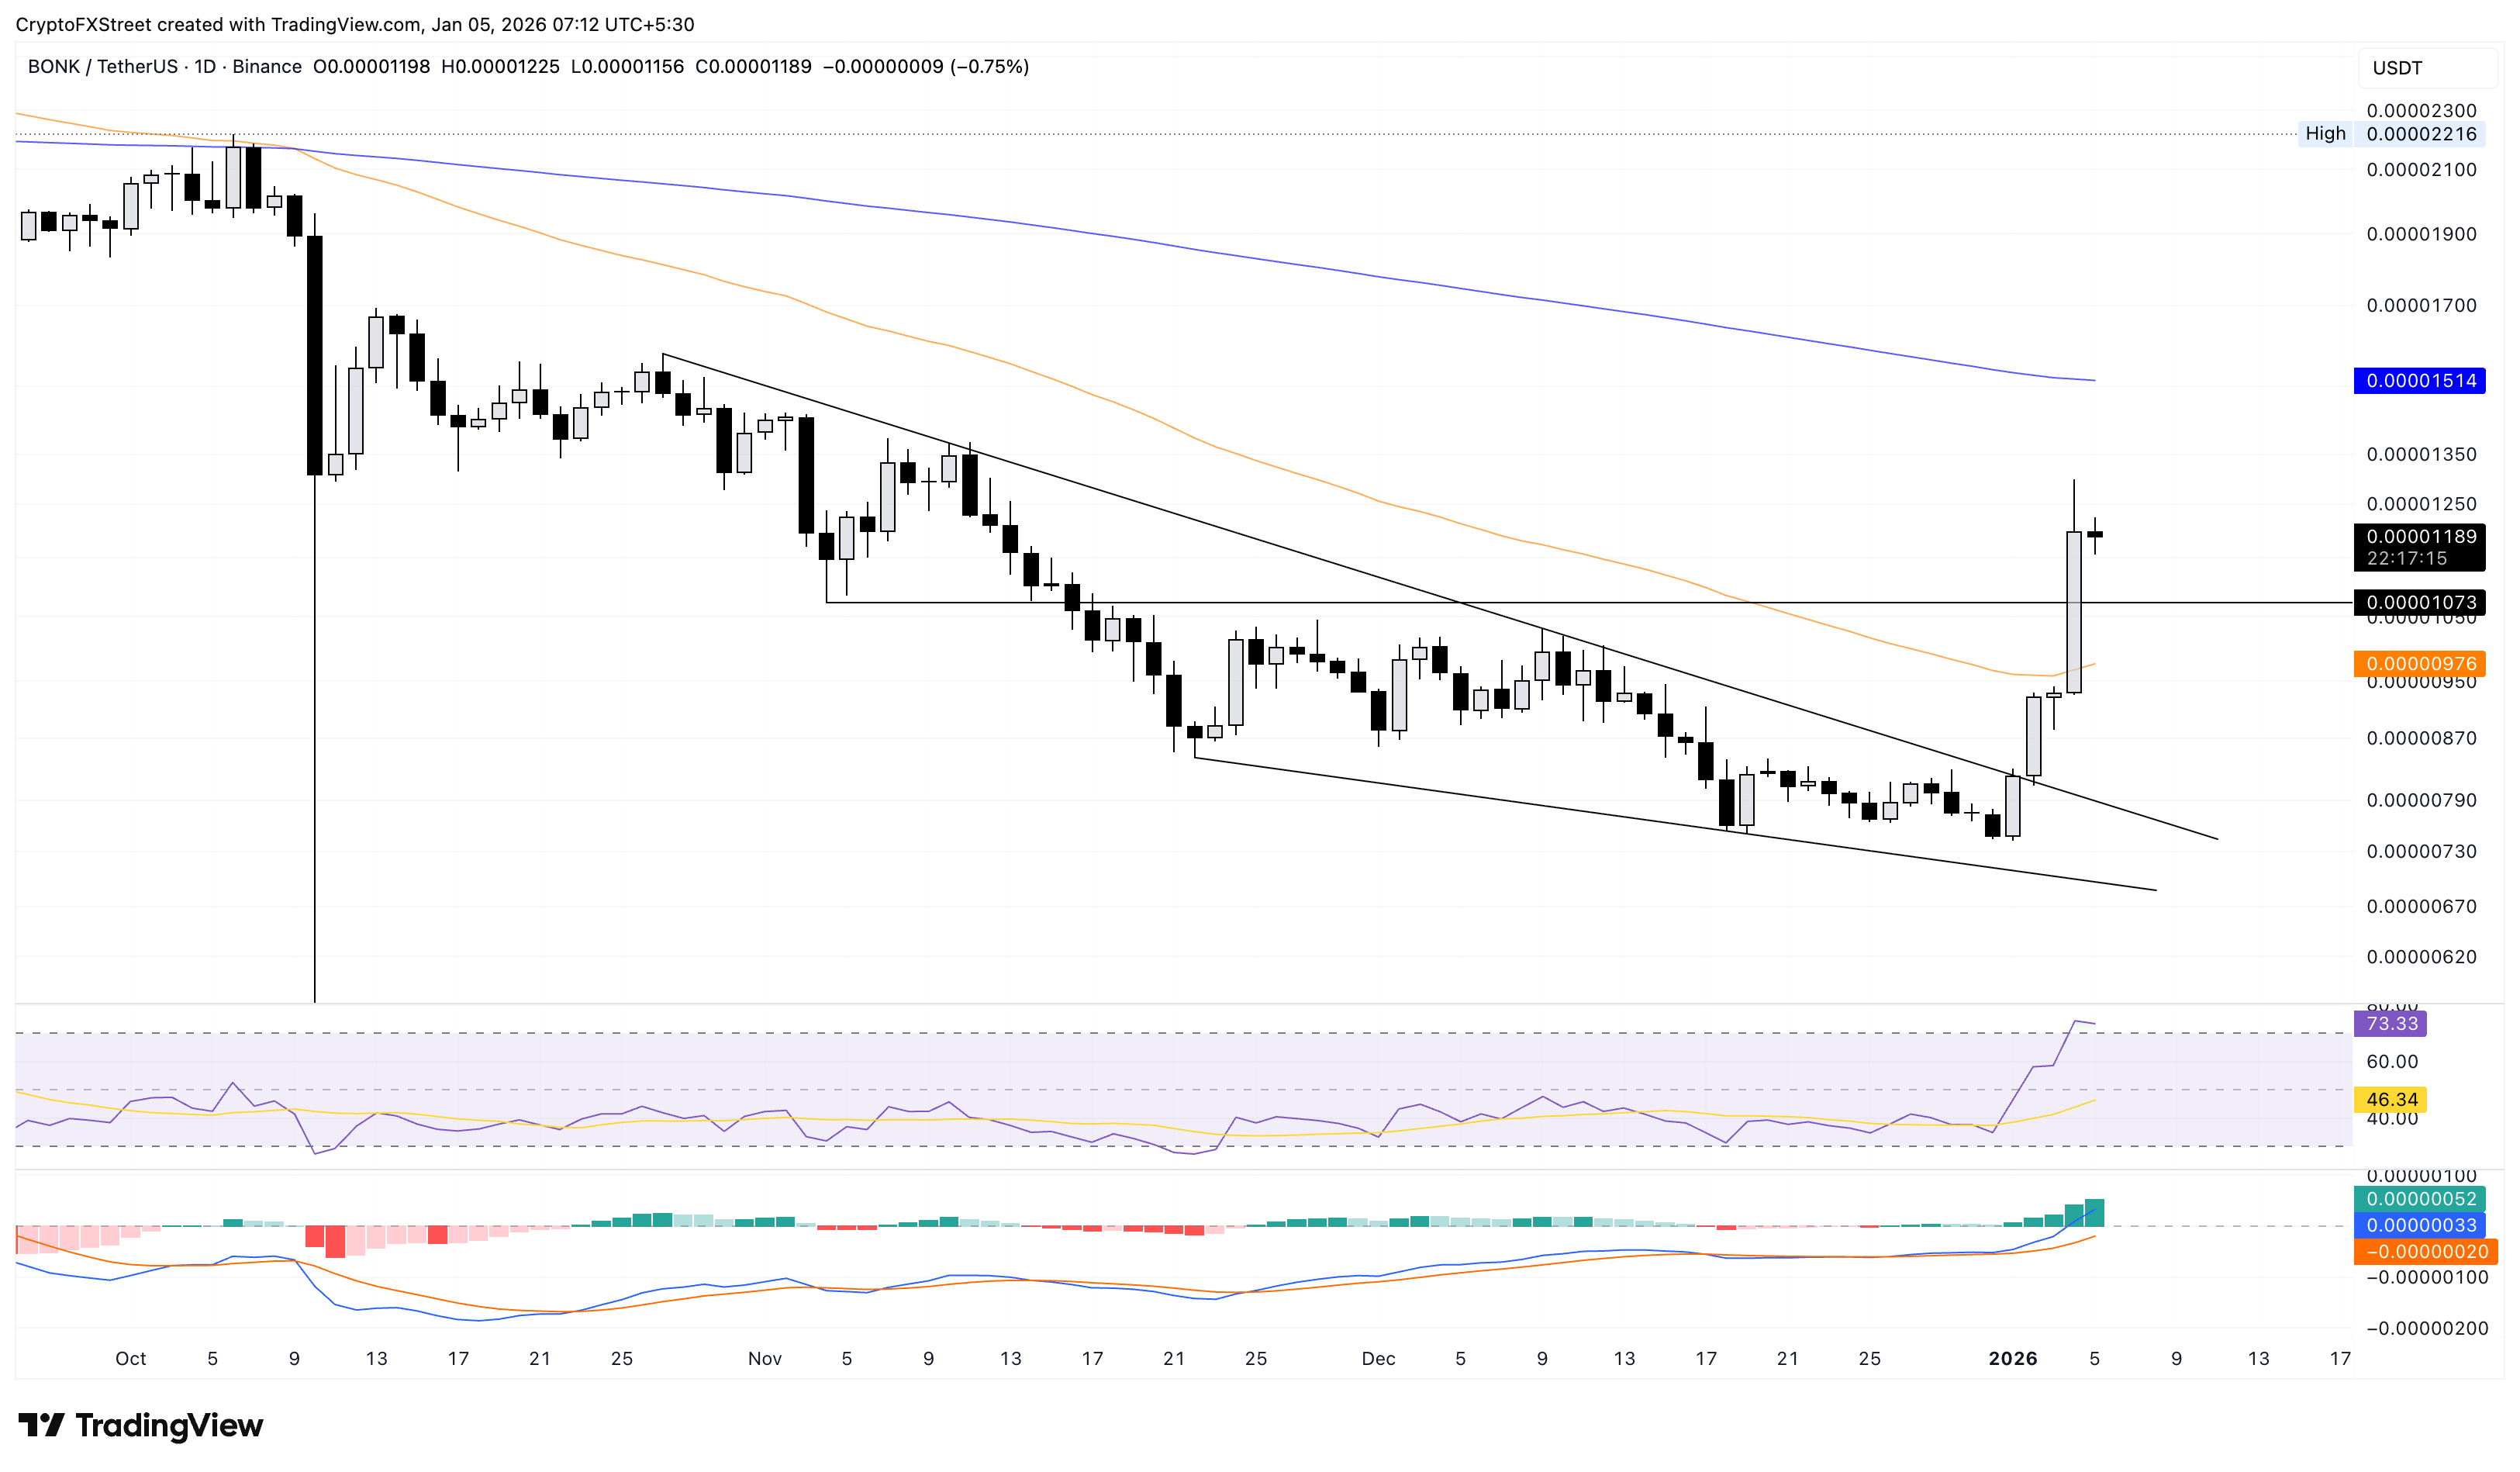
Looking down, BONK could find support at the $0.0000100 psychological level, followed by the 50-day EMA at $0.00000976.
Dogwifhat’s breakout rally halts at $0.40
Dogwifhat holds steady above $0.40 at press time on Monday following four consecutive days of roughly 50% recovery. The meme coin surged 20% on Sunday, surpassing the 50-day EMA at $0.377 and a resistance trendline connecting the October 13 and 27 highs.
An extension of the recovery run in WIF could target the $0.472 level marked by the October 17 low.
The MACD indicator holds a buy signal triggered after Saturday’s crossover, and the RSI at 61 indicates a rise in buying pressure, with further upside room before reaching overbought conditions.
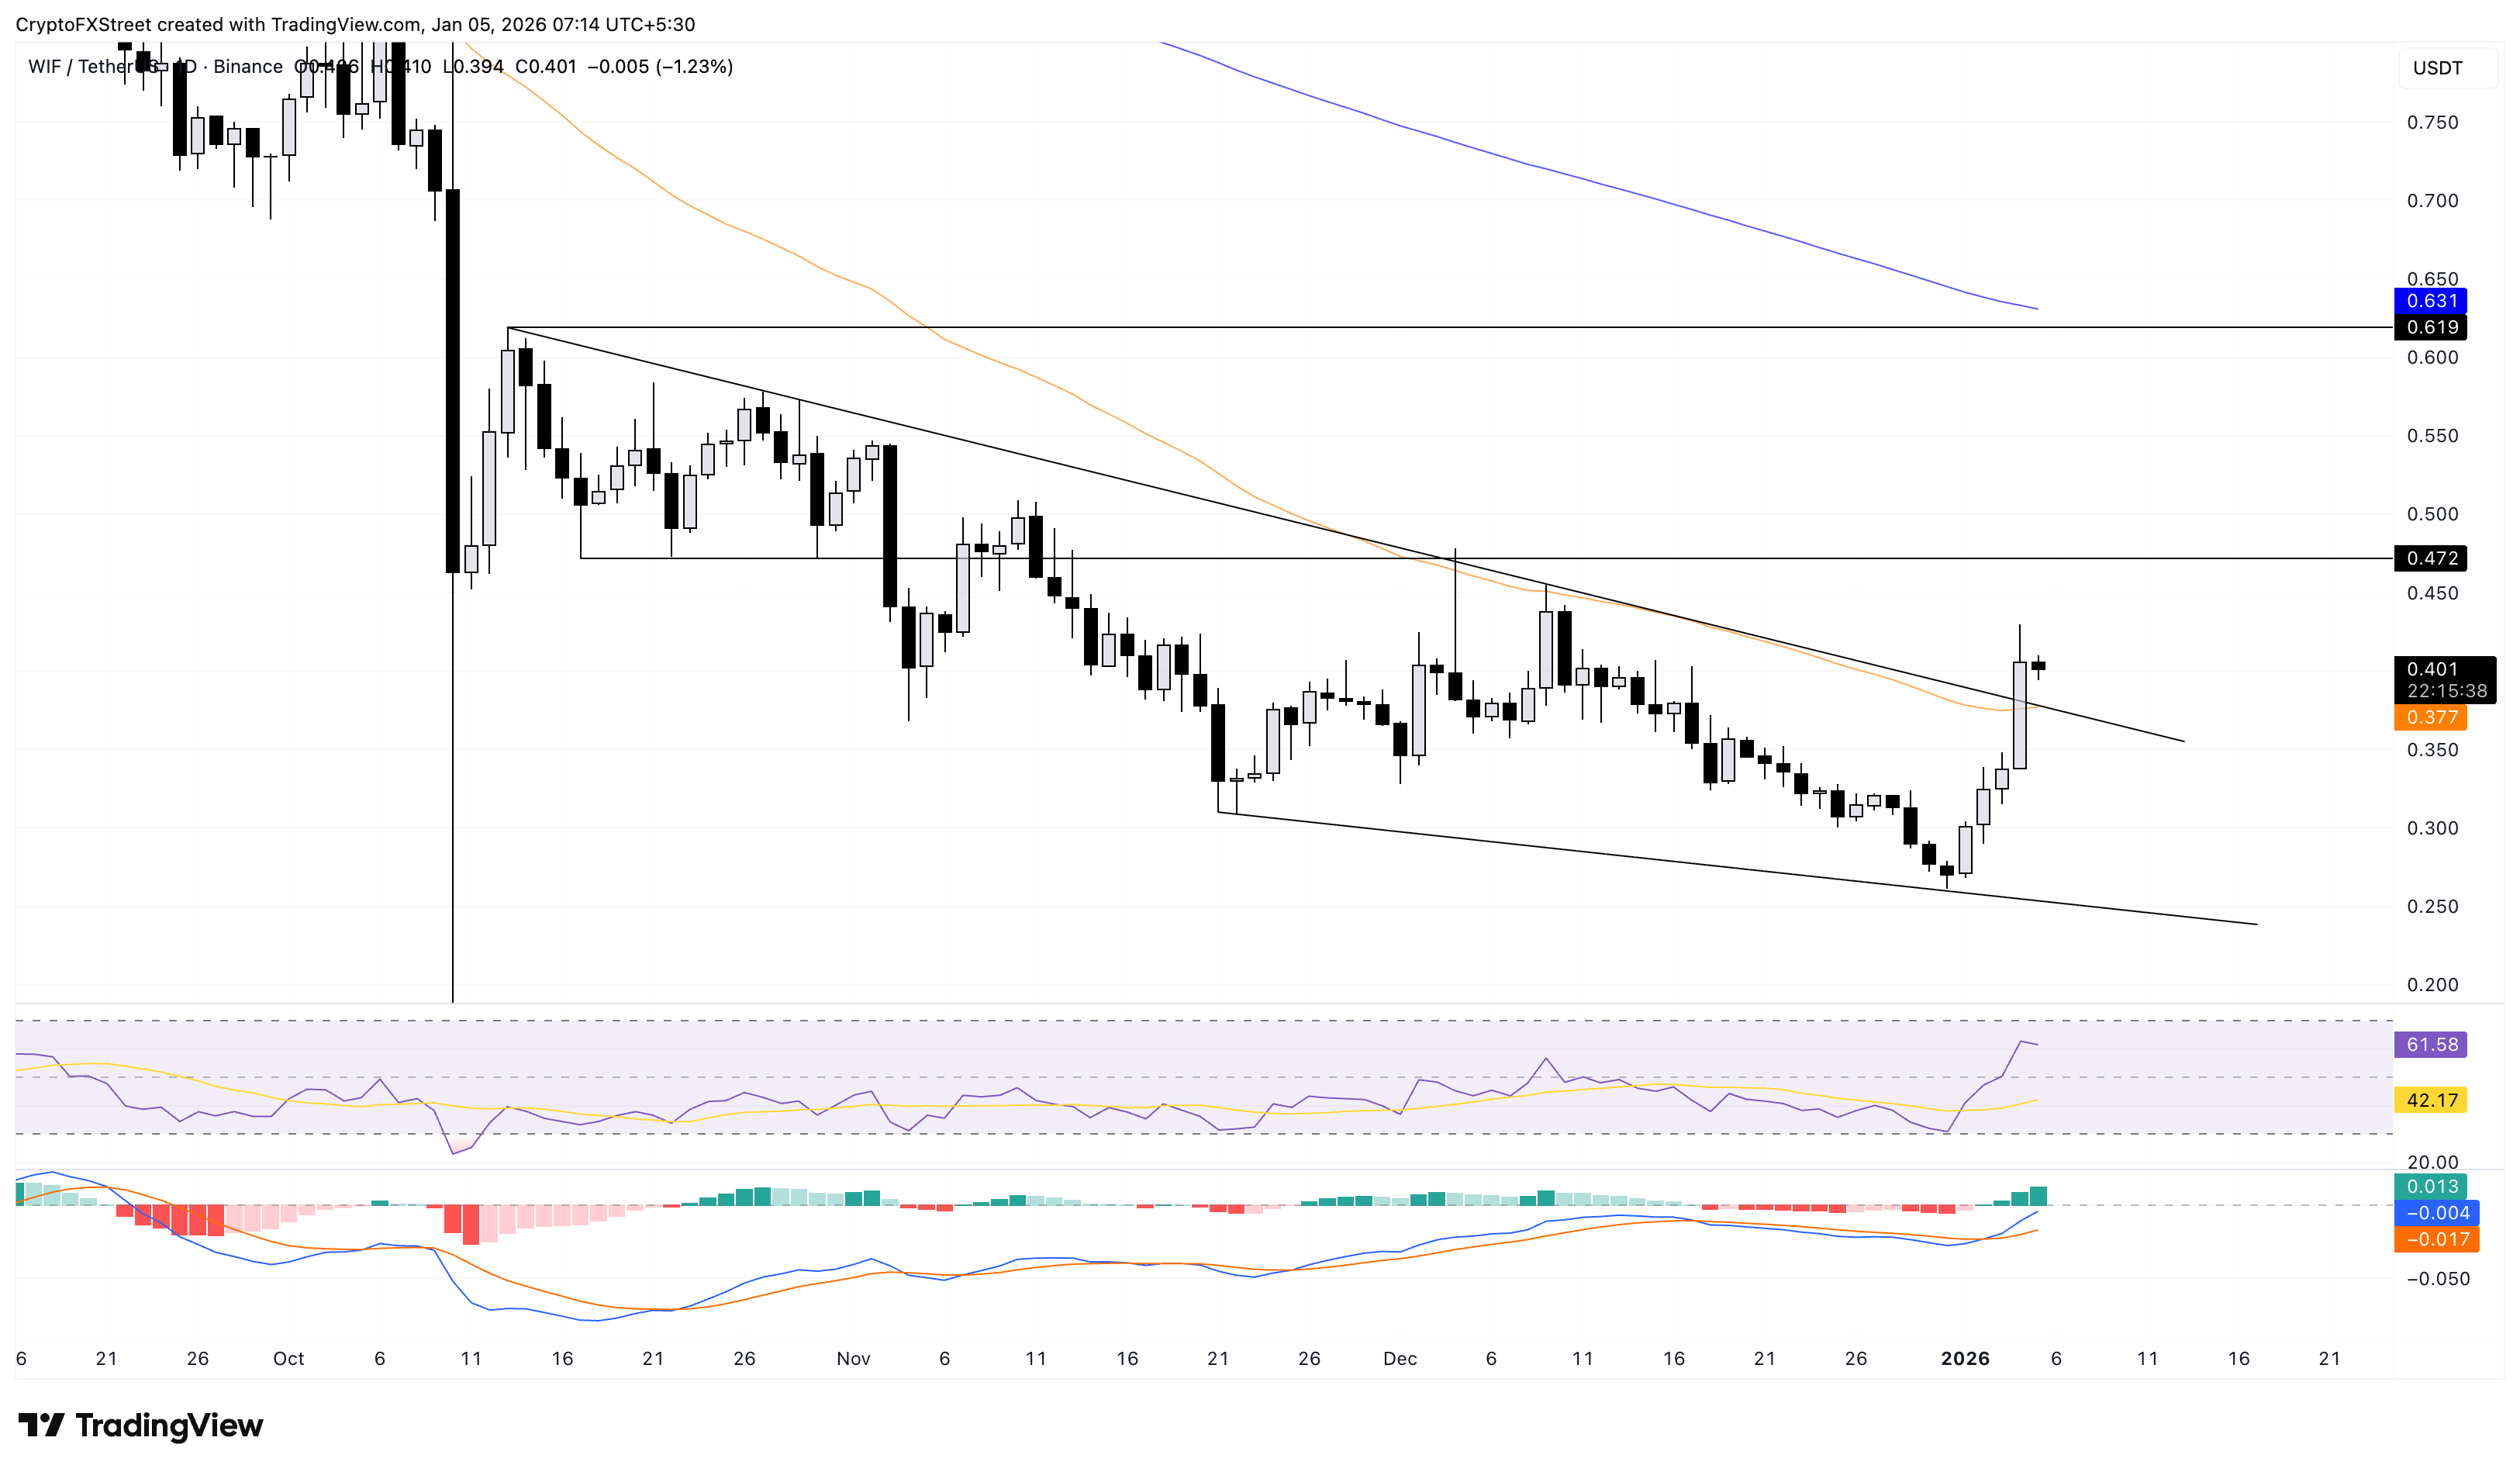
On the downside, a potential slip below the 50-day EMA at $0.377 could invalidate the breakout rally, threatening a pullback to the $0.300 round figure.

FXStreet
Hơn một triệu người dùng dựa vào FXStreet để có dữ liệu thị trường thời gian thực, công cụ biểu đồ, góc nhìn chuyên gia và tin tức Forex. Lịch kinh tế toàn diện và các hội thảo web giáo dục giúp nhà giao dịch luôn cập nhật và đưa ra quyết định có tính toán. FXStreet có khoảng 60 nhân sự, chia giữa trụ sở Barcelona và nhiều khu vực toàn cầu.
Read More


