
Top Crypto Gainers: Midnight, Tezos, and Quant – Short-term recovery at risk
Bởi Vishal Dixit
Ngày xuất bản: 20 Jan 2026 | Ngày chỉnh sửa: 20 Jan 2026


BÀI VIẾT PHỔ BIẾN

Altcoins, including Midnight (NIGHT), Tezos (XTZ), and Quant (QNT), outpace the broader cryptocurrency market in 24-hour gains at the time of writing on Tuesday. Monday’s rebounds in NIGHT, XTZ, and QNT face headwinds near crucial moving averages, capping the gains.
- Midnight faces opposition at the 4-hour 50-period EMA near $0.64 on Tuesday after a 10% rebound on Monday.
- Tezos struggles at the 200-day EMA near $0.60 following a 5% recovery on the previous day.
- Quant resonates between the 50-day and 200-day EMAs as bullish momentum builds.
Altcoins, including Midnight (NIGHT), Tezos (XTZ), and Quant (QNT), outpace the broader cryptocurrency market in 24-hour gains at the time of writing on Tuesday. Monday’s rebounds in NIGHT, XTZ, and QNT face headwinds near crucial moving averages, capping the gains. Technically, the altcoins could reverse under strong headwinds as the broader cryptocurrency market remains under selling pressure.
Midnight breakout rally stuck at the 50-period EMA
Midnight trades above $0.0600 at press time on Tuesday, following a 10% recovery the previous day. Cardano’s privacy-focused token’s rebound broke out of a falling channel pattern on the 4-hour chart but struggles to exceed the 50-period Exponential Moving Average (EMA) at $0.064566. The moving average is sloping downward, which has capped gains twice earlier this week.
The Moving Average Convergence Divergence (MACD) indicator on the 4-hour chart crosses above the signal line in the negative territory, rising toward the zero line, and widening histograms above zero suggest easing overhead pressure.
The Relative Strength Index (RSI) on the same chart pulls back to the midline, reflecting a short-lived buying spike returning to the neutral zone.
If NIGHT slips below the 20-period EMA at $0.06132, it would nullify the channel breakout. This would open the door to further downside, targeting the S1 Pivot Point at $0.05106.
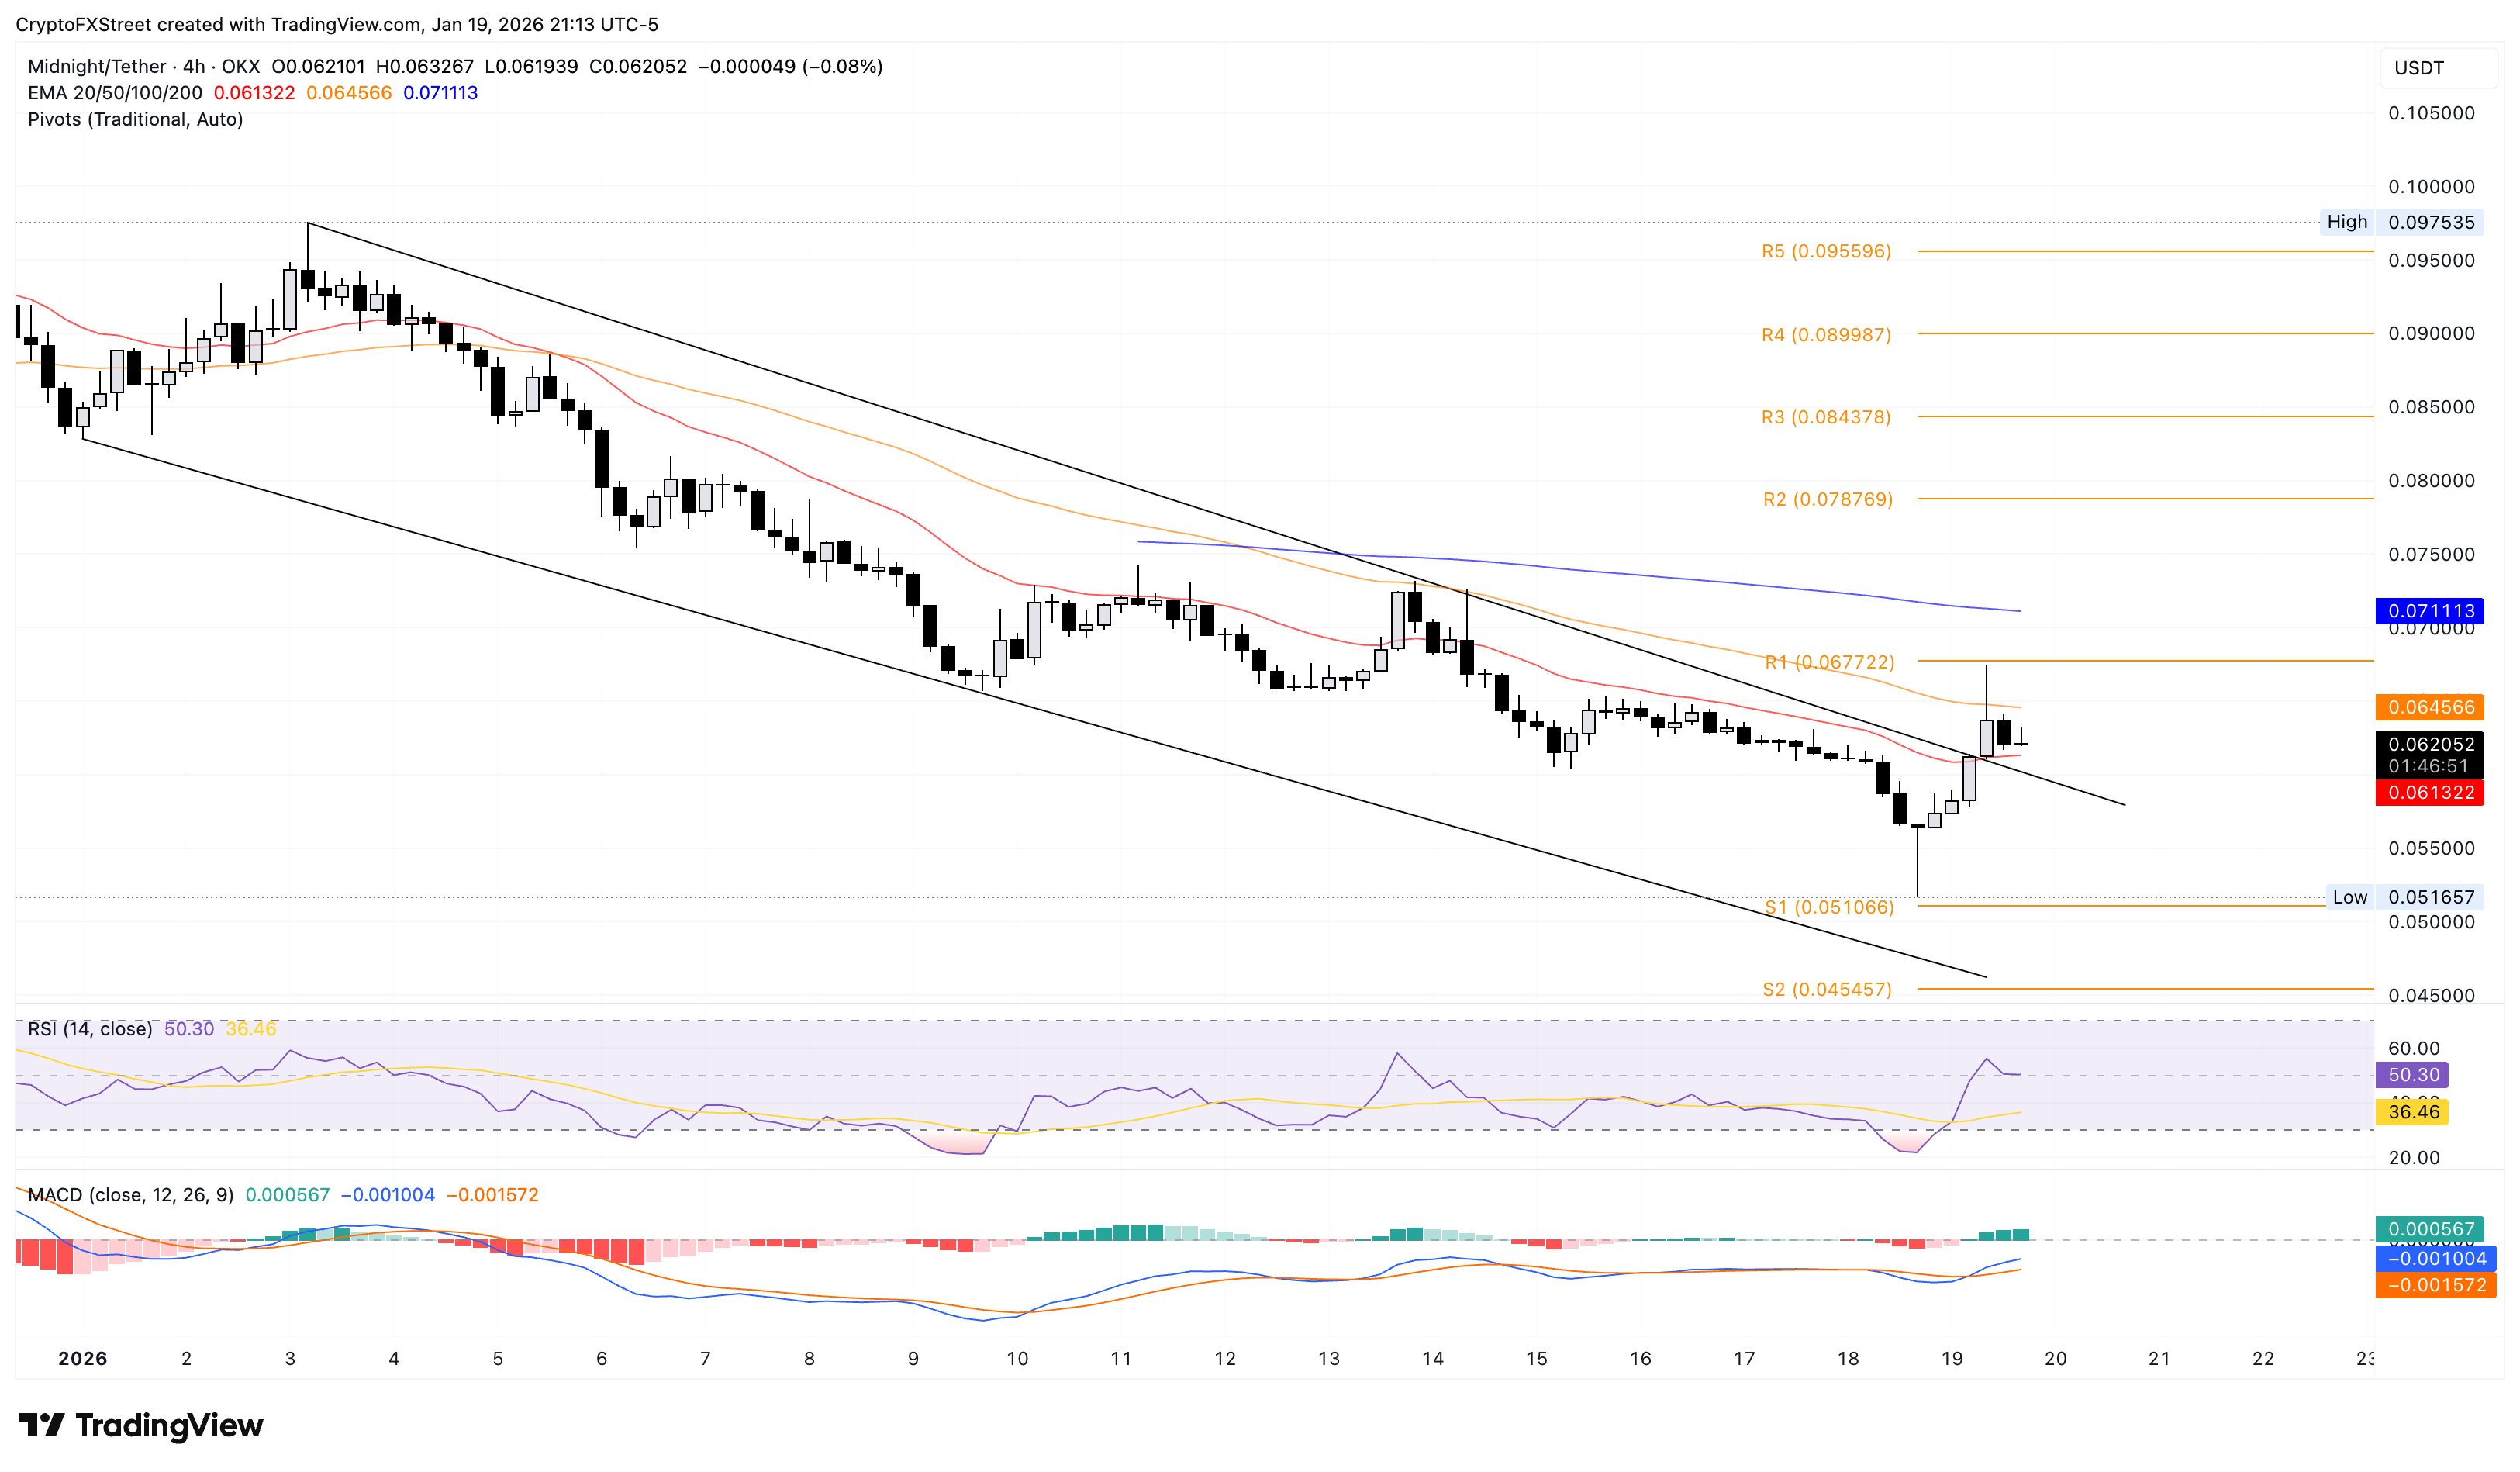
On the upside, if NIGHT clears the 50-period EMA, the R1 Pivot Point at $0.06772 and the 200-period EMA at $0.07113 would serve as overhead resistance levels.
Tezos flashes downside risk as bullish momentum fades
Tezos is down 2% at the time of writing on Tuesday, losing ground after Monday's 5% surge. The privacy coin faces headwinds from the 200-day EMA at $0.6081, capping recovery attempts. The 20-day and 50-day EMAs are trending upward, suggesting a short- and medium-term recovery.
A decisive close above this level could extend the XTZ rally toward the R2 Pivot Point at $0.6618.
The MACD converges with the red line on the daily chart as the histogram contracts, suggesting reduced bullish momentum. A potential crossover leading to a negative histogram would indicate a bearish shift in momentum.
The RSI is at 58 on the same timeframe, retracing toward midline from the overbought zone as buying pressure softens.
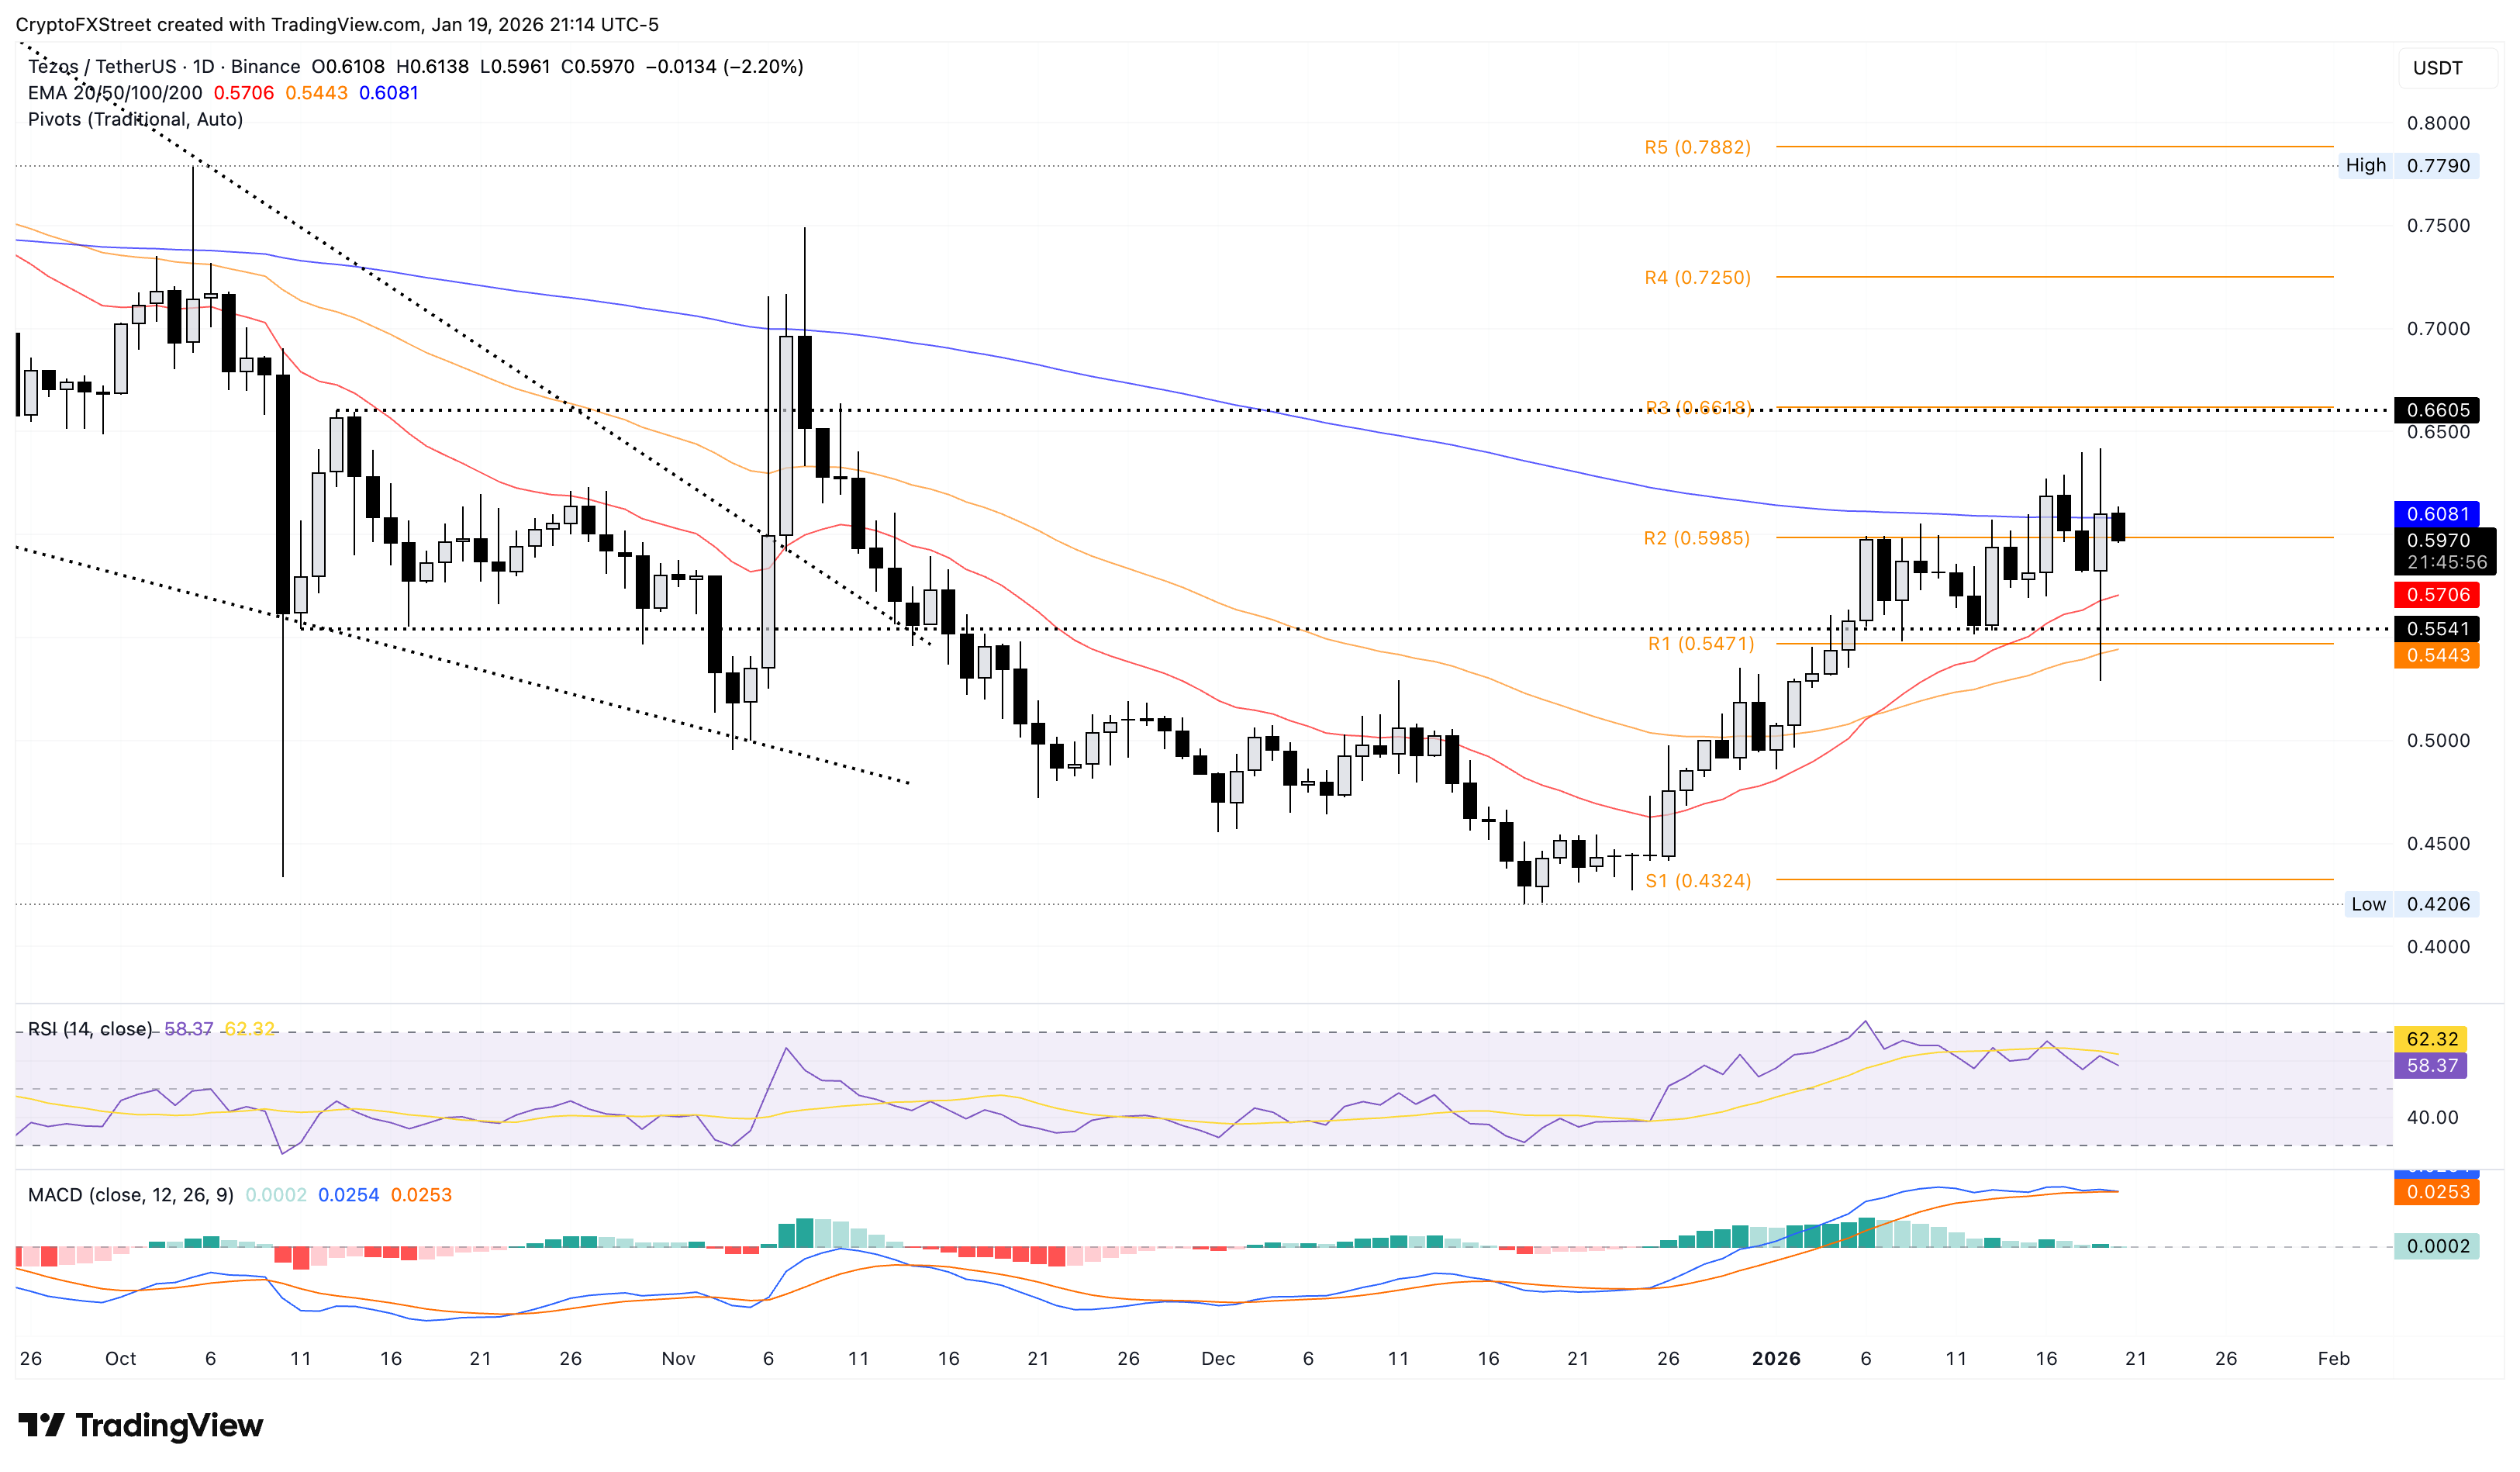
An extended pullback in XTZ could test the 20-day EMA at $0.5706 with a deeper support at the R1 Pivot Point at $0.5471.
Quant’s recovery faces headwinds at the 200-day EMA
Quant resonates between the 50-day and 200-day EMAs roughly between $78 and $87. At the time of writing, QNT is trading above $82 on Tuesday, holding the 4% gains from Monday. However, the long-wick candles so far this week suggest intense overhead selling pressure.
If QNT fails to hold above the 50-day EMA at $87, it could further decline to the November 4 low at $68.
The MACD and signal line on the daily chart are rising above the zero line with widening histograms, indicating that bullish momentum is mounting. The RSI at 57 on the same chart maintains a broadly upward trend above the halfway line, suggesting increased buying pressure.
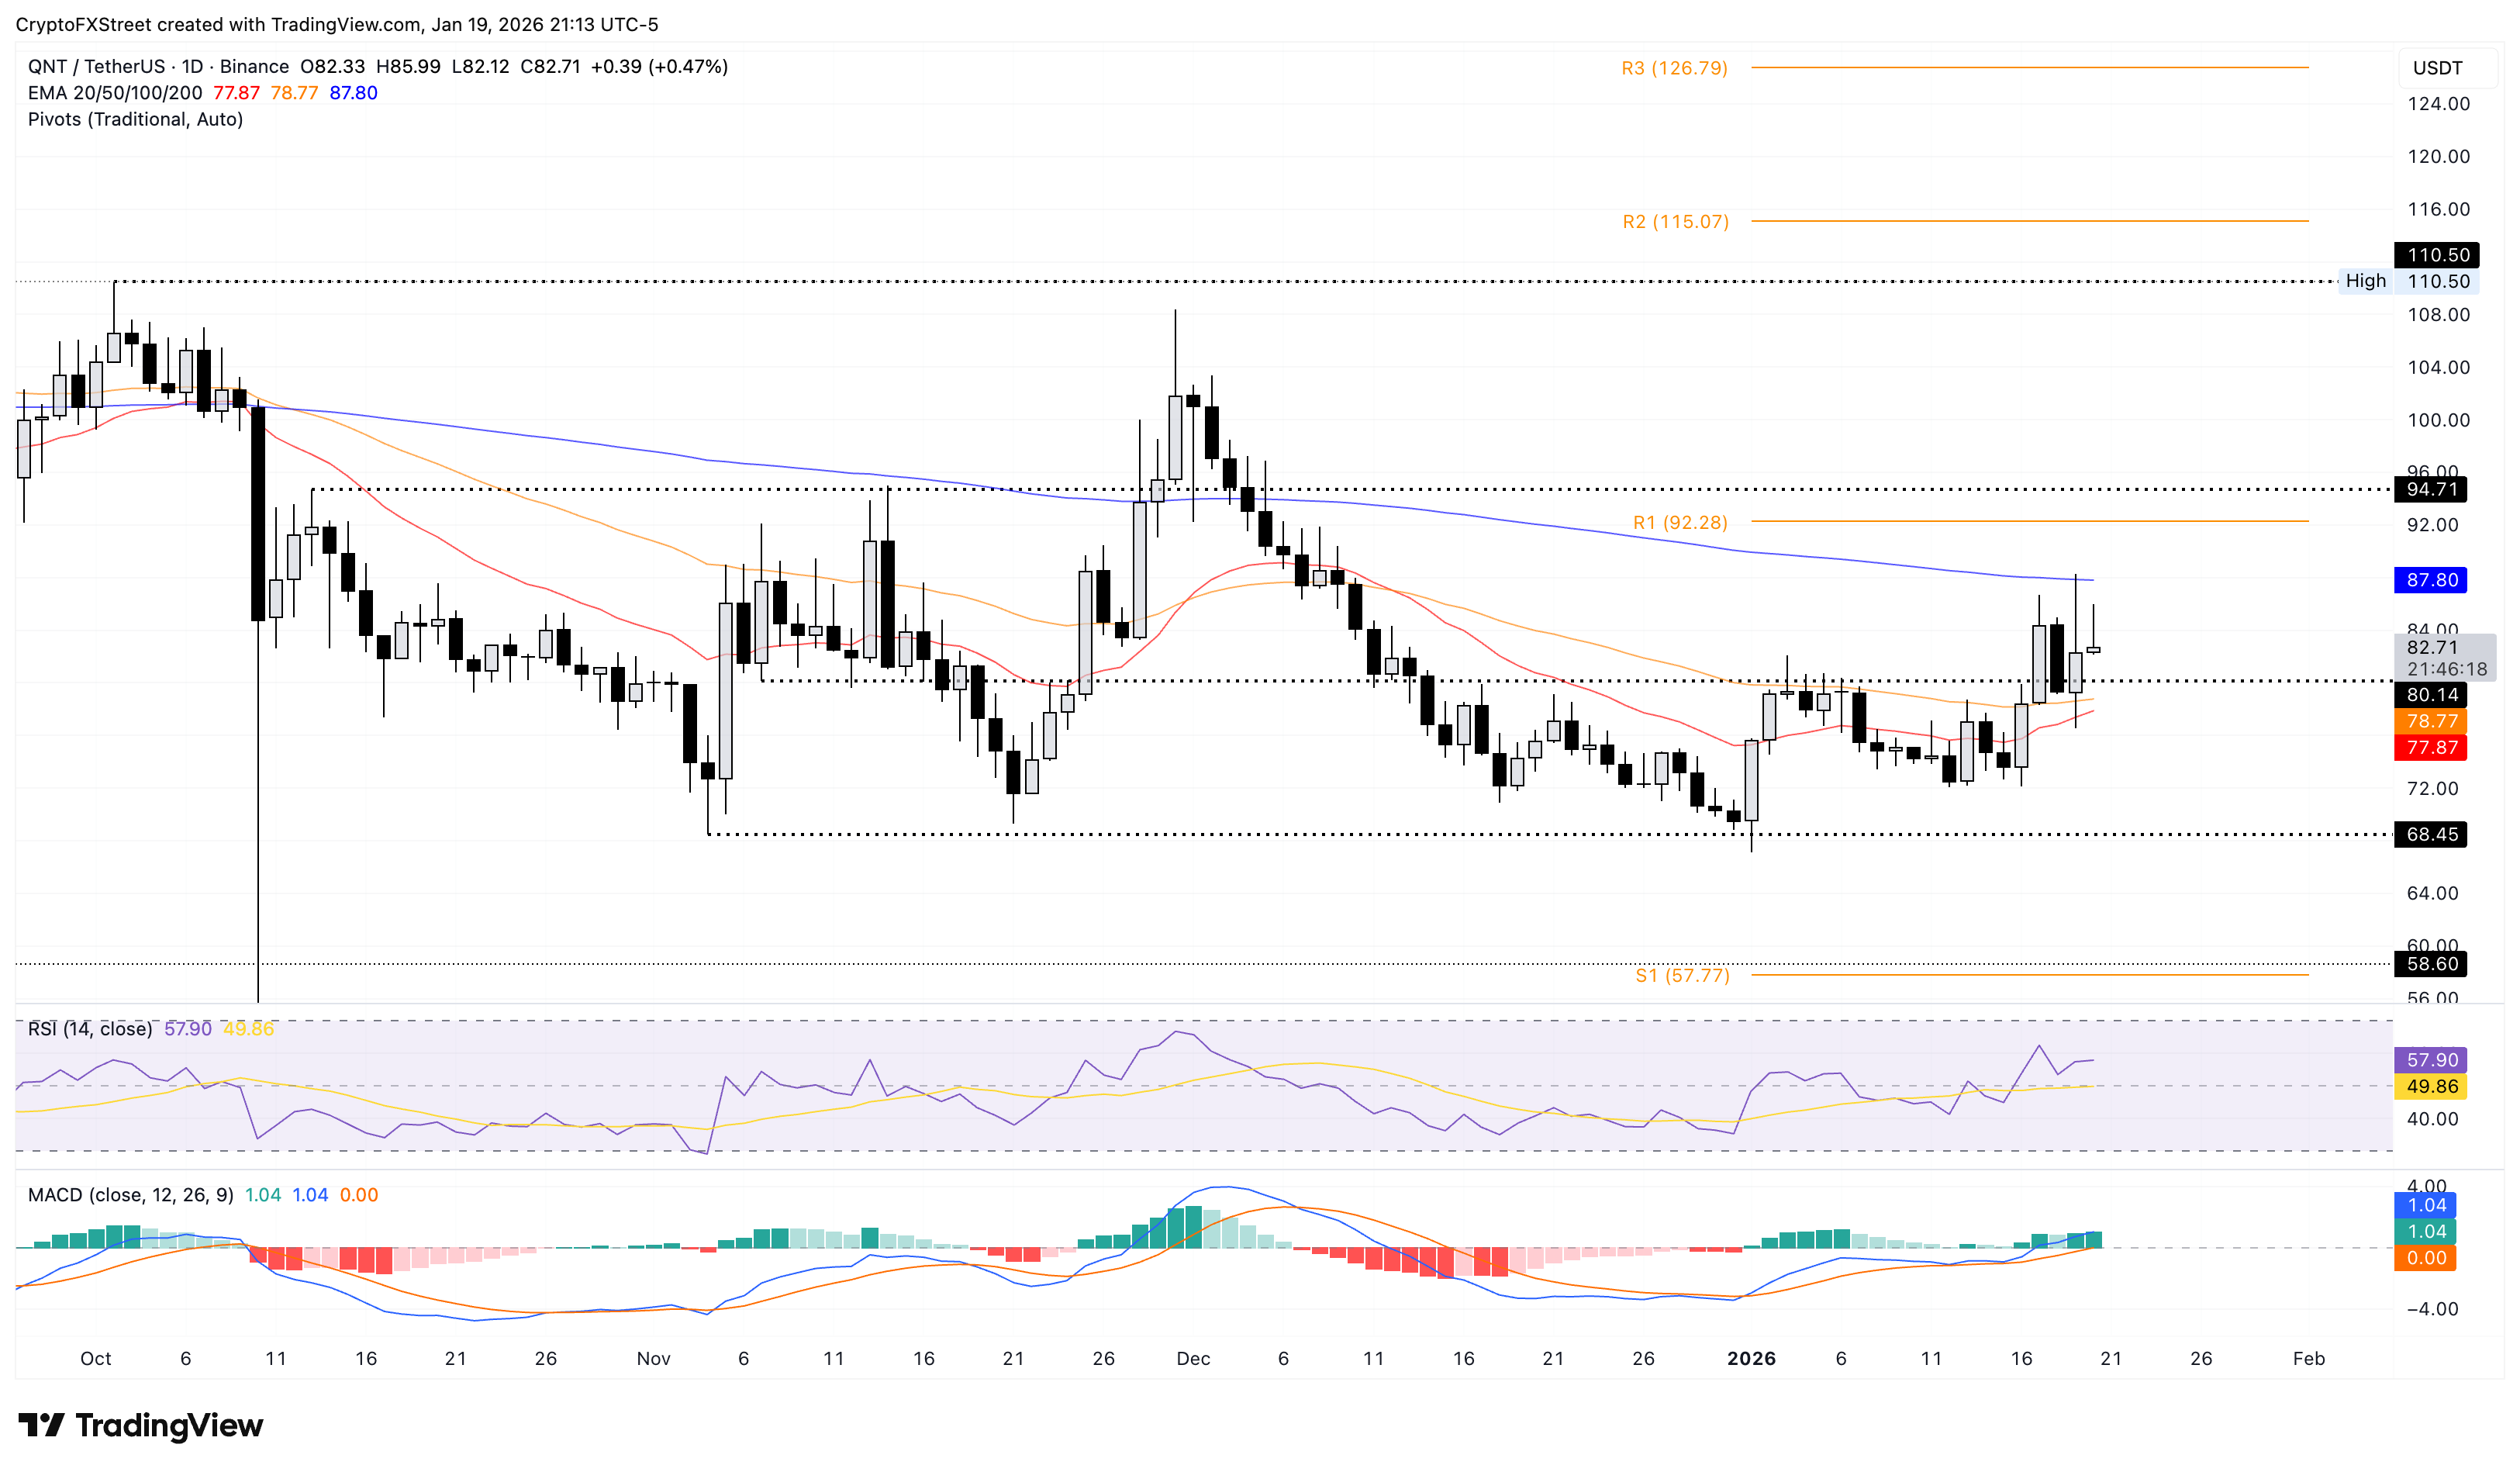
If QNT exceeds the 200-day EMA at $87, it could target the R1 Pivot Point at $92.

Hơn một triệu người dùng dựa vào FXStreet để có dữ liệu thị trường thời gian thực, công cụ biểu đồ, góc nhìn chuyên gia và tin tức Forex. Lịch kinh tế toàn diện và các hội thảo web giáo dục giúp nhà giao dịch luôn cập nhật và đưa ra quyết định có tính toán. FXStreet có khoảng 60 nhân sự, chia giữa trụ sở Barcelona và nhiều khu vực toàn cầu.
Đọc thêm


