
Trade The World
Uniswap Price Forecast: UNI eyes upside as bulls defend key support
Bởi Manish Chhetri
Ngày xuất bản: 17 Nov 2025 | Ngày chỉnh sửa: 17 Nov 2025


POPULAR ARTICLES

Uniswap (UNI) is showing early signs of recovery, with price action holding firmly above the $7.06 support level. Strengthening on-chain and derivatives data—including heightened whale activity and a rise in bullish positioning—suggest a favorable environment for upside continuation.
- Uniswap price finds support around $7.06, forming a solid base after recent market volatility.
- On-chain and derivatives data support the upside, including whale activity, buy dominance, and rising bullish bets.
- The technical outlook signals more gains ahead, with UNI bulls targeting the $8.63 resistance level as momentum builds.
Uniswap (UNI) is showing early signs of recovery, with price action holding firmly above the $7.06 support level. Strengthening on-chain and derivatives data—including heightened whale activity and a rise in bullish positioning—suggest a favorable environment for upside continuation. On the technical side, it also suggests further upside, with UNI bulls targeting $8.63.
Uniswap’s on-chain and derivatives data show bullish bias
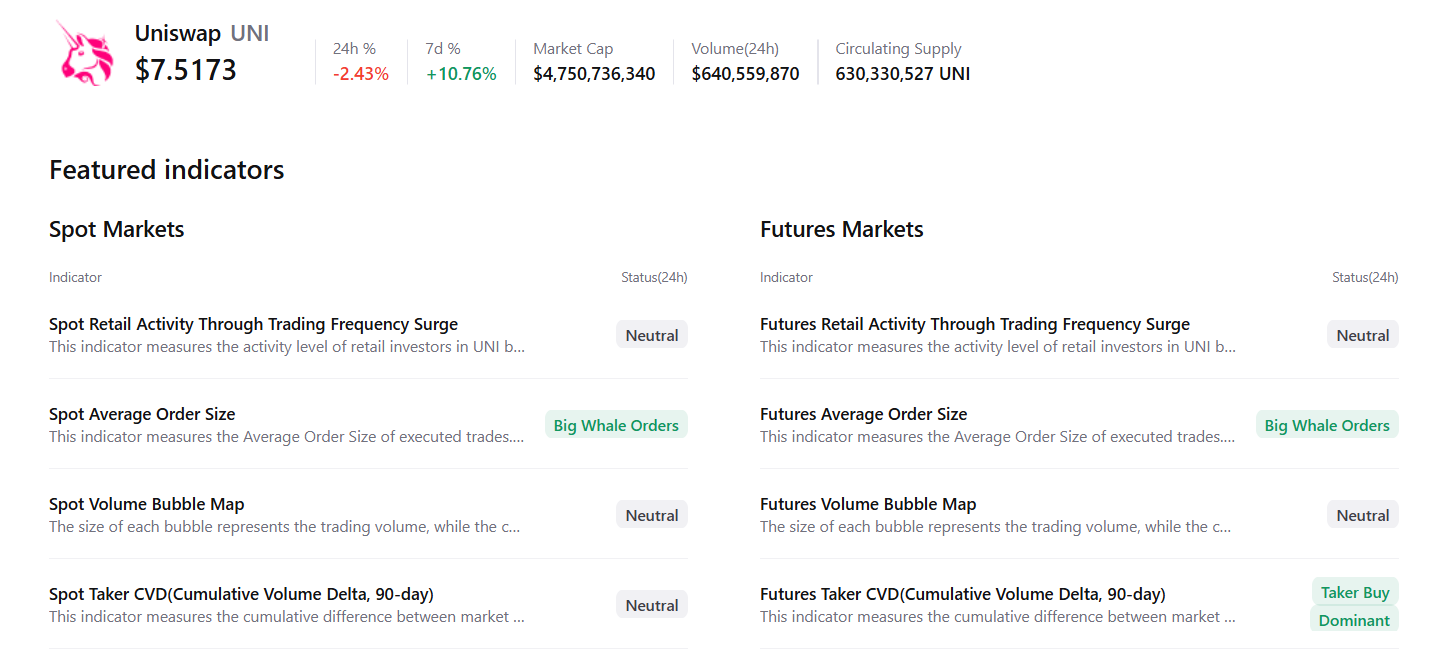
CryptoQuant summary data supports a positive outlook for UNI as both spot and futures markets show large whale orders and buy dominance, signaling a potential rally ahead.
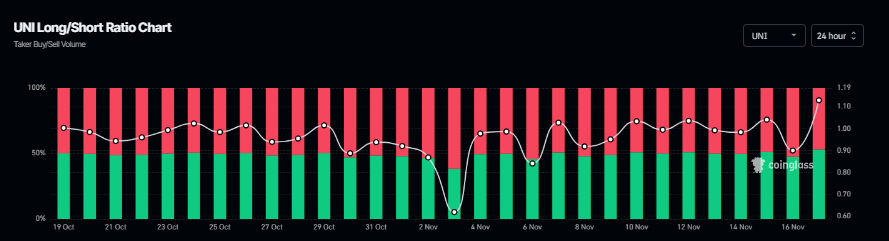
The derivatives data also support a bullish bias. Coinglass’s long-to-short ratio for long-to-short reads is 1.12, the highest level over a month. The ratio above one suggests that more traders are betting on Uniswap’s price to rally.
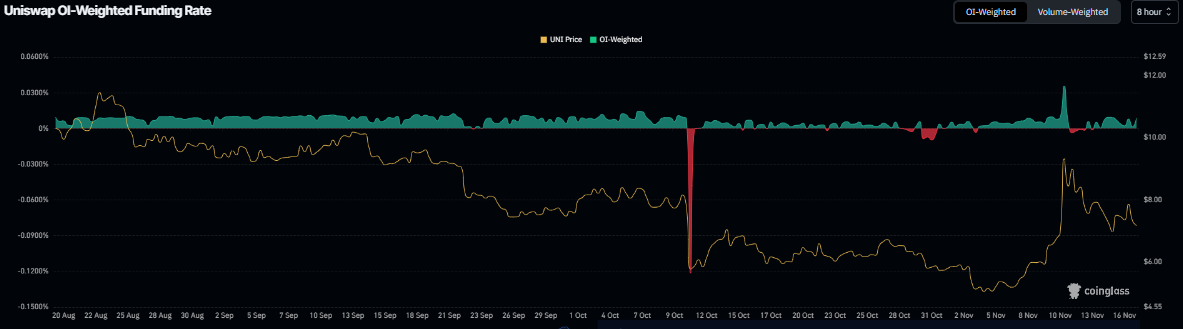
Coinglass’s OI-Weighted Funding Rate data shows that the number of traders betting that the price of UNI will slide further is lower than those anticipating a price increase.
The metric has flipped to a positive rate and stands at 0.0087% on Monday, suggesting that longs are paying shorts, suggesting bullish sentiment toward UNI.
Uniswap Price Forecast: UNI finds support around a key level
Uniswap price corrected after retesting the 78.6% Fibonacci retracement at $10.07 (drawn from the August high around $12.30 to the October low near $2) last week on Tuesday and 25% until Friday. UNI found support after retesting its 50-day EMA at $7.06 and held above it over the weekend. At the time of writing on Monday, UNI trades slightly above $7.52.
If the 50-day EMA at $7.06 holds, it could extend the rally toward the daily resistance at $8.63.
The Relative Strength Index (RSI) on the daily chart reads 55, above its neutral level of 50, indicating bullish momentum gaining traction. The Moving Average Convergence Divergence (MACD) showed a bullish crossover last week, which remains intact, suggesting the continuation of an upward trend.
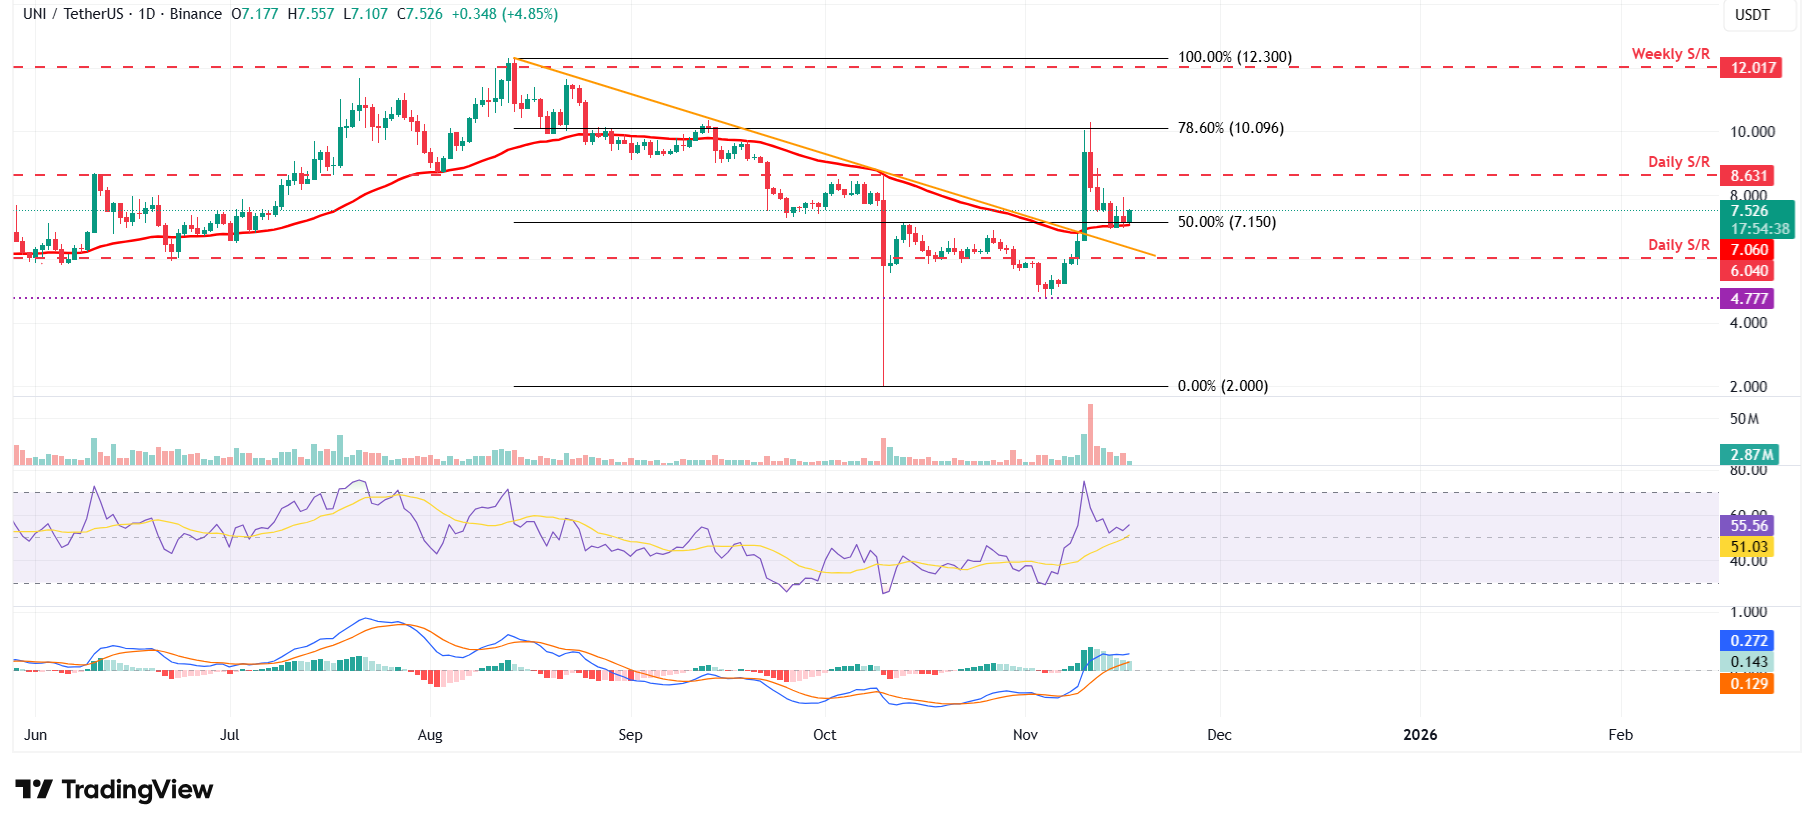
On the other hand, if UNI closes below $7.06, it could extend the decline toward the daily support at $6.04.

FXStreet
Hơn một triệu người dùng dựa vào FXStreet để có dữ liệu thị trường thời gian thực, công cụ biểu đồ, góc nhìn chuyên gia và tin tức Forex. Lịch kinh tế toàn diện và các hội thảo web giáo dục giúp nhà giao dịch luôn cập nhật và đưa ra quyết định có tính toán. FXStreet có khoảng 60 nhân sự, chia giữa trụ sở Barcelona và nhiều khu vực toàn cầu.
Read More


