
Trade The World
US Dollar Index (DXY) approaches a key resistance area above 98.65
Bởi Guillermo Alcala
Ngày xuất bản: 3 Sep 2025 | Ngày chỉnh sửa: 3 Sep 2025


POPULAR ARTICLES

The Dollar is moving higher for the second consecutive day on Wednesday, but USD bulls are showing signs of hesitation –the large wicks in the 4-hour candle– as price action approaches a cluster of resistances between 98.65 and 98.85.The fundamental background remains favourable, with investors wary
- The US Dollar Index found resistance at the top of the monthly channel, at 98.65.
- A cautious market mood keeps supporting the USD, but bullish momentum has eased.
- US data, due later today, might increase bearish pressure on the Greenback.
The Dollar is moving higher for the second consecutive day on Wednesday, but USD bulls are showing signs of hesitation –the large wicks in the 4-hour candle– as price action approaches a cluster of resistances between 98.65 and 98.85.
The fundamental background remains favourable, with investors wary of risk amid a global sell-off in government bonds. Nevertheless, US data due later today is likely to show further evidence that the US economy is losing, which might shift the focus back to the Fed and dent the US Dollar’s rally.
Technical Analysis: Testing trendline resistance at 98.65
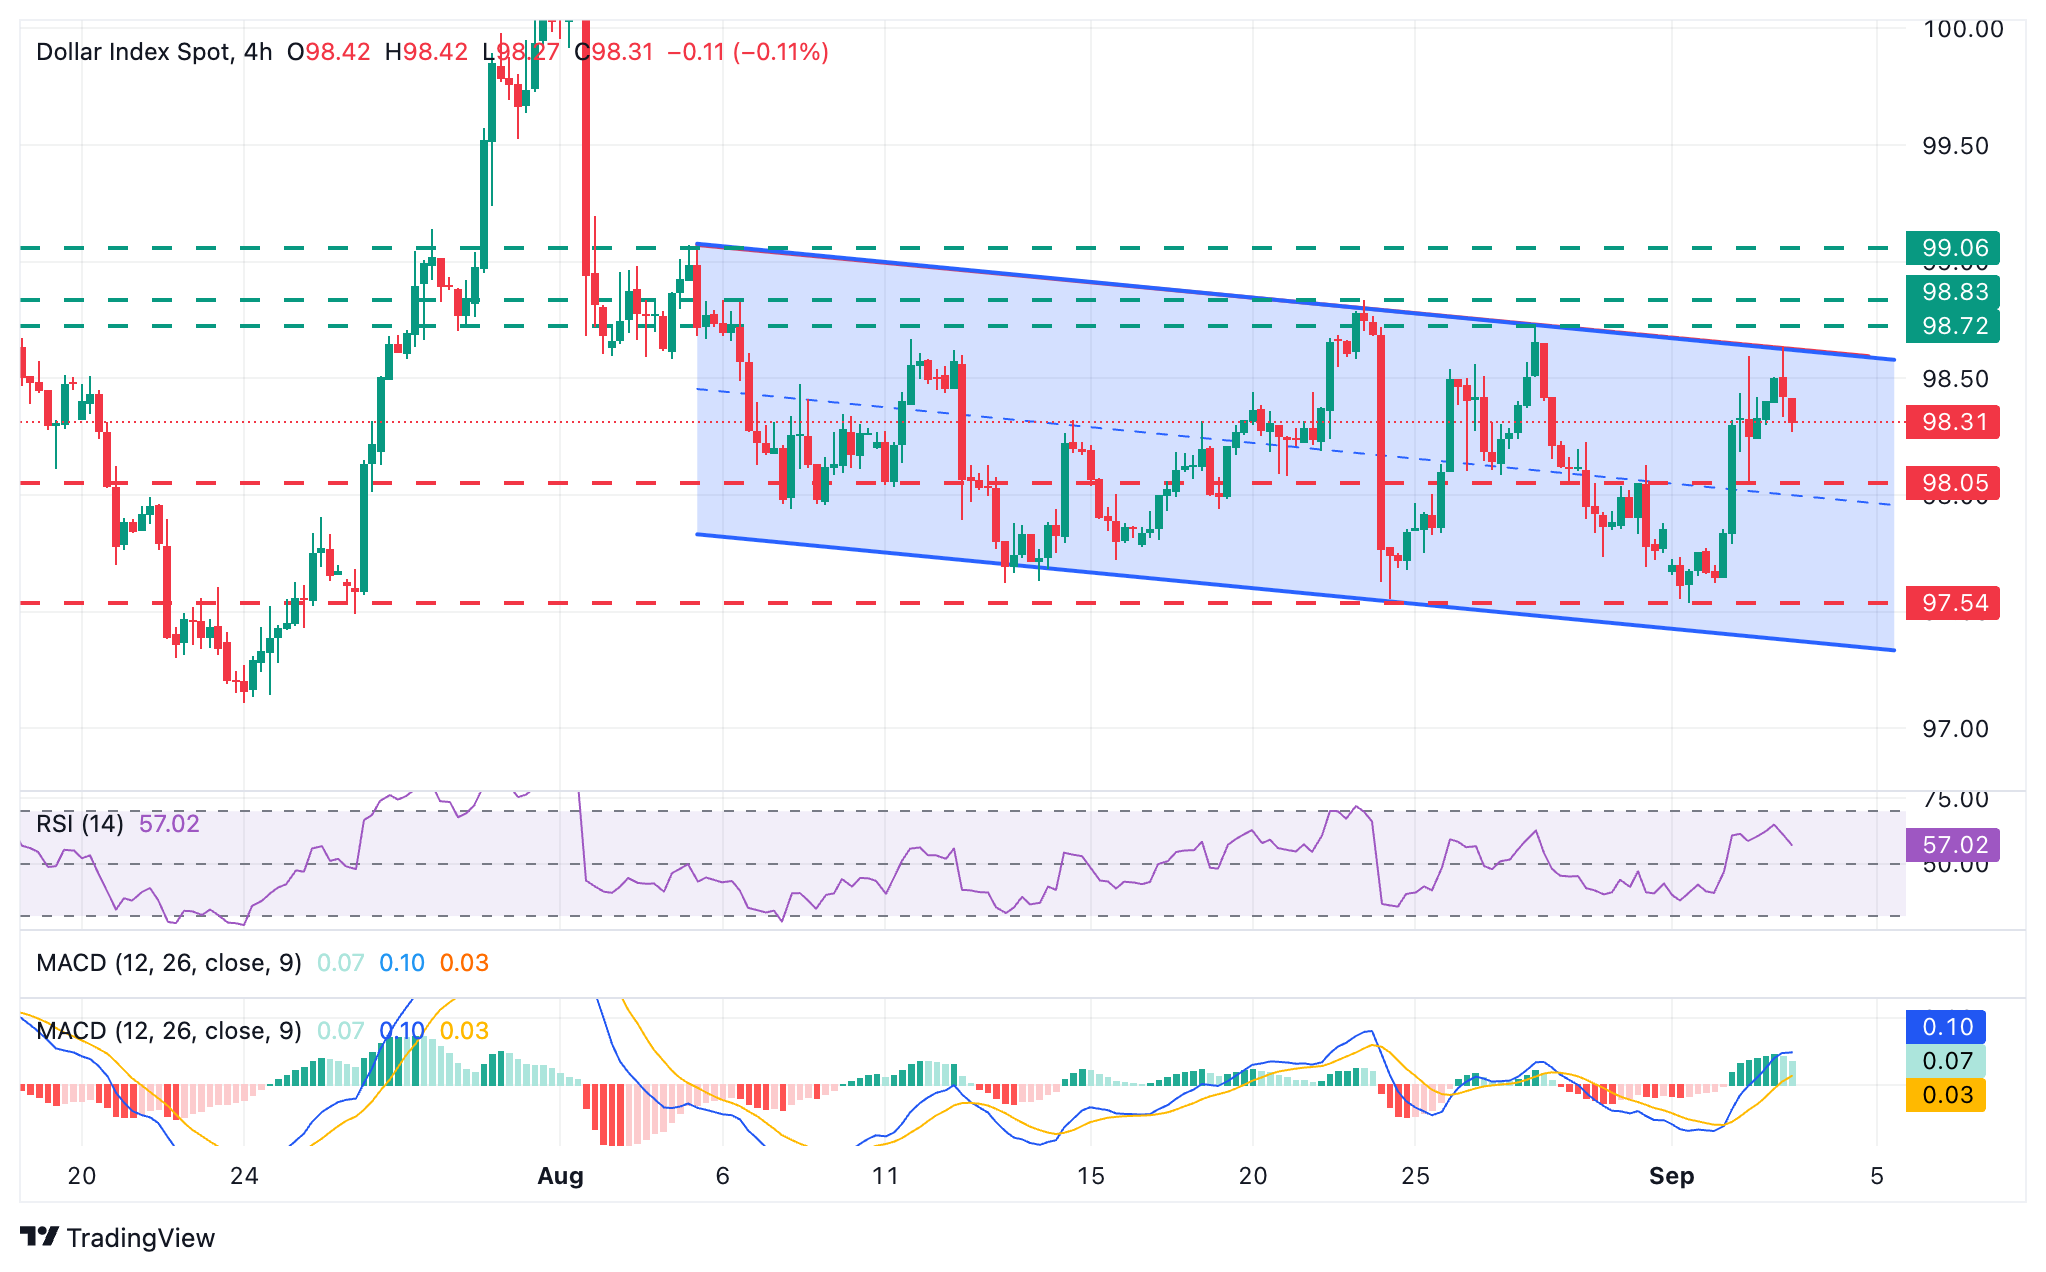
The US Dollar has reached the top of the descending channel that contained price action during the last month, at 98.60, which has resisted the first attempt. Above here, the August 27 and 21 highs, at 98.75 and 98.85, respectively, are likely to offer some resistance ahead of the August 5 high, at 99.10.
The 4-hour Relative Strength Index (RSI) is turning lower, although still within bullish territory. The MACD shows a dwindling bullish momentum. A deeper reversal from current levels is likely to find support at the intraday level of 98.05.
Further down, the August 22 and September 1 lows, at 97.55, are likely to be tested before the trendline support, now at the 97.35 area.
US Dollar Price Today
The table below shows the percentage change of US Dollar (USD) against listed major currencies today. US Dollar was the strongest against the Japanese Yen.
| USD | EUR | GBP | JPY | CAD | AUD | NZD | CHF | |
|---|---|---|---|---|---|---|---|---|
| USD | -0.09% | 0.05% | 0.21% | 0.10% | -0.07% | 0.05% | 0.00% | |
| EUR | 0.09% | 0.15% | 0.31% | 0.18% | -0.11% | 0.14% | 0.09% | |
| GBP | -0.05% | -0.15% | 0.14% | 0.05% | -0.25% | -0.00% | -0.05% | |
| JPY | -0.21% | -0.31% | -0.14% | -0.13% | -0.38% | -0.25% | -0.19% | |
| CAD | -0.10% | -0.18% | -0.05% | 0.13% | -0.25% | -0.05% | -0.09% | |
| AUD | 0.07% | 0.11% | 0.25% | 0.38% | 0.25% | 0.08% | 0.21% | |
| NZD | -0.05% | -0.14% | 0.00% | 0.25% | 0.05% | -0.08% | -0.04% | |
| CHF | -0.01% | -0.09% | 0.05% | 0.19% | 0.09% | -0.21% | 0.04% |
The heat map shows percentage changes of major currencies against each other. The base currency is picked from the left column, while the quote currency is picked from the top row. For example, if you pick the US Dollar from the left column and move along the horizontal line to the Japanese Yen, the percentage change displayed in the box will represent USD (base)/JPY (quote).

FXStreet
Hơn một triệu người dùng dựa vào FXStreet để có dữ liệu thị trường thời gian thực, công cụ biểu đồ, góc nhìn chuyên gia và tin tức Forex. Lịch kinh tế toàn diện và các hội thảo web giáo dục giúp nhà giao dịch luôn cập nhật và đưa ra quyết định có tính toán. FXStreet có khoảng 60 nhân sự, chia giữa trụ sở Barcelona và nhiều khu vực toàn cầu.
Read More


