
Trade The World
US Dollar Index Price Forecast: Tests 50-day EMA support after breaking below 99.00
Bởi Akhtar Faruqui
Ngày xuất bản: 12 Jan 2026 | Ngày chỉnh sửa: 12 Jan 2026


POPULAR ARTICLES

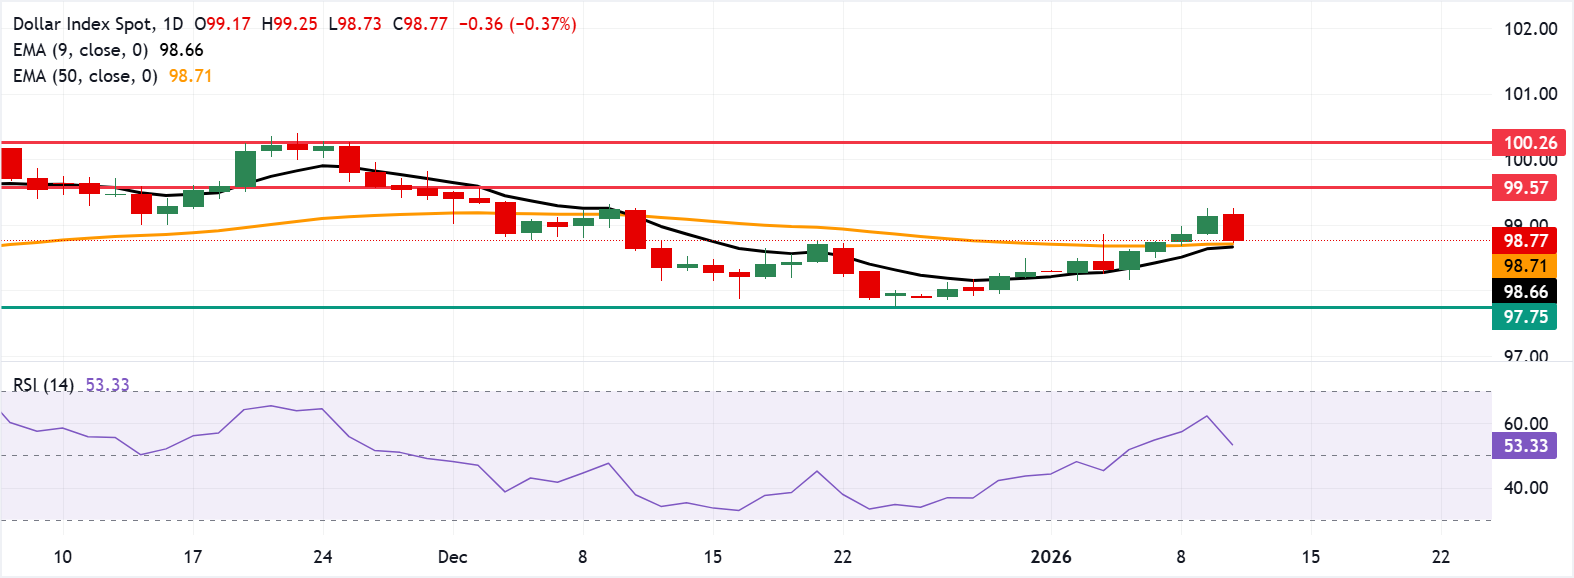
The US Dollar Index (DXY), which measures the value of the US Dollar (USD) against six major currencies, is losing ground after four days of gains and trading around 98.80 during the European hours on Monday.
- US Dollar Index may rebound toward the seven-month high of 99.57
- The 14-day Relative Strength Index at 53 signals improving momentum.
- The immediate support appears at the 50-day EMA of 98.70.
The US Dollar Index (DXY), which measures the value of the US Dollar (USD) against six major currencies, is losing ground after four days of gains and trading around 98.80 during the European hours on Monday. The momentum indicator shows the 14-day Relative Strength Index (RSI) at 53 (neutral) reflects improving momentum.
The US Dollar Index stands marginally above the nine-day Exponential Moving Average (EMA) and the 50-day EMA. The short-term average has turned higher while the 50-day EMA has flattened after a prior decline.
Holding above the rising nine-day EMA would keep the near-term bias supportive and lead the DXY to target the seven-month high of 99.57, recorded on December 2. Further resistance lies at the seven-month high of 100.26, which was recorded on August 1.
On the downside, the immediate support lies at the 50-day EMA of 98.70, aligned with the nine-day EMA at 98.66. Further declines would weaken the short- and medium-term price momentum and put downward pressure on the US Dollar Index to navigate the region around the 97.75, the lowest since October 25.
US Dollar Price Today
The table below shows the percentage change of US Dollar (USD) against listed major currencies today. US Dollar was the weakest against the Swiss Franc.
| USD | EUR | GBP | JPY | CAD | AUD | NZD | CHF | |
|---|---|---|---|---|---|---|---|---|
| USD | -0.48% | -0.39% | -0.05% | -0.27% | -0.23% | -0.39% | -0.61% | |
| EUR | 0.48% | 0.09% | 0.39% | 0.20% | 0.25% | 0.09% | -0.13% | |
| GBP | 0.39% | -0.09% | 0.30% | 0.12% | 0.16% | -0.00% | -0.23% | |
| JPY | 0.05% | -0.39% | -0.30% | -0.19% | -0.15% | -0.31% | -0.53% | |
| CAD | 0.27% | -0.20% | -0.12% | 0.19% | 0.04% | -0.12% | -0.35% | |
| AUD | 0.23% | -0.25% | -0.16% | 0.15% | -0.04% | -0.17% | -0.39% | |
| NZD | 0.39% | -0.09% | 0.00% | 0.31% | 0.12% | 0.17% | -0.22% | |
| CHF | 0.61% | 0.13% | 0.23% | 0.53% | 0.35% | 0.39% | 0.22% |
The heat map shows percentage changes of major currencies against each other. The base currency is picked from the left column, while the quote currency is picked from the top row. For example, if you pick the US Dollar from the left column and move along the horizontal line to the Japanese Yen, the percentage change displayed in the box will represent USD (base)/JPY (quote).
(The technical analysis of this story was written with the help of an AI tool.)

FXStreet
Hơn một triệu người dùng dựa vào FXStreet để có dữ liệu thị trường thời gian thực, công cụ biểu đồ, góc nhìn chuyên gia và tin tức Forex. Lịch kinh tế toàn diện và các hội thảo web giáo dục giúp nhà giao dịch luôn cập nhật và đưa ra quyết định có tính toán. FXStreet có khoảng 60 nhân sự, chia giữa trụ sở Barcelona và nhiều khu vực toàn cầu.
Read More


