
USD/CAD Price Forecast: Slips below 1.3900 toward moving averages
Bởi Akhtar Faruqui
Ngày xuất bản: 16 Jan 2026 | Ngày chỉnh sửa: 16 Jan 2026


BÀI VIẾT PHỔ BIẾN

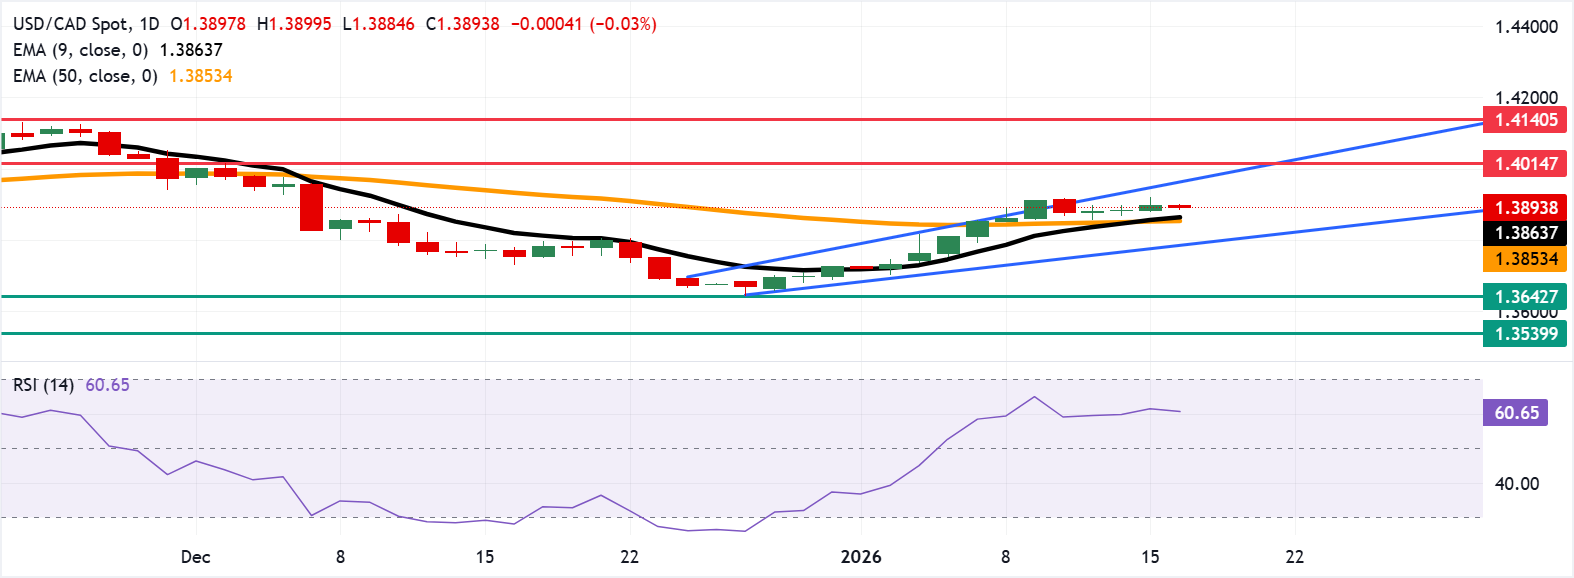
USD/CAD inches lower after three days of gains, trading around 1.3890 during the European hours on Friday. The technical analysis of the daily chart shows the pair remains within an ascending channel pattern, suggesting a persistent bullish bias.
- USD/CAD may target the initial resistance at the upper boundary of the ascending channel around 1.3970.
- The 14-day Relative Strength Index at 60 signals bullish momentum without overbought conditions.
- Initial support is seen at the nine-day EMA near 1.3864, followed by the 50-day EMA at 1.3853.
USD/CAD inches lower after three days of gains, trading around 1.3890 during the European hours on Friday. The technical analysis of the daily chart shows the pair remains within an ascending channel pattern, suggesting a persistent bullish bias. The 14-day Relative Strength Index (RSI) at 60 is bullish and not overbought. RSI above the 50 midline keeps dips shallow.
The nine-day Exponential Moving Average (EMA) has turned higher and now stands above the 50-day EMA, with price holding over both, keeping a topside bias. The 50-day EMA is flattening after a prolonged decline, indicating diminishing downside pressure.
As long as the USD/CAD pair holds above the short-term averages, the bias would remain for tests of overhead resistance at the upper boundary of the ascending channel around 1.3970, followed by the seven-week high of 1.4014, reached on December 2.
Pullbacks would find initial support at the rising nine-day EMA of 1.3864 and at the 50-day EMA at 1.3853. A drop below moving averages would slow the advance and shift risk toward the lower ascending channel boundary around 1.3790. A break below the channel would weaken the bullish bias and put downward pressure on the USD/CAD pair to test the five-month low of 1.3642, recorded on December 26.
(The technical analysis of this story was written with the help of an AI tool.)
Canadian Dollar Price Today
The table below shows the percentage change of Canadian Dollar (CAD) against listed major currencies today. Canadian Dollar was the strongest against the US Dollar.
| USD | EUR | GBP | JPY | CAD | AUD | NZD | CHF | |
|---|---|---|---|---|---|---|---|---|
| USD | -0.06% | -0.07% | -0.25% | -0.03% | -0.05% | -0.34% | -0.14% | |
| EUR | 0.06% | -0.01% | -0.20% | 0.03% | 0.00% | -0.27% | -0.08% | |
| GBP | 0.07% | 0.01% | -0.19% | 0.04% | 0.02% | -0.26% | -0.07% | |
| JPY | 0.25% | 0.20% | 0.19% | 0.25% | 0.21% | -0.08% | 0.12% | |
| CAD | 0.03% | -0.03% | -0.04% | -0.25% | -0.04% | -0.32% | -0.12% | |
| AUD | 0.05% | -0.01% | -0.02% | -0.21% | 0.04% | -0.29% | -0.09% | |
| NZD | 0.34% | 0.27% | 0.26% | 0.08% | 0.32% | 0.29% | 0.20% | |
| CHF | 0.14% | 0.08% | 0.07% | -0.12% | 0.12% | 0.09% | -0.20% |
The heat map shows percentage changes of major currencies against each other. The base currency is picked from the left column, while the quote currency is picked from the top row. For example, if you pick the Canadian Dollar from the left column and move along the horizontal line to the US Dollar, the percentage change displayed in the box will represent CAD (base)/USD (quote).

Hơn một triệu người dùng dựa vào FXStreet để có dữ liệu thị trường thời gian thực, công cụ biểu đồ, góc nhìn chuyên gia và tin tức Forex. Lịch kinh tế toàn diện và các hội thảo web giáo dục giúp nhà giao dịch luôn cập nhật và đưa ra quyết định có tính toán. FXStreet có khoảng 60 nhân sự, chia giữa trụ sở Barcelona và nhiều khu vực toàn cầu.
Đọc thêm


