
Trade The World
USD/JPY Price Forecast: Subdued at around 150.00
Bởi Christian Borjon Valencia
Ngày xuất bản: 21 Oct 2025 | Ngày chỉnh sửa: 21 Oct 2025


POPULAR ARTICLES

The USD/JPY holds firm on Monday, hovering around 150.60 amid a risk-on environment amid the Fed blackout period and the lack of US data, due to the government shutdown. The lack of market moving comments by US President Donald Trump, could keep the pair trading at familiar levels.
- USD/JPY finds firm support at 20-day SMA near 150.14, maintaining a bullish technical structure.
- Fed blackout and US government shutdown mute macro signals, keeping price action rangebound.
- Break above 151.20 opens path toward 152.00, while a drop below 150 risks deeper pullback.
The USD/JPY holds firm on Monday, hovering around 150.60 amid a risk-on environment amid the Fed blackout period and the lack of US data, due to the government shutdown. The lack of market moving comments by US President Donald Trump, could keep the pair trading at familiar levels.
USD/JPY Price Forecast: Technical outlook
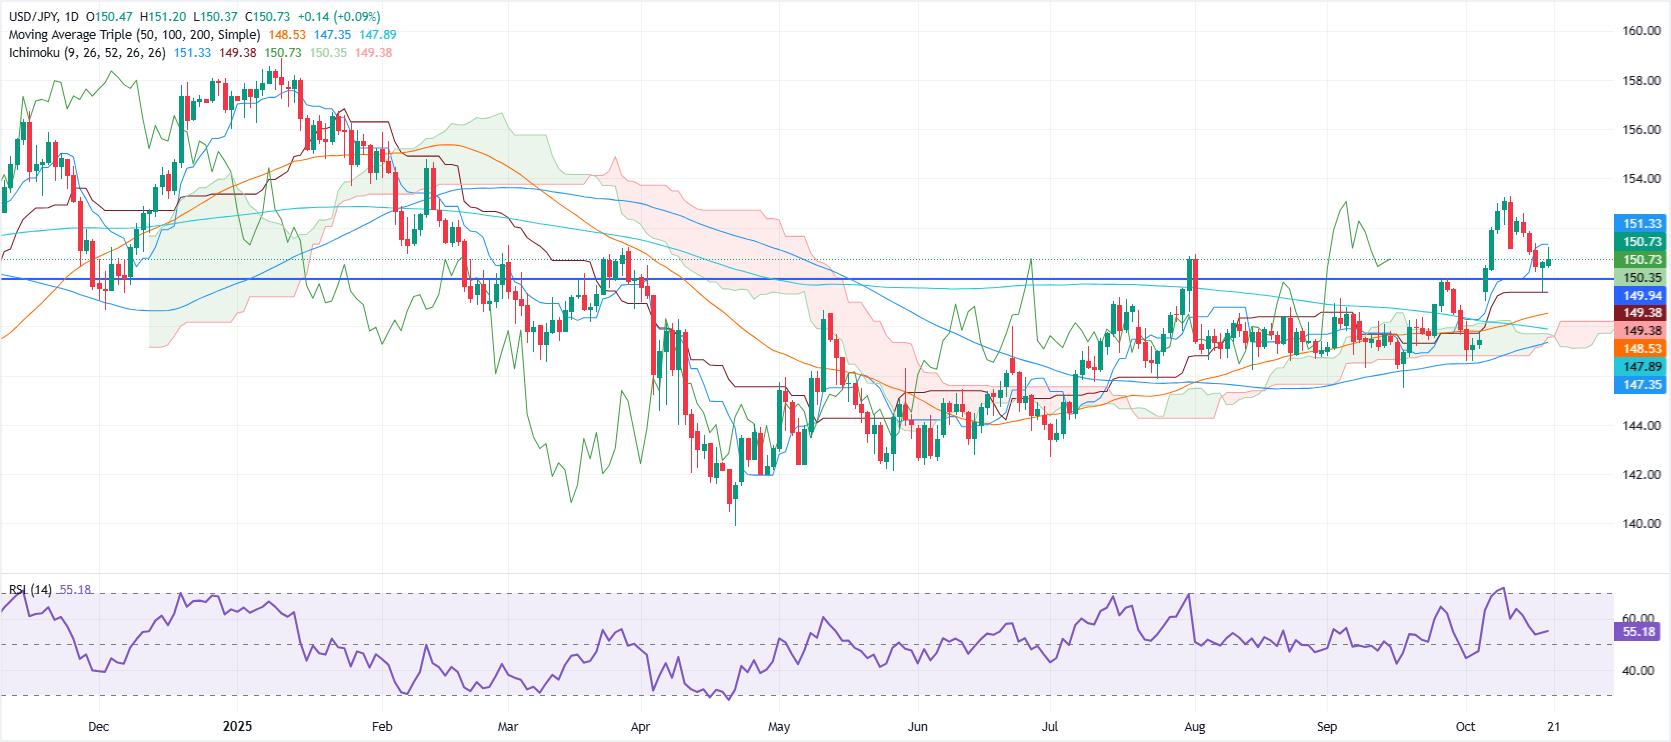
The technical picture shows that the pair found support at the 20-day Simple Moving Average (SMA) around 150.14, after bouncing off daily lows of 149.37, reached last Friday, which ultimately finished the session above 150.00.
For a bullish continuation, buyers must clear the October 20 peak at 151.20. If surpassed, this clears the path towards 152.00, followed by October 10 high if 153.27.
On the flip side, if sellers drive the exchange rate below 150.00, the next support would be 149.37 followed by the 50-day SMA at 148.57.
USD/JPY Price Chart – Daily
Japanese Yen Price This week
The table below shows the percentage change of Japanese Yen (JPY) against listed major currencies this week. Japanese Yen was the strongest against the Swiss Franc.
| USD | EUR | GBP | JPY | CAD | AUD | NZD | CHF | |
|---|---|---|---|---|---|---|---|---|
| USD | -0.03% | 0.07% | 0.02% | -0.00% | -0.02% | -0.05% | 0.04% | |
| EUR | 0.03% | 0.01% | 0.07% | 0.02% | -0.03% | -0.03% | 0.07% | |
| GBP | -0.07% | -0.01% | 0.02% | 0.00% | -0.03% | -0.03% | 0.07% | |
| JPY | -0.02% | -0.07% | -0.02% | -0.02% | -0.03% | -0.12% | 0.04% | |
| CAD | 0.00% | -0.02% | -0.00% | 0.02% | -0.04% | -0.05% | 0.05% | |
| AUD | 0.02% | 0.03% | 0.03% | 0.03% | 0.04% | -0.00% | 0.09% | |
| NZD | 0.05% | 0.03% | 0.03% | 0.12% | 0.05% | 0.00% | 0.10% | |
| CHF | -0.04% | -0.07% | -0.07% | -0.04% | -0.05% | -0.09% | -0.10% |
The heat map shows percentage changes of major currencies against each other. The base currency is picked from the left column, while the quote currency is picked from the top row. For example, if you pick the Japanese Yen from the left column and move along the horizontal line to the US Dollar, the percentage change displayed in the box will represent JPY (base)/USD (quote).

FXStreet
Hơn một triệu người dùng dựa vào FXStreet để có dữ liệu thị trường thời gian thực, công cụ biểu đồ, góc nhìn chuyên gia và tin tức Forex. Lịch kinh tế toàn diện và các hội thảo web giáo dục giúp nhà giao dịch luôn cập nhật và đưa ra quyết định có tính toán. FXStreet có khoảng 60 nhân sự, chia giữa trụ sở Barcelona và nhiều khu vực toàn cầu.
Read More


