
Zilliqa Price Analysis: ZIL risks deeper correction as bearish pressure mounts
Bởi Manish Chhetri
Ngày xuất bản: 21 Jan 2026 | Ngày chỉnh sửa: 21 Jan 2026


BÀI VIẾT PHỔ BIẾN

Zilliqa (ZIL) is nearing key resistance, trading at $0.0050 on Wednesday; a rejection could trigger a deeper correction. The weakening derivatives positioning among traders further supports the bearish price action in ZIL.
- Zilliqa price is retesting a previously broken trendline, with rejection likely to trigger a deeper correction.
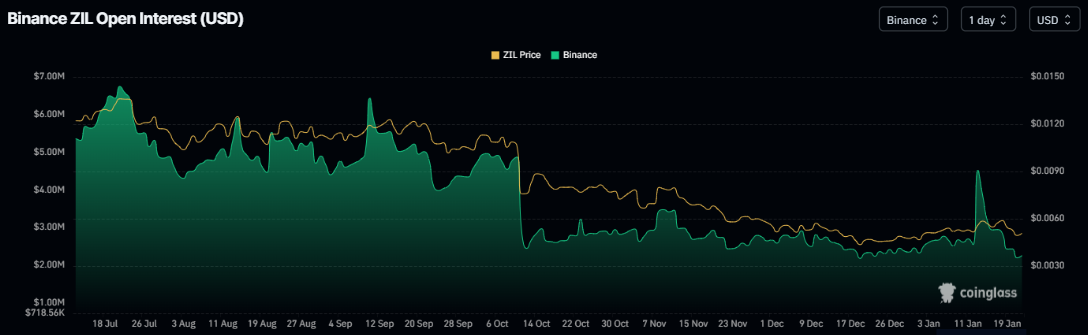
- Derivatives market shows a bearish bias, with Open Interest on Binance falling to its lowest level since mid-December.
- The technical outlook suggests a downward move, with momentum indicators signaling bearish bias.
Zilliqa (ZIL) is nearing key resistance, trading at $0.0050 on Wednesday; a rejection could trigger a deeper correction. The weakening derivatives positioning among traders further supports the bearish price action in ZIL. In addition, the technical outlook suggests further correction as momentum indicators turn negative.
Zilliqa’s waning investor participation
Zilliqa derivatives show signs of weakness, with futures Open Interest (OI) on the Binance exchange dropping to $2.25 million on Wednesday, levels not seen since mid-December, reflecting waning investor participation.
Zilliqa Price Analysis: ZIL bears are in control of the momentum
Zilliqa price closed below the ascending trendline (drawn by connecting multiple lows since December 19) on Tuesday, indicating a shift in market structure. As of Wednesday, ZIL is nearly at this breakout zone, which roughly coincides with daily resistance at $0.0051 and the 50% price level (drawn from the December low of $0.0042 to the January 12 high at $0.0061) at $0.0052, making this a key reversal zone.
If ZIL faces rejection from these resistance levels, it could extend the decline toward the December 31 low of $0.0046.
The Relative Strength Index (RSI) on the daily chart reads 45, below the neutral level of 50, indicating bearish momentum is gaining traction. The Moving Average Convergence Divergence (MACD) also showed a bearish crossover on Tuesday, further supporting the negative outlook.
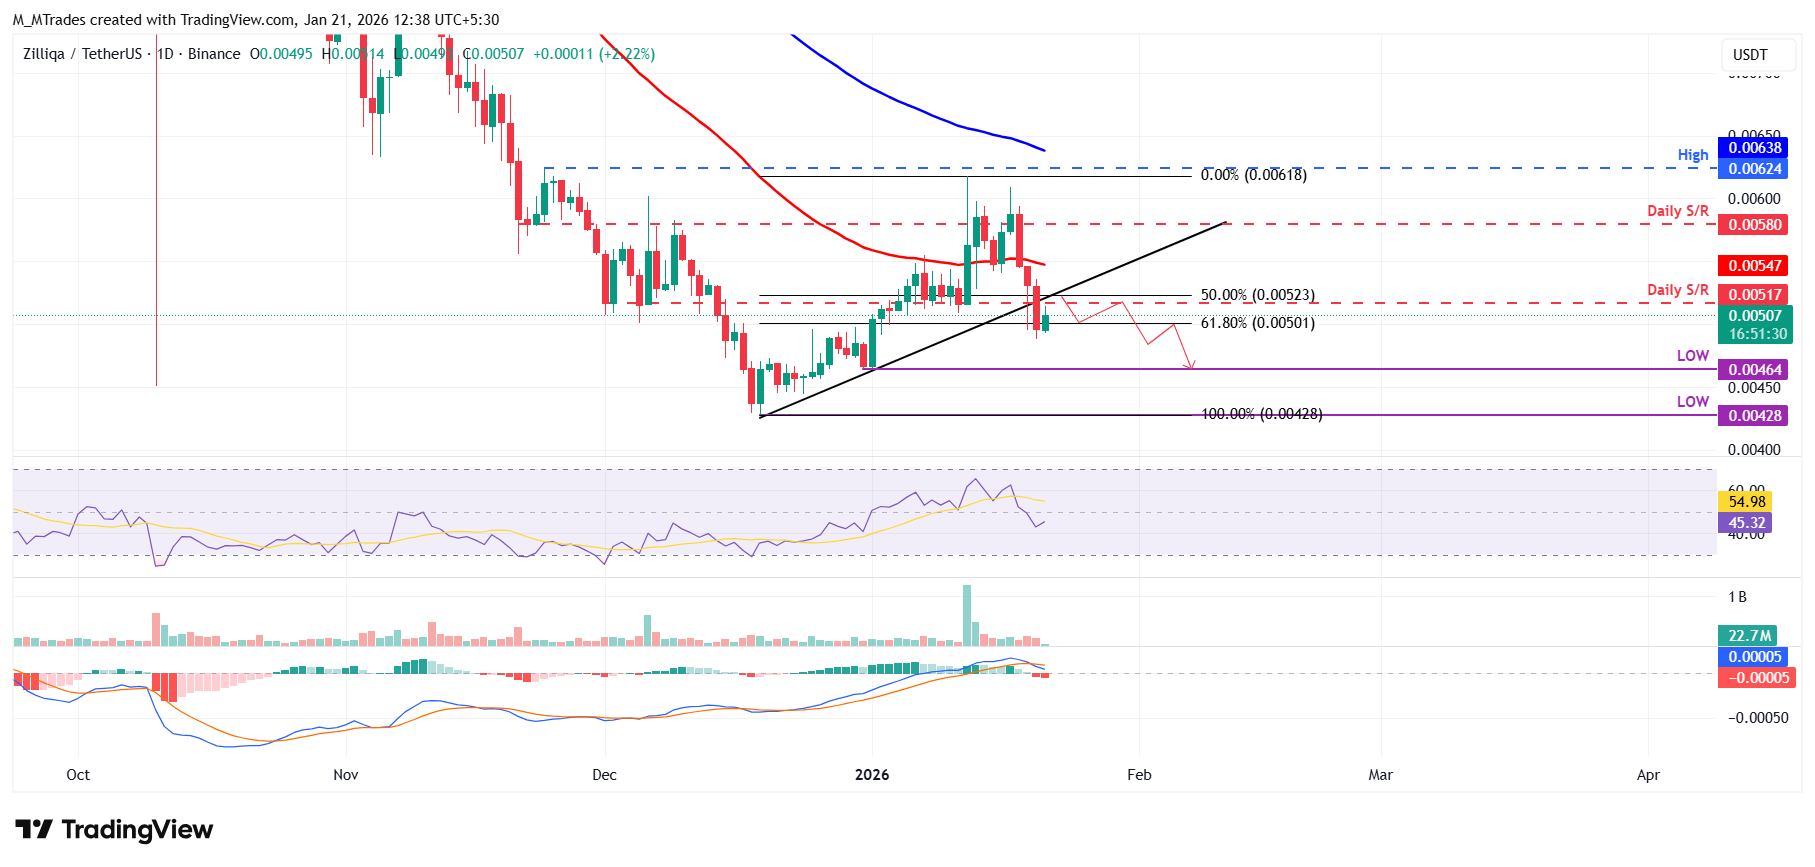
However, if ZIL recovers and closes above the daily resistance at $0.0051 on a daily basis, it could extend the advance toward the 50-day Exponential Moving Average (EMA) at $0.0054.

Hơn một triệu người dùng dựa vào FXStreet để có dữ liệu thị trường thời gian thực, công cụ biểu đồ, góc nhìn chuyên gia và tin tức Forex. Lịch kinh tế toàn diện và các hội thảo web giáo dục giúp nhà giao dịch luôn cập nhật và đưa ra quyết định có tính toán. FXStreet có khoảng 60 nhân sự, chia giữa trụ sở Barcelona và nhiều khu vực toàn cầu.
Đọc thêm


