


释放您的潜力:
加入100万名
投资者的行列
立即开始交易

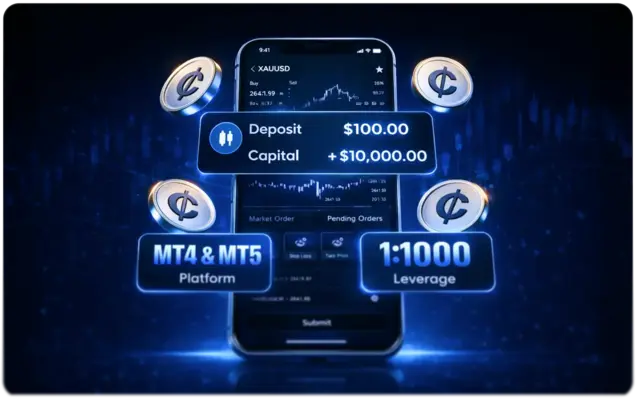
0.0点
点差起始
$100
最低存款
1:1000
最高杠杆
<30毫秒
执行速度
免费
资金费用
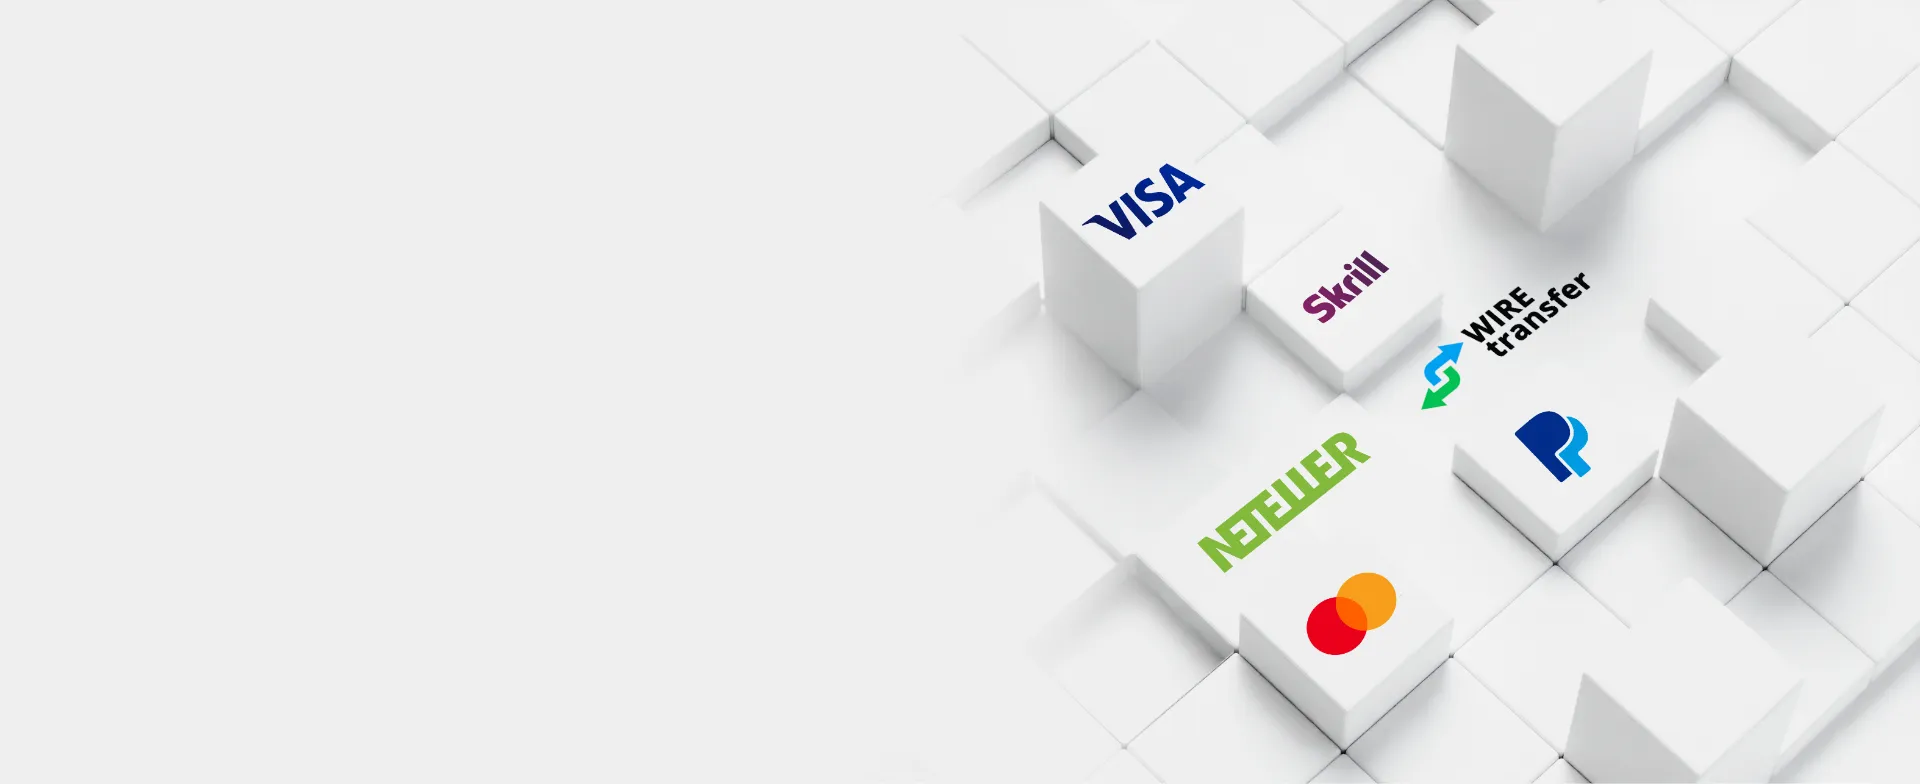
+10
资金选项
数百种
交易工具
100%
隔离客户资金


为什么选择TMGM?
无与伦比的定价
受益于透明定价、超紧点差和低佣金,在每笔交易前都能获得成本优势。
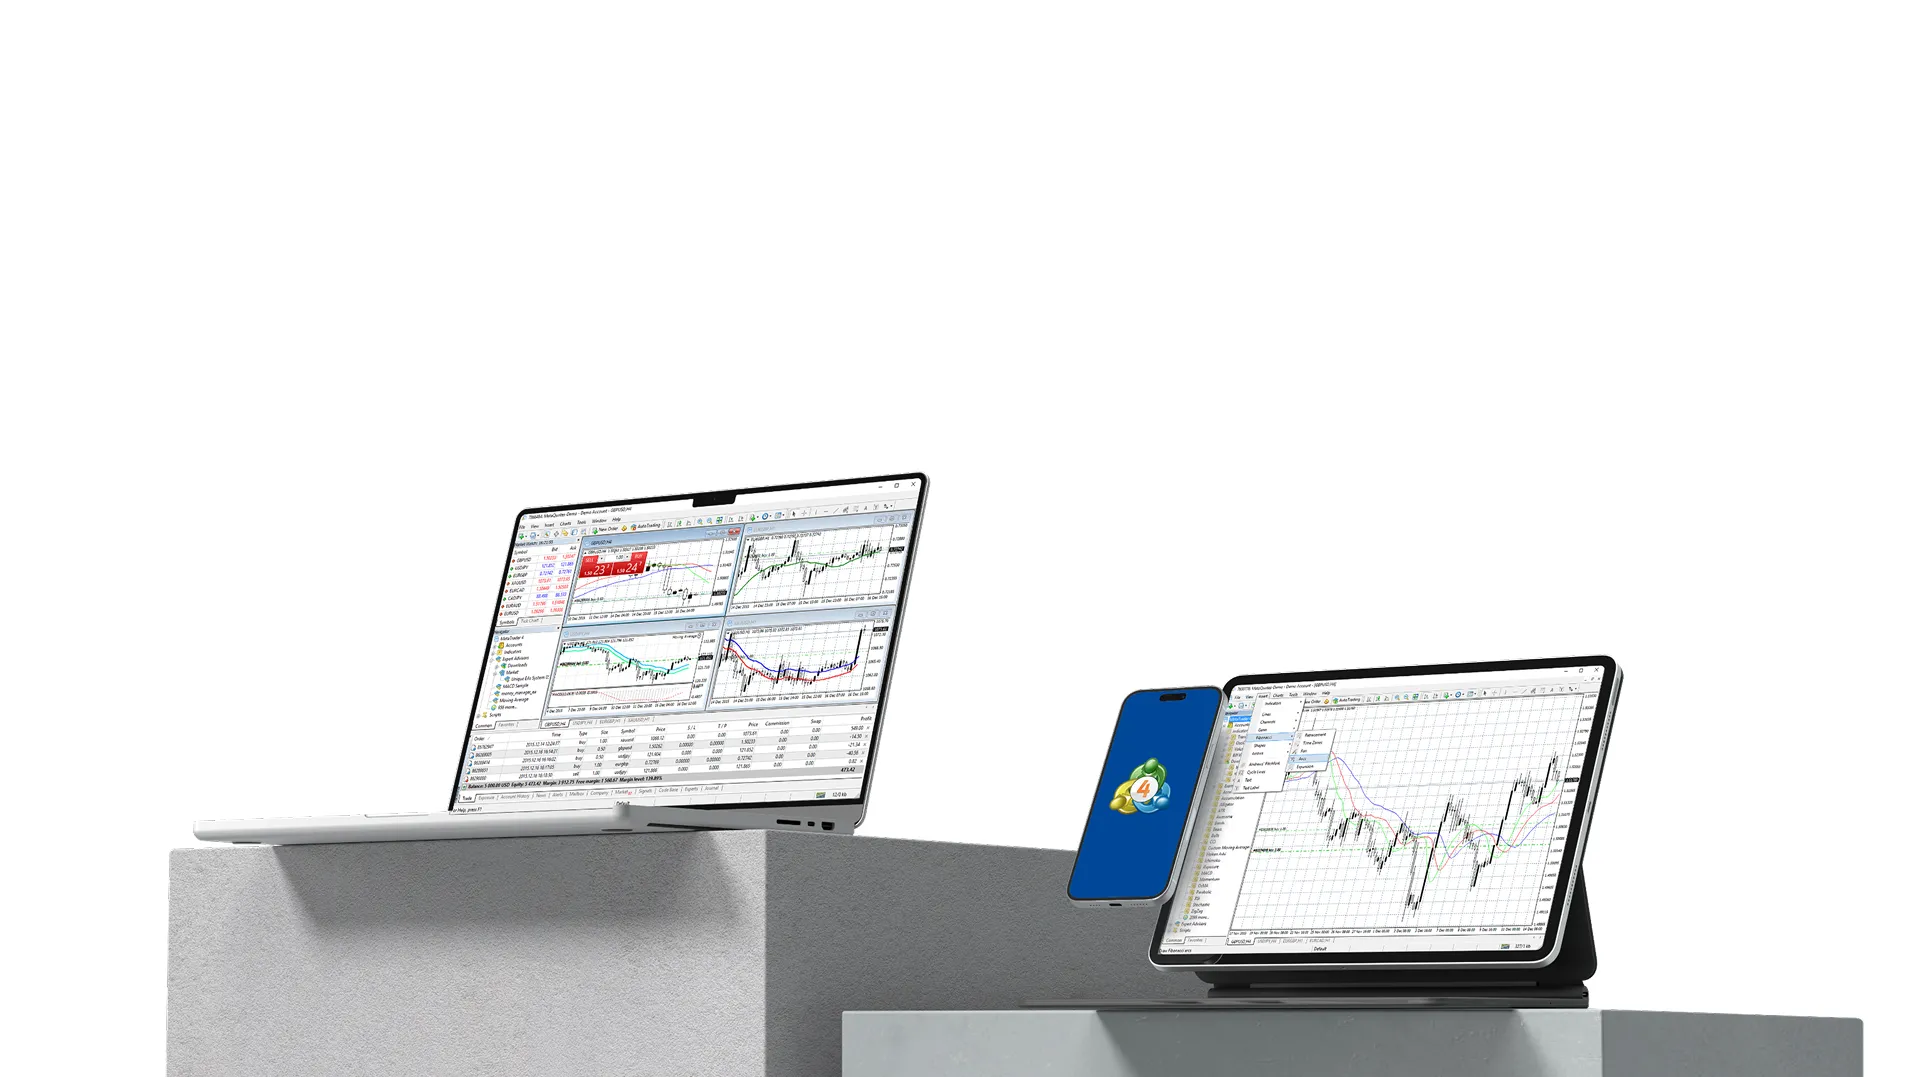
世界级交易平台
在TMGM屡获殊荣的平台上无缝交易,包括专为精准、速度和卓越的交易体验而设计的MetaTrader。
强大的交易工具
解锁高级交易功能,如一键执行、深度市场分析、实时提醒和先进的图表工具,让交易更智能。
独家教育资源
通过TMGM的免费网络研讨会、专家主导的课程和深度文章提升您的技能——涵盖从基础知识到复杂策略的所有内容。
在TMGM,我们通过尖端平台和行业领先技术提供最佳交易条件。我们对研究和创新的承诺确保您受益于最佳流动性和闪电般的执行速度。
保持领先 尽享 TMGM 市场洞察与分析


安全可靠的TMGM交易平台
只需一个 TMGM 交易账户,便可交易数百种差价合约产品,涵盖外汇、股票、指数、大宗商品、ETF、债券等多个市场。


TMGM 赞助
TMGM 是英超劲旅切尔西足球俱乐部的官方合作伙伴,也是 NBA 顶级球队布鲁克林篮网队的官方合作伙伴。这一战略合作伙伴关系体现了 TMGM 对创新、卓越表现、追求卓越和全球影响力的承诺,与这两家标志性体育组织的卓越地位相得益彰。

见证俱乐部
标志性时刻
标志性时刻

篮网中国行

专属VIP
观赛位置
观赛位置

激动人心
的球迷体验
的球迷体验

布鲁克林篮网队
官方合作伙伴
官方合作伙伴
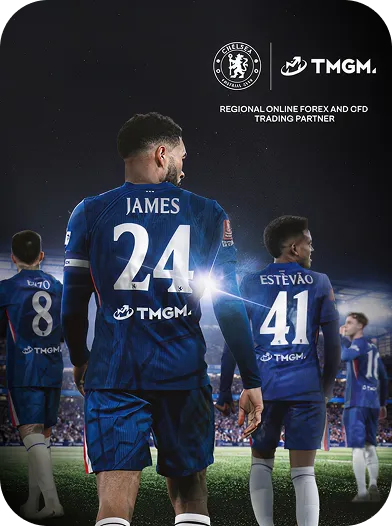
TMGM亮相切尔西球衣广告位
VIP观赛款待
VIP见面会

体育场参观

切尔西足球俱乐部
官方合作伙伴
官方合作伙伴
见证俱乐部
标志性时刻
标志性时刻
篮网中国行
专属VIP
观赛位置
观赛位置
激动人心
的球迷体验
的球迷体验
布鲁克林篮网队
官方合作伙伴
官方合作伙伴
TMGM亮相切尔西球衣广告位
VIP观赛款待
VIP见面会
体育场参观

切尔西足球俱乐部
官方合作伙伴
官方合作伙伴


奖项与认可

年度交易商奖
2025 Followme
香港峰会
亚太最佳多资产金融商奖
Brokersview
年度Fastbull奖项
最具创新性赞助
外汇竞技赛事奖项
SkyLine金融商指南奖
WikiFX SkyLine
金融指南2024
最佳外汇交易平台奖
IFINEXPO
年度最佳
信誉外汇经纪商奖
WikiFX曼谷
2024金融博览会
最佳交易课程奖
ForexBrokers
Annual Awards
最佳交易体验奖
Ultimate
Fintech Awards
越南地区最佳交易经纪商
Traders Fair
& Awards
亚洲地区最佳交易服务奖
Traders Fair
& Awards
澳洲社区重大贡献奖
胡润百富
金融服务业短片类银奖
The Telly Awards
2022年度
十大最受欢迎交易商
Follow Me 年度奖项
最具成长经纪商
亚洲交易博览会
最佳增长交易商
Follow Me 年度奖项
最佳交易环境奖
金融科技大会
最佳交易环境平台
UK Forex Awards
中国互联网金
融行业诚信示范单位
中国企业战略联盟
最佳交易环境平台
马来西亚
国际金融世界论坛
最佳客户服务券商
中澳传媒集团
年度最值得信赖经纪商
新浪
增长最快的外汇经纪商
UK Forex Award
外汇奖 - 亚太地区
杰出经纪商
Best Partner
Program Asia
0+ 亿
交易量
150+
国家
120万
每年交易手数
数百种
交易产品
(数据截至2024年)
(数据截至2024年)
4.3 / ★★★★★
投资评级
6 资产类别
外汇 · 加密货币 · 贵金属 · 指数 · 股票 · 原油
不到3分钟便可开设账户!
1
注册
选择账户类型并填写
我们的快速安全申请表。
2
验证
通过我们的简化数字化
开户流程,快速完成验证。
3
入金
通过多种支付方式
为您的交易账户充值。
4
交易
立即开始交易,访问
数百种交易工具。
交易的力量掌握在您手中
加入来自150个国家的全球交易者,体验TMGM的闪电般执行速度。更智能、更快速、更自信地交易。


本网站提供的信息仅具有一般性质,不构成个人财务建议。在根据本网站上的任何信息采取行动之前,您应结合自身的目标、财务状况和需求,考虑该信息是否适合您。投资差价合约(CFD)和外汇保证金合约具有重大风险,并不适合所有投资者。您的亏损可能超过初始入金。您并不拥有,也不享有任何相关标的资产的权益。我们建议您寻求独立意见,并在交易前确保您已充分了解所涉及的风险。在购买本网站列出的任何产品之前,务必阅读并考虑相关披露文件。本网站提供的信息和广告并非面向任何在其所在国家或司法管辖区使用此类信息会违反当地法律法规的人士。本网站提供的产品和服务不面向美国、马来西亚和泰国居民。
TMGM 是由多家金融监管机构授权。
TMGM 集团下的 Trademax Australia Limited 公司(交易名称为TMGM),是由澳大利亚证券和投资委员(ASIC)监管的金融服务公司,金融服务牌照号为 436416,公司地址为 Level 28, One International Tower, 100 Barangaroo Avenue, 2000 Sydney, NSW Australia.
邮箱:support@tmgm.com.au
TMGM 集团下的 Trademax Global Limited公司(交易名称为TMGM),是由瓦努阿图金融服务委员会(VFSC)监管的金融服务公司,金融牌照号为 40356,注册地址为 1276, Kumul Highway, Port Vila, Vanuatu, Republic of Vanuatu.
邮箱:support@tmgm.com
Trademax Global Markets (SE) Limited,以 TMGM 名义经营,获塞舌尔金融服务管理局(FSA)授权并监管,许可证号为 SD224。公司注册地址为塞舌尔马埃岛 Providence Estate ABIS 中心13号办公室。
邮箱:support@tmgm.com
TMGM集团下的Trademax Global Markets (International) Pty Ltd公司(交易名称为TMGM),是由毛里求斯金融服务委员会监管的金融服务公司. 牌照号为 GB22201012,注册地址为33, Edith Cavell Street C/o IQ EQ Fund Services (Mauritius) Ltd Port Louis, 11324 Mauritius.
邮箱:support@tmgm.com
版权所有 © TMGM。保留所有权利