
要点总结:
2)结合经济、行业和公司分析,能够构建分层视角,提高估值准确性和决策质量。
a) 跟踪利率、通胀和增长情况,可将宏观环境与行业盈利及估值倍数联系起来。
b) 评估增长、竞争和周期性,有助于判断行业趋势如何放大或削弱一家公司的利润。
c) 解读财务报表和管理层质量,可将企业经营表现转化为对现金流持续性和风险的判断。
3)同时采用定性与定量视角,可以减少认知盲点,更全面地把握未来前景。
a) 管理层执行力、品牌实力和商业模式韧性,能够体现企业的持续竞争力,而这些往往是单纯数字无法反映的。
b) 收入、利润率、ROE、ROA、EPS 和市盈率(P/E)等比率与趋势,可量化企业效率、盈利能力以及潜在错价。
4)自上而下和自下而上是识别高质量、价格合理机会的互补路径。
a) 从宏观经济入手,再逐步聚焦强势行业和个股,有助于使选股与当前宏观力量保持一致。
b) 聚焦公司层面的优势和财务状况,则有助于发掘那些无论周期如何都可能跑赢市场的企业。
5)这种方法耗时较长,要求具备会计和经济学能力,更适合较长期限,因此许多交易者会将其与技术工具结合,用于把握时机。
基本面分析如何运作
从本质上讲,股票基本面分析帮助交易者判断一只股票的内在价值是高于还是低于其当前市场价值。如果分析显示内在价值高于市场价格,则该股票被视为低估, 这意味着存在买入机会。
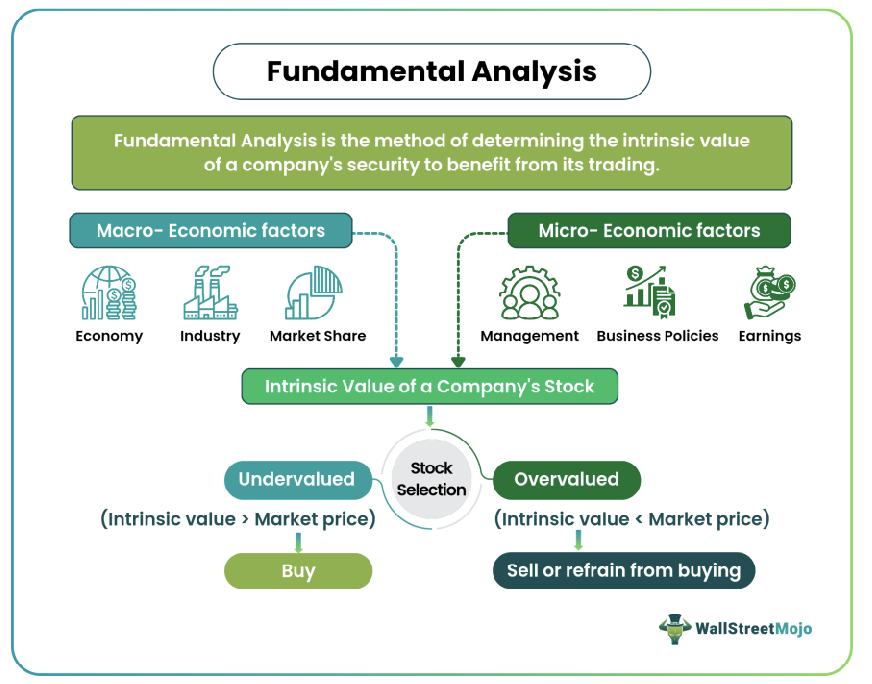
来源: Wall Street Mojo
相反,如果一只股票的内在价值低于市场价格,则被视为高估,交易者可能会避免买入。基本面分析的目标,是帮助交易者通过识别内在价值与市场价值之间的这些偏差来获取收益。
这种分析会全面审视一家公司的财务报表,包括资产负债表、利润表和现金流量表。它还会考虑更广泛的经济和行业背景,从而帮助交易者更好地理解该股票。在实际应用中,这通常也会与产品知识相结合,例如 股票差价合约 以及可交易的 市场范围 。
基本面分析的关键组成部分
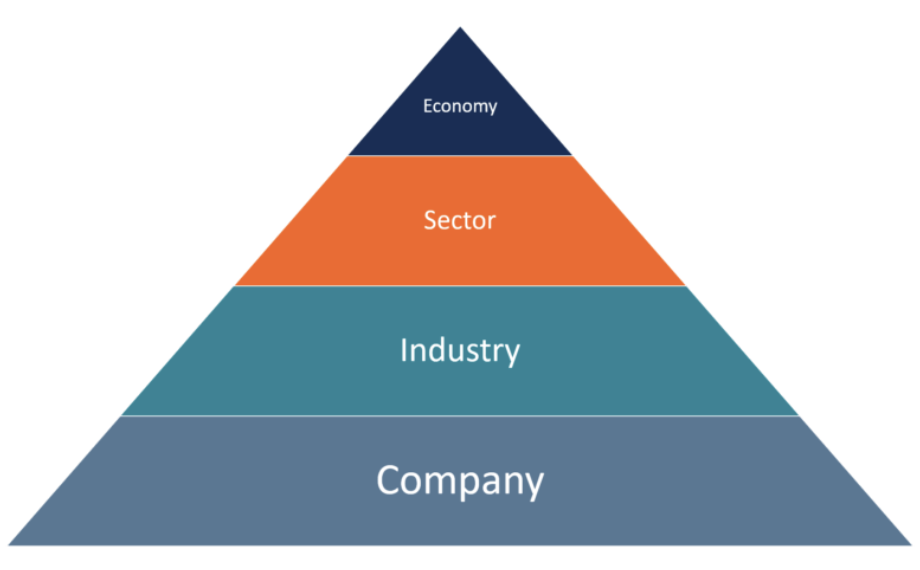
基本面分析可分为三大组成部分:经济分析、行业分析和公司分析。每个组成部分都能为股票或投资的不同方面提供有价值的洞察,因此交易者有必要全面掌握。
经济分析。 这涉及研究利率、通胀和 GDP 等宏观经济因素。经济日历可帮助交易者跟踪可能推动市场波动并影响估值的数据发布。例如,利率上升可能会打击依赖借贷的行业,如房地产或公用事业。
行业分析:行业分析侧重于了解公司所处的具体行业。它关注行业增长、板块表现和竞争力量。行业趋势会极大影响一家公司的盈利能力和未来增长前景。例如,蓬勃发展的科技板块可能会提振苹果和微软等公司,而低迷的零售板块则可能对传统零售商产生负面影响。
公司分析:这是交易者深入研究公司内部经营指标的环节。通过评估财务报表、管理层质量、商业模式和公司品牌,来判断该股票的长期潜力。这不仅仅是看数字,还包括理解公司管理是否得当,以及其在市场中的认知和定位。
这三个组成部分结合起来,能够为交易者提供全面图景,帮助他们判断某只股票是否值得买入、持有或卖出。
基本面分析的类型
在进行基本面分析时,交易者会同时采用定性和定量两种方法。每种方法都能从不同角度审视股票,并帮助形成更完整的分析。
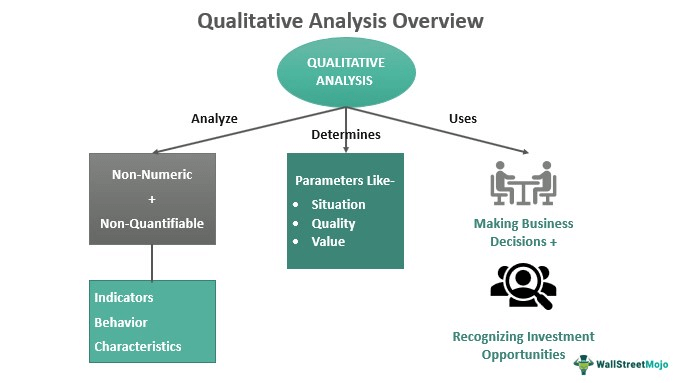
来源: Wall Street Mojo
1. 定性分析
定性分析关注可能影响公司表现的非数值因素。这些包括管理层质量、品牌实力和商业模式等要素。
例如,公司领导层执行其愿景的能力,以及其在市场中的声誉,往往难以量化。然而,这些通常是衡量公司长期生存能力的重要指标。
例如,一家拥有强大品牌和忠诚客户群的公司,可能比市场存在感较弱的企业更能抵御经济下行。此外,管理层变动或消费者偏好的转变,也可能显著影响公司的股价。
1来源: Wall Street Mojo
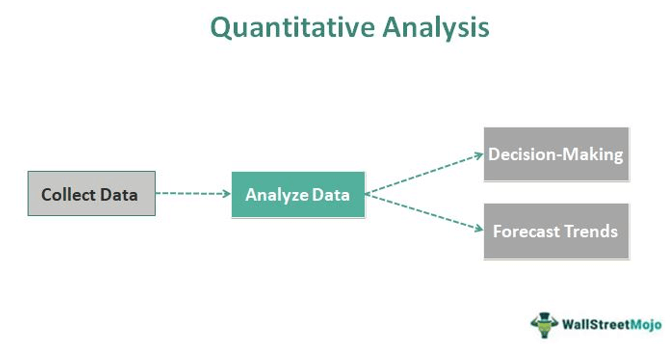
2. 定量分析
另一方面,定量分析处理的是硬数据。这包括财务报告、历史业绩指标和统计数据。
分析师通过审视公司的季度收益、营收增长、利润率及其他财务比率来衡量其健康状况。这种分析使交易者能够评估公司创造利润、管理债务和维持强劲现金流的能力。
定量分析中一种常见的方法,是使用市盈率(P/E)来判断股票是被低估还是高估。其他重要指标还包括净资产收益率(ROE)、总资产收益率(ROA)和每股收益(EPS)。
这些数据有助于洞察公司利用其资源为股东创造回报的能力。
开展基本面分析的方法
开展基本面分析主要有两种方法:自上而下法和自下而上法。
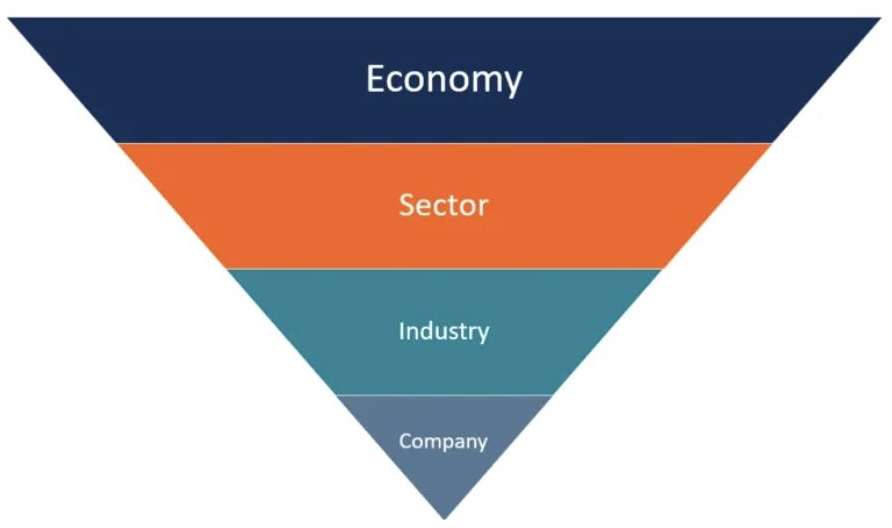
来源: CFI
自上而下法
在自上而下法中,交易者首先分析更广泛的经济环境。他们会观察通胀率、失业率和 GDP 增长等宏观经济指标,以评估整体经济健康状况。 自上而下分析 随后会逐步缩小范围,聚焦到行业板块,最终筛选出表现相对强势的股票。
在理解经济格局之后,他们会将分析范围缩小到具有前景的特定板块或行业。最后,他们会聚焦这些板块中有潜力跑赢市场的个股。
那些相信宏观经济趋势会影响个股表现的投资者,通常会采用这种方法。
来源: CFI
自下而上法
相反,自下而上法从分析个别公司开始。采用这种方法的交易者会关注公司的具体表现,而不过分强调整体行业或经济环境。
其背后的理念是,即使在经济下行时期,某些公司仍可能跑赢其所在行业或整体经济。
自下而上投资者会优先考虑微观经济因素,例如公司的产品线、竞争优势和财务指标,以作出投资决策。
基本面分析的局限性
尽管基本面分析是进行长期投资决策的宝贵工具,但它也存在局限性。其中一个关键挑战是它非常耗时。
进行全面的基本面分析,需要对会计和经济学都有深入了解,并且能够准确解读财务报表。
此外,基本面分析主要着眼于长期,这对于希望从短期价格波动中获利的交易者来说,未必理想。将基本面分析与 技术分析 结合,可以形成更全面的交易策略。 对于基于图表的信号,交易者通常会使用 RSI、 MACD、 趋势线以及 价格图表等工具。
基本面分析仍然是交易者发现被低估或高估证券、从而作出明智交易决策的最可靠方法之一。
通过研究经济环境、行业趋势和公司的财务健康状况,交易者可以洞察一只股票的真实价值。无论采用自上而下法还是自下而上法, 市场分析工具 都可以支持一致性的分析流程,并帮助在金融市场中降低风险、优化回报。


