

USD/JPY Price Forecast: Dollar eases to 162.00, forming a triangle pattern
- USD/JPY drifts lower for the third consecutive day and nears 162.00.
- Dwindling hopes that the Fed will hike rates in July have hurt the US Dollar this week.
- Momentum indicators show a lack of clear bias.
The US Dollar (USD) holds marginal losses against the Japanese Yen (JPY) at Thursday’s European session opening, and approaches the 162.00 area at the time of writing. Recent price action shows a sequence of lower highs and higher lows, forming a triangle pattern.
US data released this week has dampened market hopes of immediate Federal Reserve (Fed) rate cuts and has sent the US Dollar moderately lower against its main peers.

On Wednesday, US Producer Prices Index (PPI) showed an unexpected contraction in June to corroborate the disinflationary trend shown by Tuesday's consumer inflation data, which practically confirms that the Fed will keep its monetary policy unchanged at its July meeting.
The Japanese Yen bulls, however, remain subdued amid investors’ cautiousness about the war in Iran, which is pushing Oil prices higher, and growing doubts about the Japanese Finance Ministry’s plans to repatriate pension fund investments.
Technical Analysis: USD/JPY is looking for direction
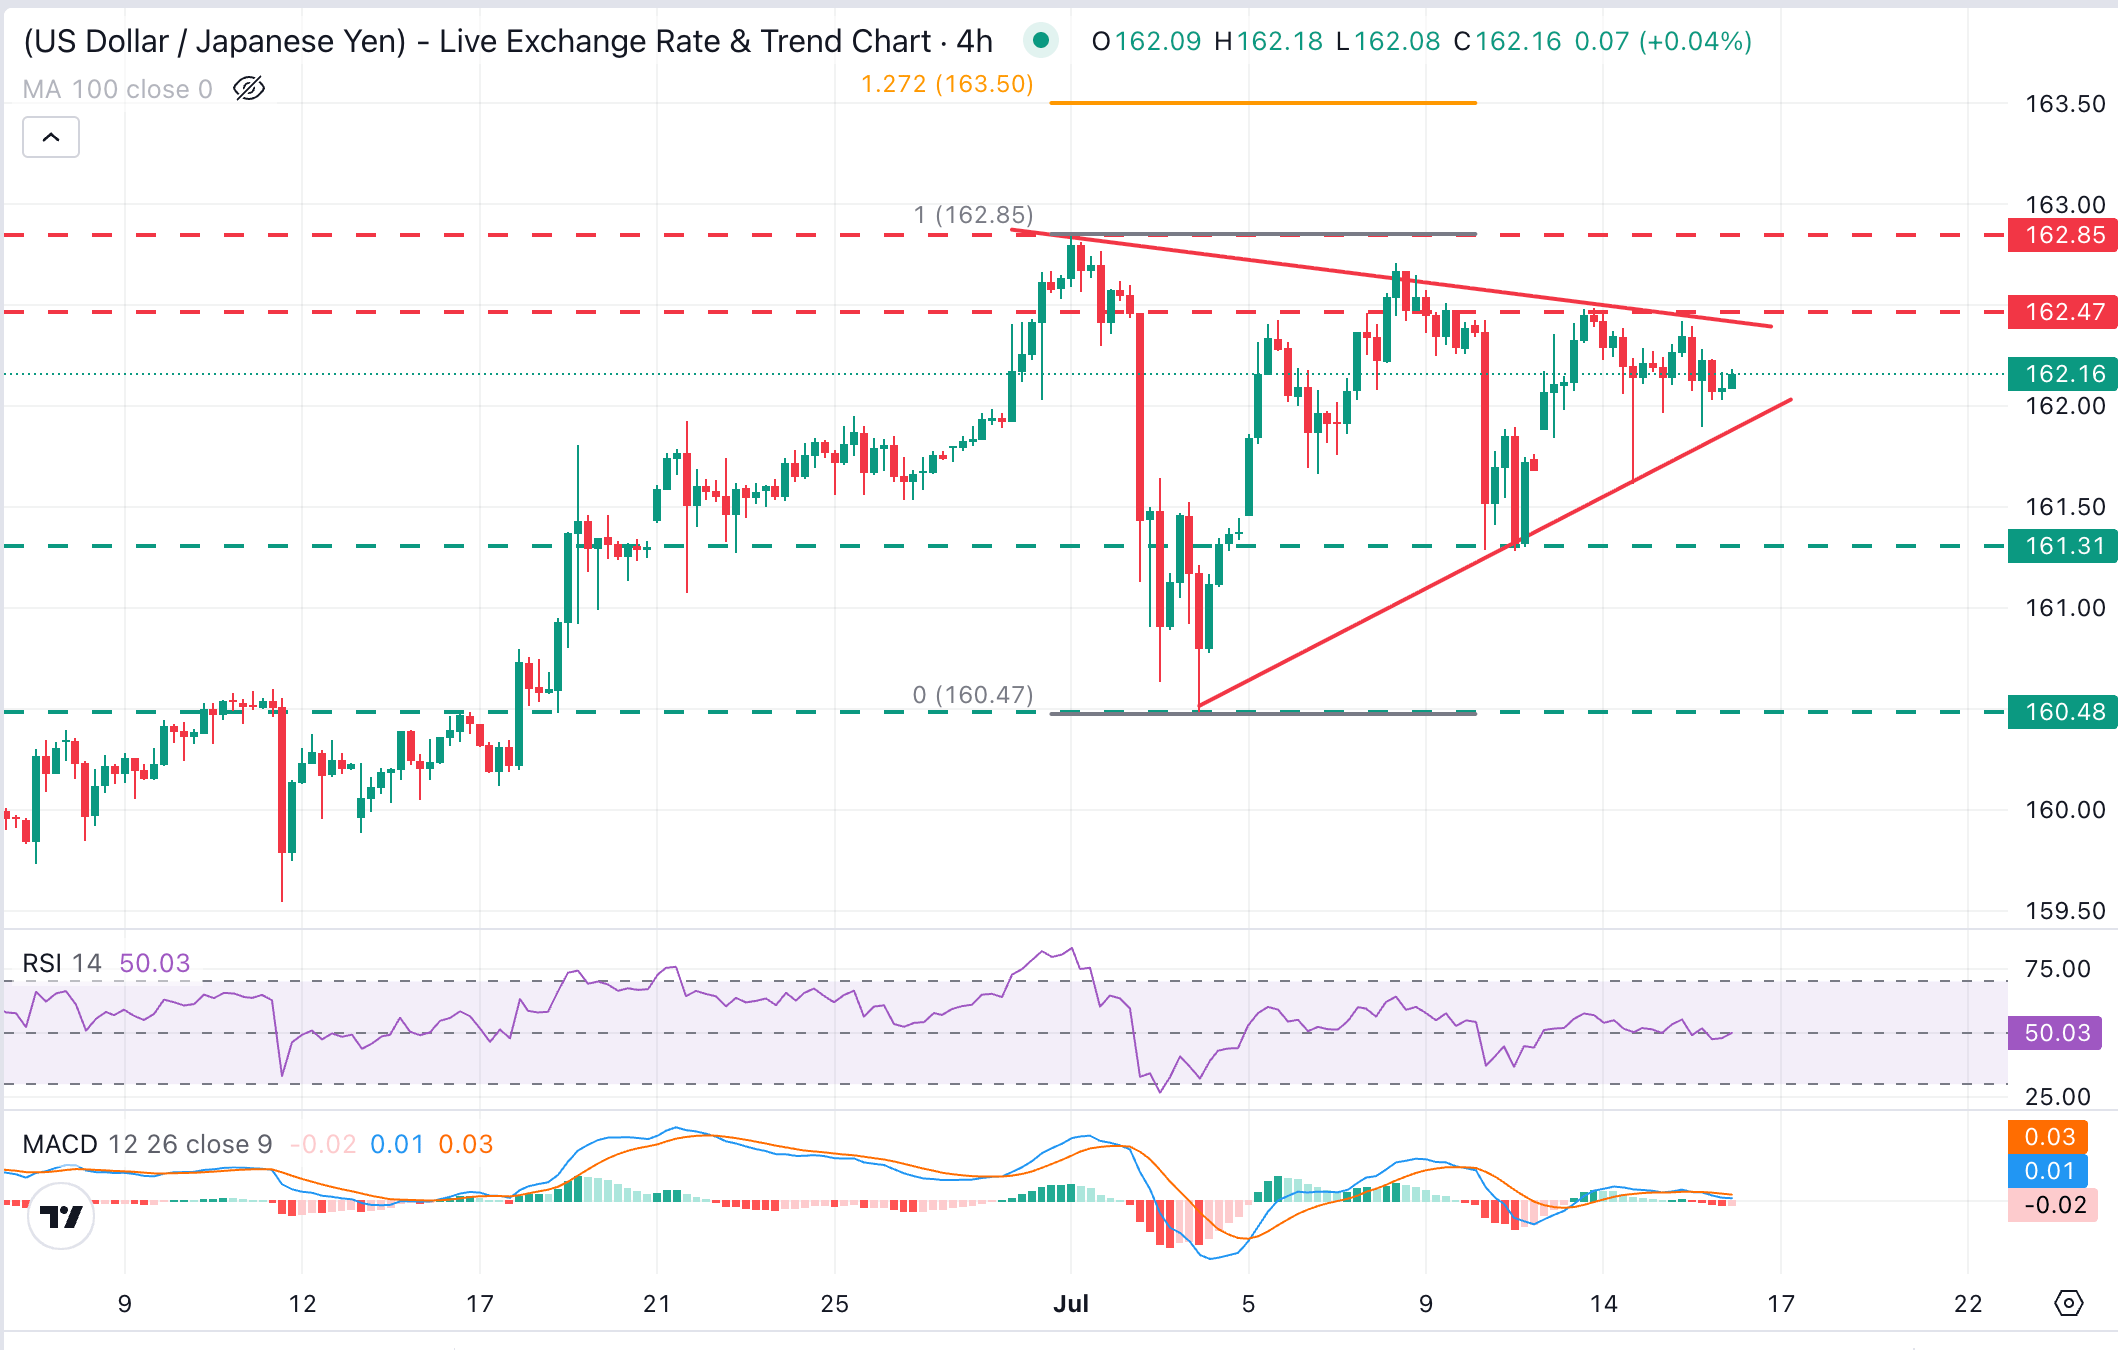
USD/JPY trades at 162.16, maintaining a bullish near-term bias intact, yet with momentum indicators showing a lack of a clear trend. The four-hour Relative Strength Index (14) is hovering around the 50 midline, while the Moving Average Convergence Divergence (MACD) stays slightly negative, hinting at a slowing bullish momentum rather than outright exhaustion.
The bottom of the triangle is at 161.90, with the next targets below here at the July 10 lows in the area of 161.30 and the bearish target of the triangle pattern, at 160.49 (July 3 low).
On the topside, the triangle top and July 13 and 15 highs, between 162.40 and 162.50, are closing the path to the 40-year high, at 162.84. Further up, the 127.2% Fibonacci retracement of the early July pullback, at 163.50, emerges as a plausible target.
(The technical analysis of this story was written with the help of an AI tool. Know more.)
US Dollar Price Today
The table below shows the percentage change of US Dollar (USD) against listed major currencies today. US Dollar was the strongest against the Swiss Franc.
| USD | EUR | GBP | JPY | CAD | AUD | NZD | CHF | |
|---|---|---|---|---|---|---|---|---|
| USD | -0.04% | 0.03% | -0.03% | 0.05% | 0.06% | -0.08% | 0.06% | |
| EUR | 0.04% | 0.06% | 0.02% | 0.10% | 0.18% | -0.03% | 0.09% | |
| GBP | -0.03% | -0.06% | -0.04% | 0.06% | 0.10% | -0.09% | 0.05% | |
| JPY | 0.03% | -0.02% | 0.04% | 0.06% | 0.16% | -0.05% | 0.09% | |
| CAD | -0.05% | -0.10% | -0.06% | -0.06% | 0.09% | -0.11% | 0.02% | |
| AUD | -0.06% | -0.18% | -0.10% | -0.16% | -0.09% | -0.18% | -0.07% | |
| NZD | 0.08% | 0.03% | 0.09% | 0.05% | 0.11% | 0.18% | 0.12% | |
| CHF | -0.06% | -0.09% | -0.05% | -0.09% | -0.02% | 0.07% | -0.12% |
The heat map shows percentage changes of major currencies against each other. The base currency is picked from the left column, while the quote currency is picked from the top row. For example, if you pick the US Dollar from the left column and move along the horizontal line to the Japanese Yen, the percentage change displayed in the box will represent USD (base)/JPY (quote).














