
XRP and XLM outlook: Fragile recovery as traders favor downside
作者 Manish Chhetri
更新: 9 Jun 2026


热门文章

Ripple (XRP) and Stellar (XLM) remain under pressure on Tuesday after a mild recovery following a massive correction in the previous week.
- XRP steadies at $1.14 on Tuesday after a mild recovery in the previous two days.
- XLM is maintaining a neutral-to-slightly constructive tone, as it holds above the 200-day EMA at $0.198.
- Mixed sentiment, with a bearish tilt among traders, caps both altcoin potential recoveries.
Ripple (XRP) and Stellar (XLM) remain under pressure on Tuesday after a mild recovery following a massive correction in the previous week. Weakening derivatives positioning, alongside mixed on-chain data for both XRP and XLM, suggests that any recovery rallies are likely viewed as corrective within a broader bearish context.
Derivatives data show a bearish bias
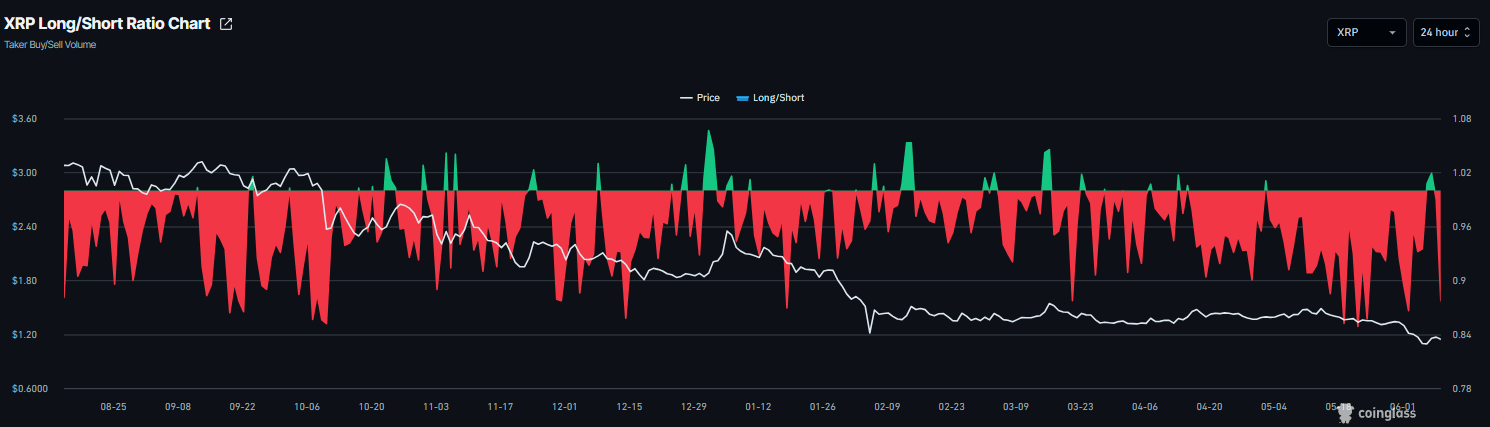
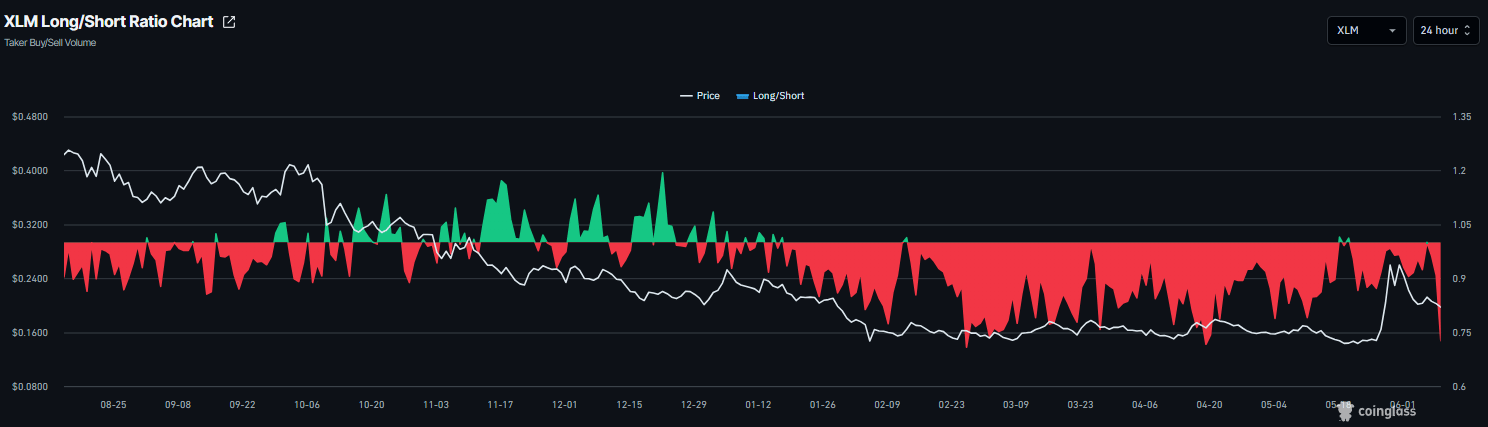
Derivatives data shows a bearish tilt. CoinGlass’ long-to-short ratio for both XRP and XLM read 0.87 and 0.73, respectively, on Tuesday, nearing their lowest levels in over a month. The ratio being below one, indicates bearish sentiment, as traders are betting the assets' prices will fall.
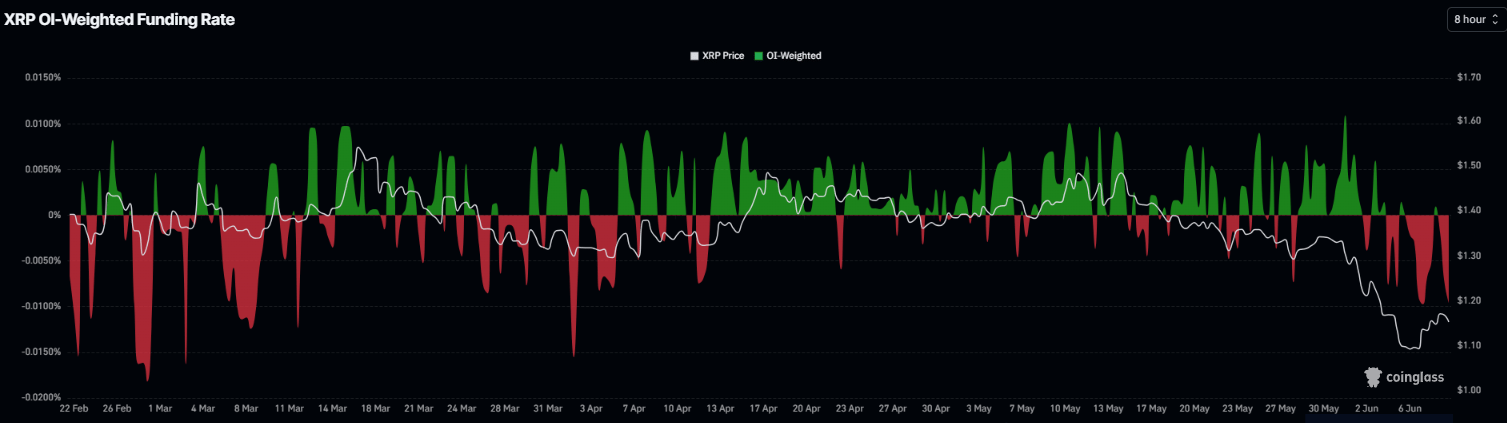
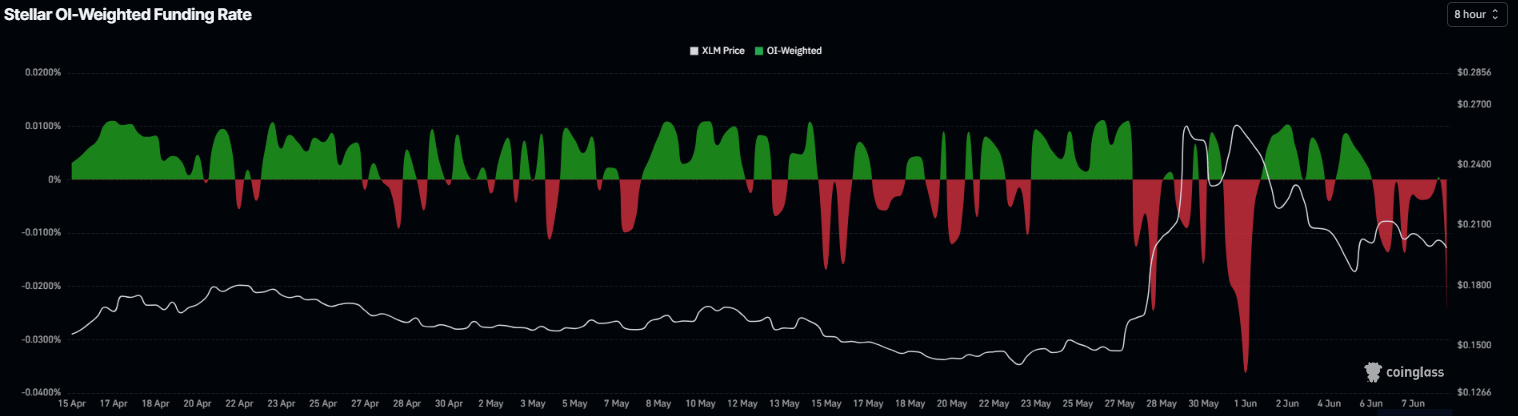
The funding rates also reflect a weakening outlook for both altcoins. XRP and XLM funding rates turned negative on Monday and continue to drift toward negative territory on Tuesday. These negative rates indicate that shorts are paying longs and project bearish sentiment.
Mixed outlook with a slight negative tilt
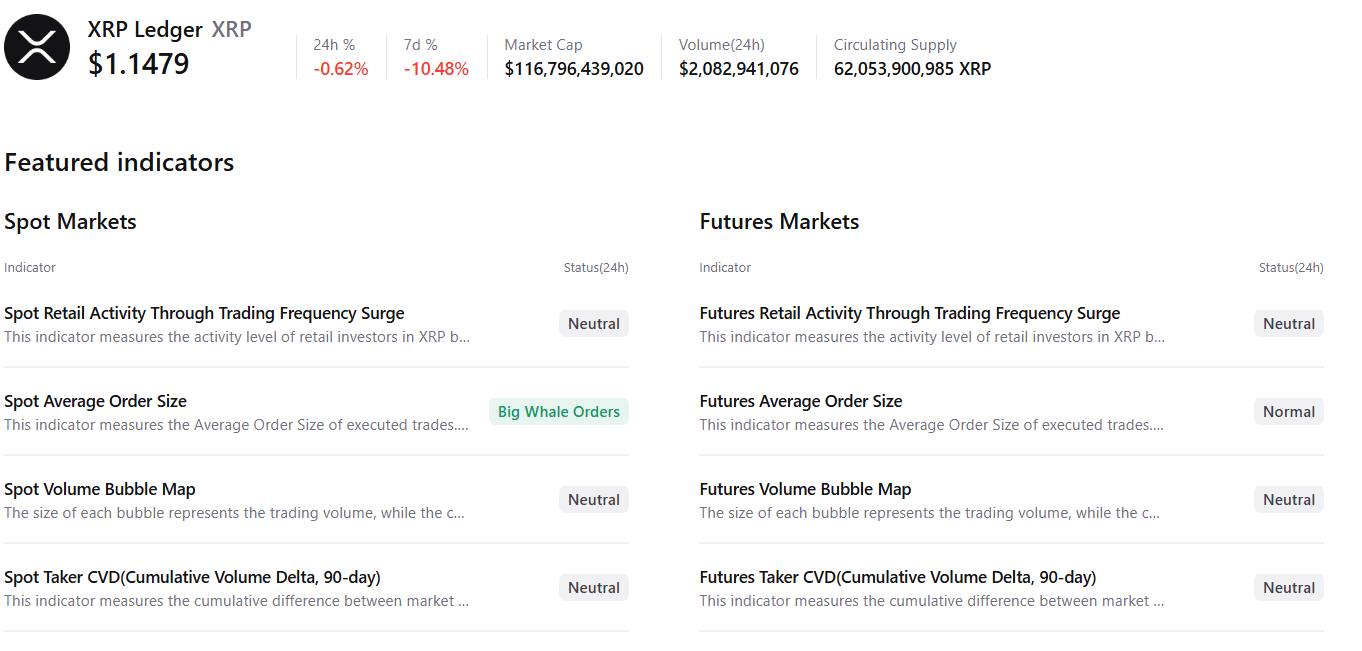
CryptoQuant’s summary data show mixed sentiment, with neutral to mildly bearish views among XRP and XLM traders. XRP’s spot markets show large whales' orders with neutral conditions in other metrics, supporting a potential recovery.
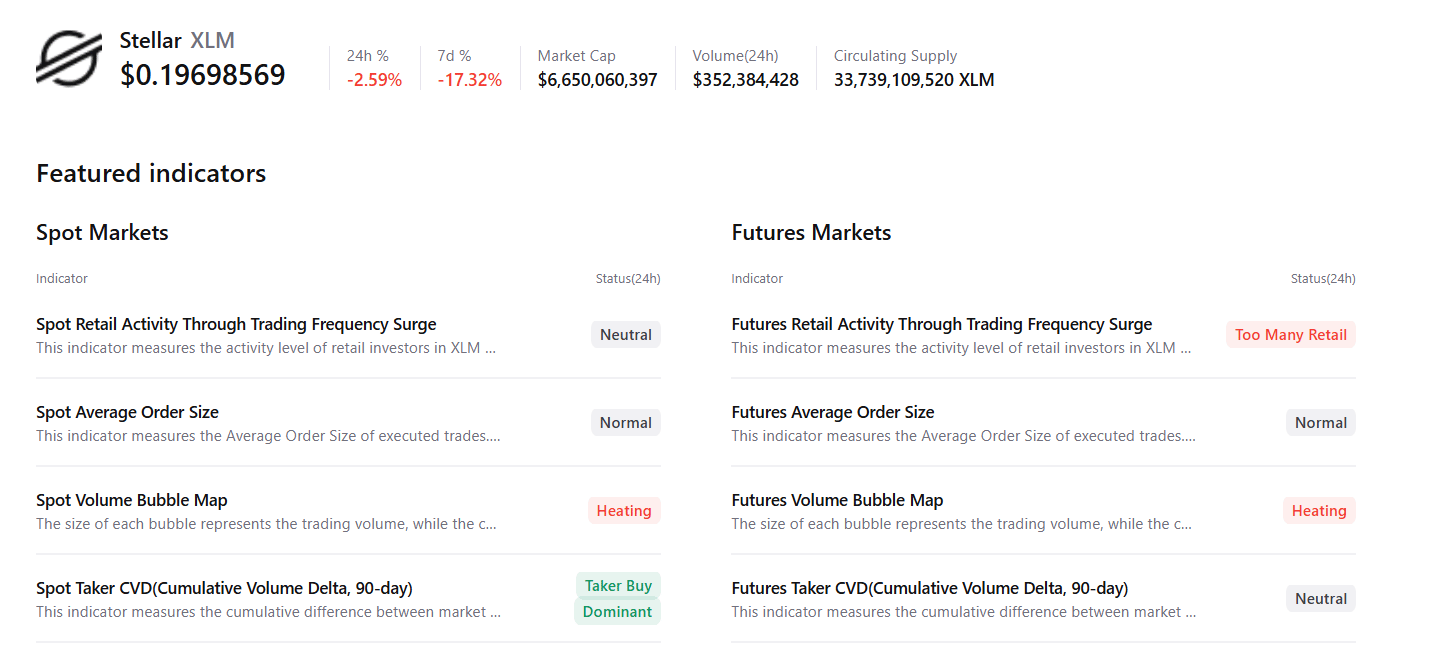
However, XLM shows a heating condition in the spot and futures markets, with rising retail activity and buy-side dominance, hinting at mildly bearish sentiment among traders and capping any potential recovery.
XRP technical outlook: Bearish momentum is still in play
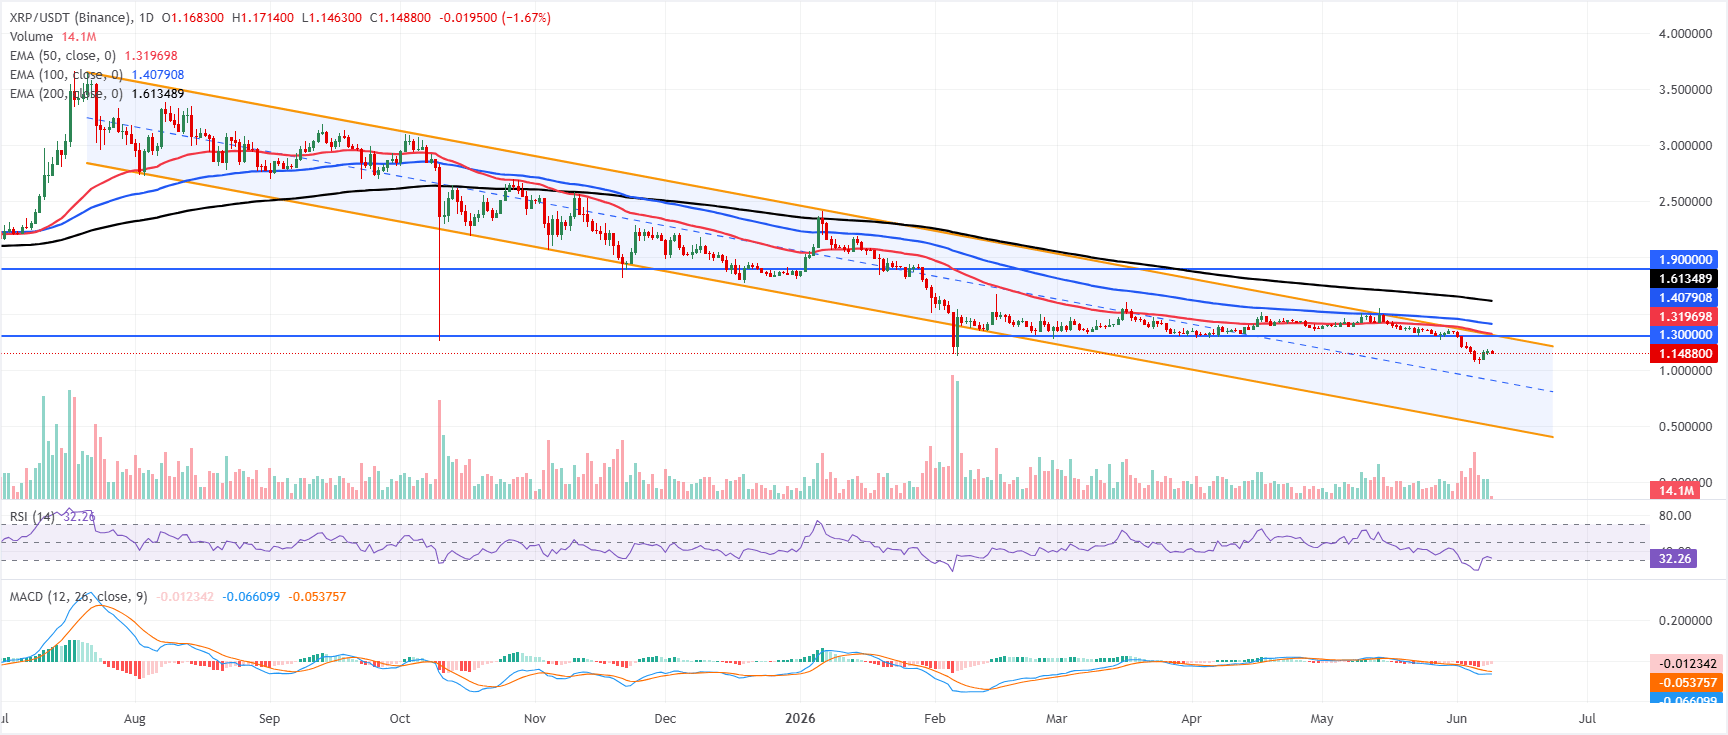
XRP trades at $1.148 on Tuesday, extending a bearish phase with price holding well below the 50-day, 100-day and 200-day Exponential Moving Averages (EMAs) at $1.319, $1.407 and $1.613. The sequence of descending EMAs above price reinforces a downside bias. At the same time, the Relative Strength Index (RSI) near 32 suggests conditions are approaching oversold but not yet providing a clear bullish trigger. The Moving Average Convergence Divergence (MACD) indicator remains below zero, with the MACD line negative, suggesting bearish momentum is still in play even if recent downside pressure appears less aggressive than in prior sessions.
On the topside, initial resistance is seen at the psychologically relevant horizontal level around $1.300, closely followed by the upper boundary of the descending parallel channel near $1.308 and the 50-day EMA at $1.319, forming a dense supply zone that would need to be reclaimed to ease immediate downside pressure. Above there, the 100-day EMA at $1.407 and the 200-day EMA at $1.613 act as higher-order barriers ahead of the longer-term horizontal resistance near $1.900; as long as price trades beneath this layered overhead structure, rallies are likely to be viewed as corrective within a broader bearish context.
XLM technical outlook: Fading upside momentum
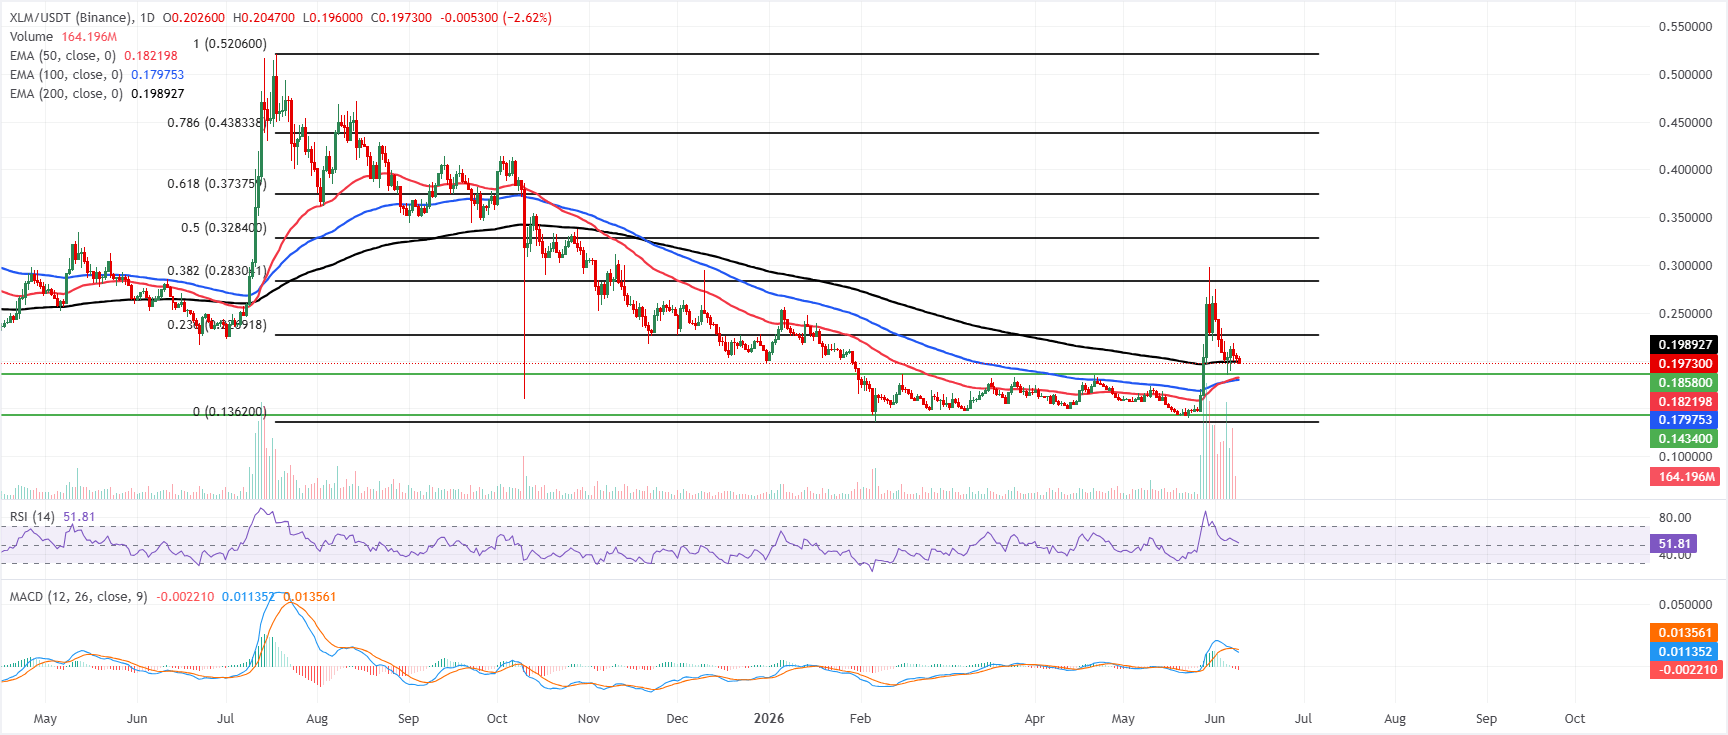
Stellar price trades at $0.197 on Tuesday. XLM holds above the 50-day and 100-day EMAs at $0.182 and $0.179, maintaining a neutral-to-slightly constructive tone, but is capped by the 200-day EMA at $0.198 just overhead. The RSI on the daily chart, at around 52, suggests balanced momentum following the recent spike. At the same time, the MACD has slipped below the zero line, suggesting that upside momentum is fading unless buyers can reclaim the longer-term average.
On the topside, immediate resistance is located at the 200-day EMA near $0.198, with the 23.6% Fibonacci retracement of the broader downswing at $0.226 as the next notable barrier if bulls extend the bounce.
On the downside, initial support aligns at the horizontal level around $0.185, followed by the 50-day EMA at $0.182 and the 100-day EMA at $0.179; a break below this cluster would expose deeper supports near $0.143 and the prior swing low around $0.136.
(The technical analysis of this story was written with the help of an AI tool.)

超过一百万用户依赖 FXStreet 获取实时市场数据、图表工具、专家洞见和外汇新闻。其全面的经济日历和教育网络研讨会帮助交易者保持信息领先、做出审慎决策。FXStreet 拥有约 60 人的团队,分布在巴塞罗那总部及全球各地区。
阅读更多


