
How to Use Heikin Ashi Candles & Strategy
There are many different methods for technical analysis. One of the most important ones is identifying market trends. However, spotting market trends can be challenging if you are a beginner or have yet to master market volatility. This is where indicators come into play, and in this article, we will break down the Heikin Ashi technique.
What is Heikin Ashi?
This term, derived from Japanese, means average bar. This indicator modifies how price values are displayed on a chart. To understand the Heikin Ashi formula a bit better, we have to understand the basics of Japanese candlesticks— a price chart showing opening, closing, high, and low price points for each period. For a refresher on chart basics, see how to read forex charts.
The candlestick’s upper wick or shadow represents the high, whereas the lower wick or shadow represents the low. The body of the candlestick represents the open and close. If you want patterns that can flag potential reversals, see reversal candlestick patterns.
Each candle reveals whether the price finishes the period lower or higher than when it began. If the close is lower than the opening, it signals downward pressure on the price. Hollow candlesticks suggest a bullish trend. The close being higher than the opening suggests upward pressure on the price.
However, in volatile markets, alternating bullish and bearish candles as the price oscillates can make it challenging to identify the trend. This is where the Heikin Ashi comes in handy. It modifies candlesticks to see trends using the average open, closed, highs and lows values. For trend-confirmation companions, consider RSI and MACD.
How do I use the Heikin Ashi strategy?
Traders get to set the time frame. If you want an hourly or daily time frame, set those options to obtain that period’s open, close, high and low. To keep trend context clear, pair Heikin Ashi with trend lines or momentum tools like RSI.
The best way to get familiar with indicators is to use them. TMGM provides live trading accounts and MT4 indicators and add-ons and MT5 indicators and add-ons platforms. If you’re still new, demo accounts are provided for risk-free trading.
Trends and patterns
A smoothing technique is utilized to make trends easier to spot. Prices can fluctuate regardless of present or missing trends. These mixed signals can confuse traders.
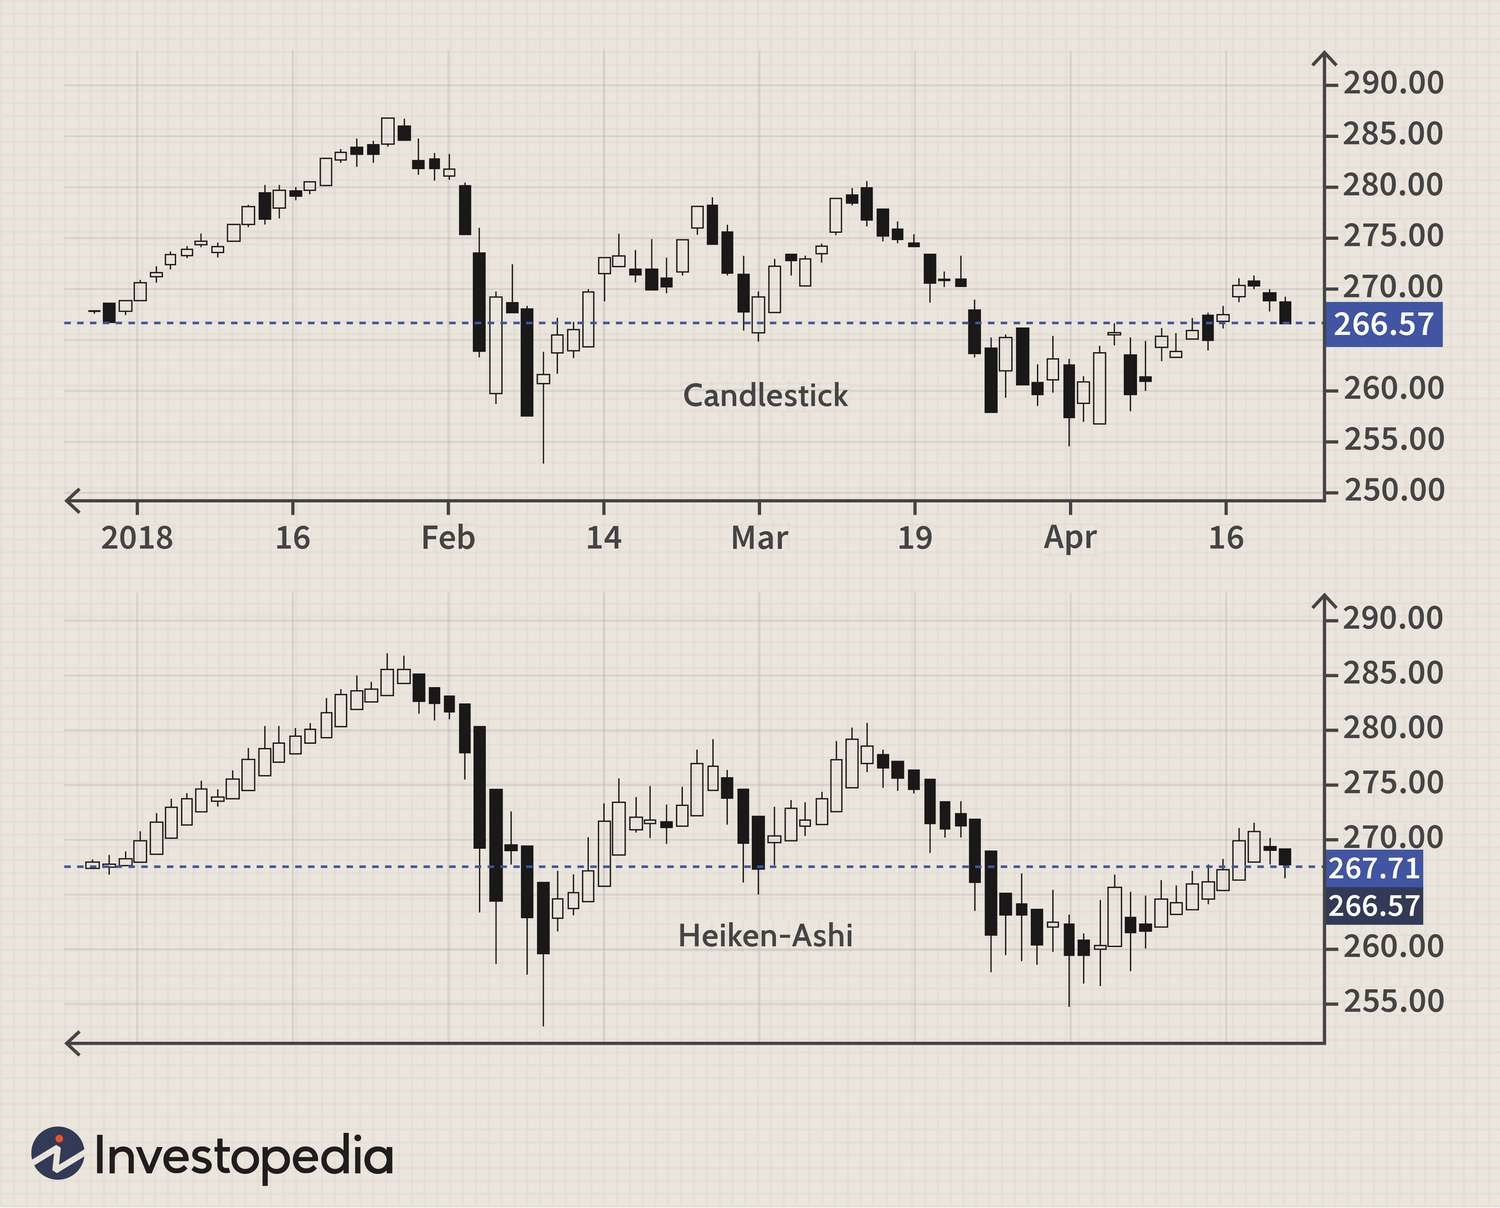
Averaging helps smooth out short-term price variations. Here’s an illustration of a chart with and without Heikin Ashi Candlesticks:
The Heikin Ashi looks smoother because it takes the average price movement. It also provides more consistent indicators of bullishness and bearishness. Heikin Ashi candlesticks tend to stay red during downtrends and green during uptrends; this differs from regular candlesticks, where colors alternate even if the price moves dominantly in one direction. For strategy context, see forex trading for beginners and forex trading strategies.
However, because Heikin Ashi takes the average, the current price of the candle may not match the current market price. To combat this, many charting platforms show dual prices on the Y-axis: Heikin Ashi and the current asset price. If you trade on desktop or mobile, compare chart views on MetaTrader 4 and MetaTrader 5.
Utilizing different indicators in our Trading Academy will strengthen a trader’s strategy and make it easier to analyze trends. If you’re interested in furthering your trading skills, head to our what is forex trading guide or browse related tools like the trading calculator.
今日更明智地進行交易


Frequently Asked Questions (FAQs) about Heikin Ashi Candles
How to use heiken ashi candles?
What is the best strategy for heiken ashi?
What is the 3 candle rule?
Do professional traders use Heikin Ashi?
What is the 3 5 7 rule in day trading?


賬戶
賬戶注資
交易


