


重點摘要
旗形型態屬於延續型態。 它表示當前趨勢將會延續,—而非反轉。
三段式結構: 旗桿(當前市場趨勢)→旗面(暫時性盤整)→突破。
多頭旗形 = 看漲延續。 形成於上升趨勢中,伴隨向下傾斜或水平整理通道。
空頭旗形 = 看跌延續。 形成於下降趨勢中,伴隨向上傾斜或水平整理通道。
旗形整理期間的成交量收縮是不可或缺的。 這可確認該停頓只是暫時性的,而非趨勢反轉。
突破時成交量再度放大,才可確認交易訊號。 低成交量突破屬於假突破訊號。
最低風險報酬比為 2:1。 若該型態未達此門檻,就應略過。
什麼是圖表型態交易中的旗形型態?
旗形型態 是一種延續型 圖表型態,顯示強勁趨勢在恢復原方向運行前的短暫停頓。交易中的旗形型態可用於辨識市場強勁動能下的進場點。
旗形圖表型態 在所有市場中都具有一致性,因此使 旗形型態 成為技術分析中最廣為人知的型態之一。
旗形型態的結構拆解
旗桿型態的三大核心組成
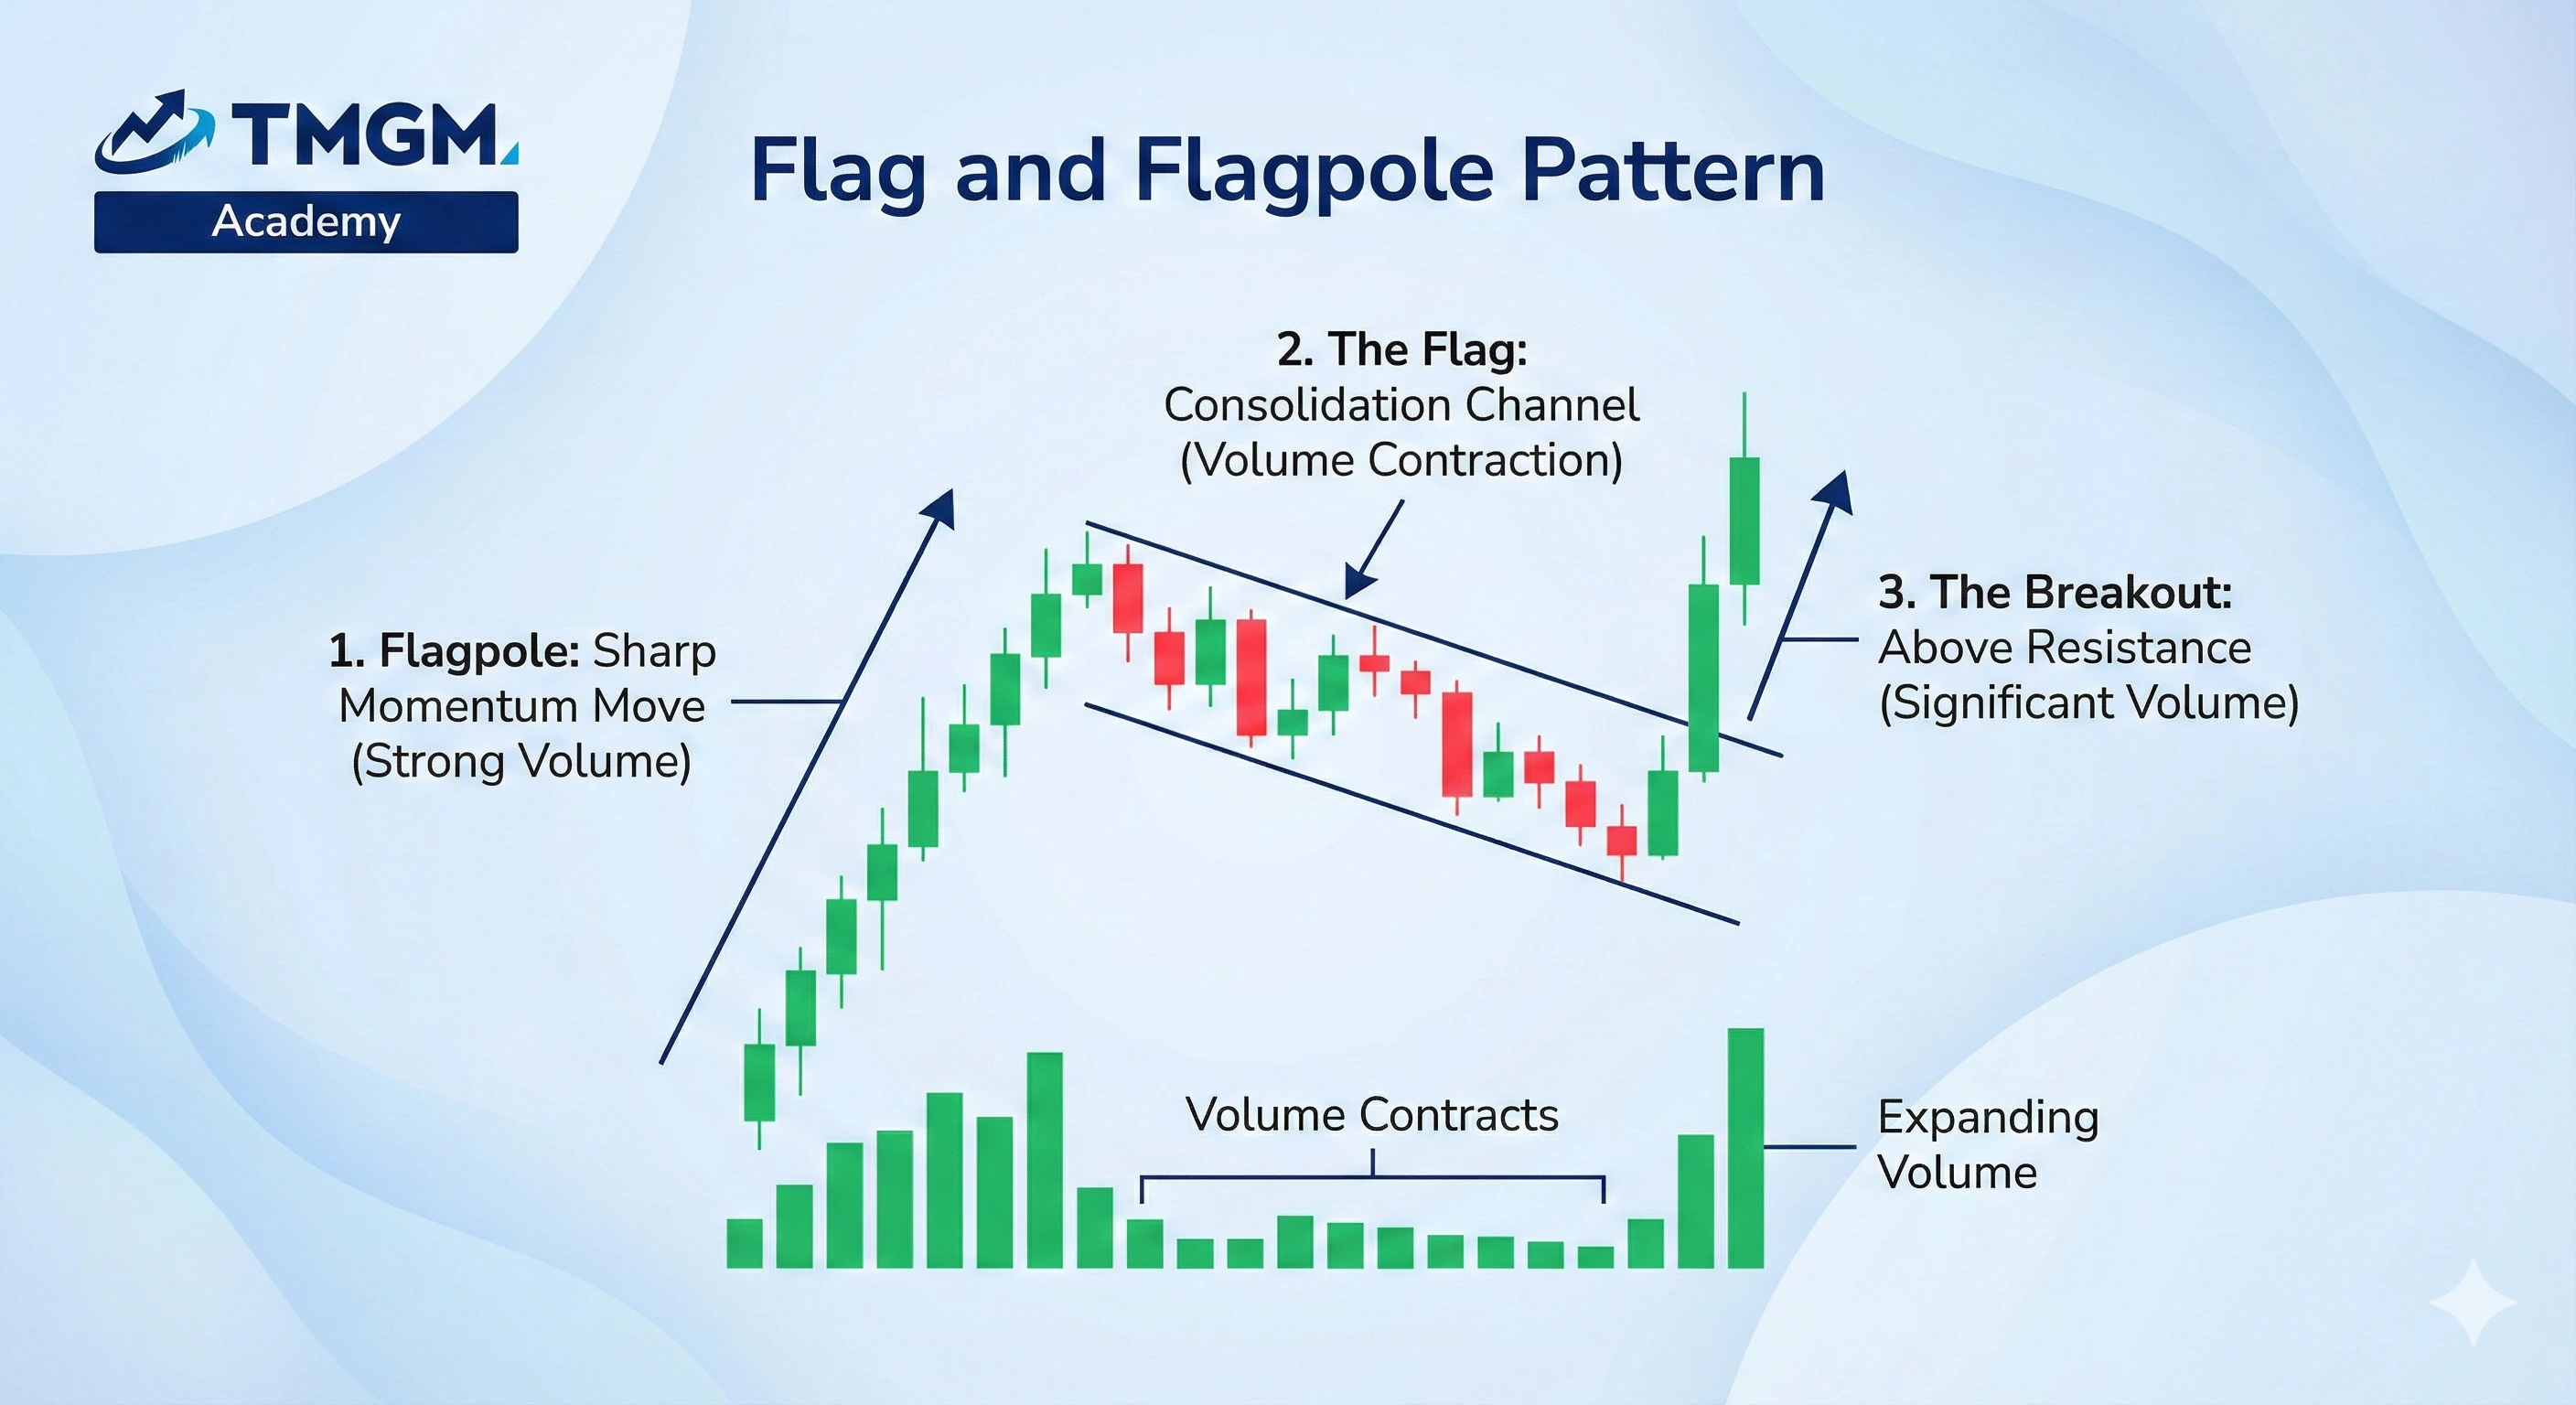
1. 旗桿
旗桿是界定旗桿與旗形型態的急速動能走勢。 通常走勢陡峭、快速,且有強勁成交量支撐。
2. 旗面(整理通道)
旗面是逆著趨勢方向傾斜、且成交量收縮的整理通道。
3. 突破
突破是第 3 個組成部分。 旗形型態最終一定會以突破作結,價格走勢會在顯著成交量配合下,收於旗形通道阻力位上方/下方’(與旗桿方向一致)。若突破發生在 低成交量下,便是危險訊號。
旗形型態為何形成—— 旗形型態背後的機制&與市場心理
旗形型態之所以形成,是因為市場經常以趨勢/動能推進,並在其間穿插回調停頓的循環方式運行。
強勁趨勢往往會形成快速推進的動能(構成旗桿),使早期獲利的交易者傾向獲利了結並離場。這會造成暫時性拋售,進而形成旗面。
當該回調結束後, 旗形型態 通常會伴隨成交量放大而突破。
簡而言之: 旗形型態反映的是買賣雙方拉鋸的行為。
深入說明:
在 旗桿階段,積極的買盤或賣盤會推動價格形成清晰且強勁的動能走勢,也就是趨勢。在初始動能建立後,散戶動能交易者往往會跟進,使旗桿更加明顯。
在 旗面階段,交易者會獲利了結並引發拋售。成交量也會收縮,因為在真正的旗形型態中,市場趨勢理應延續,反向興趣較低,因此來自相反趨勢的動能減弱,會表現在價格下跌且成交量同步下降(旗面)。市場是在重新平衡,而不是反轉。當平衡結束後, 旗形型態 便會伴隨成交量擴大而突破,趨勢隨之延續。
因此,旗面就是交易布局的窗口,交易者可以在旗面期間買入,或在突破後進場。
重要提示
旗形通常出現在趨勢中段,而非頂部或底部。 – [CME Group Education. 趨勢與延續型態。 CMEGroup.com]
旗形型態的類型
看漲旗形型態(Bull Flag Pattern)
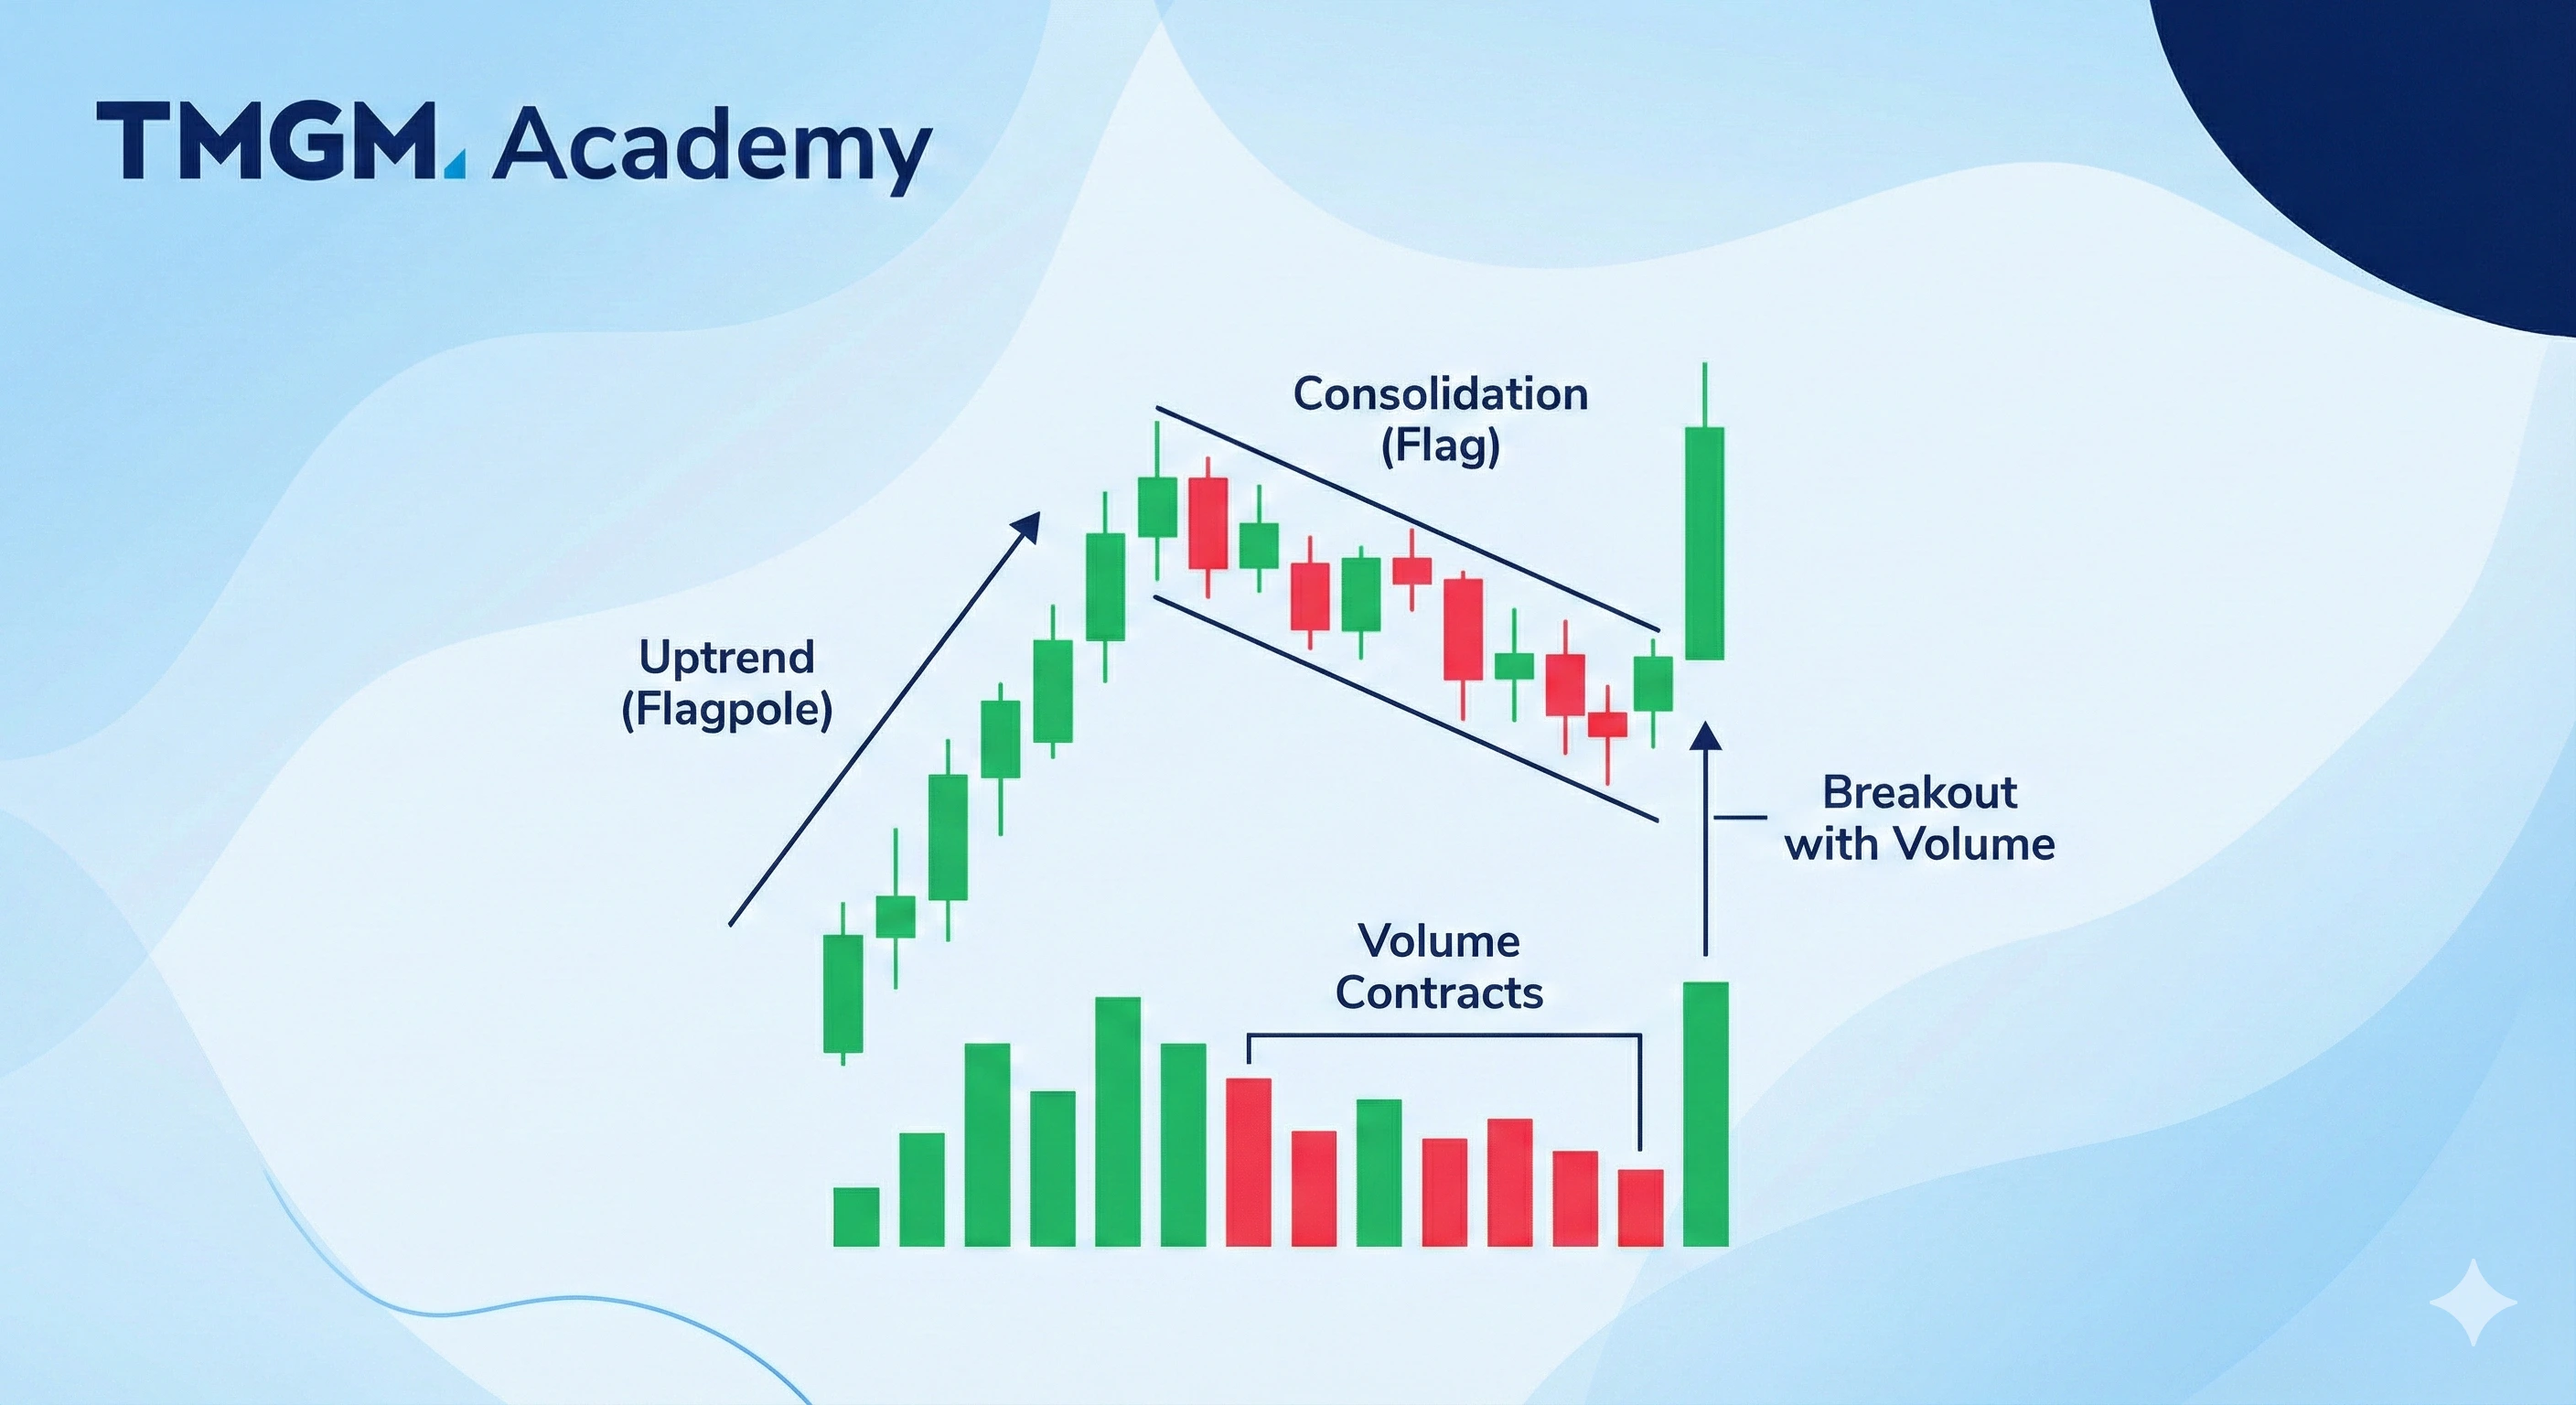
看漲旗形型態因強勁買盤動能而形成上升趨勢(旗桿)。 接著,旗面部分會在向下傾斜或水平通道中整理。旗面形成期間成交量會收縮。當價格在成交量擴大的情況下突破上方阻力時,該型態即告完成。
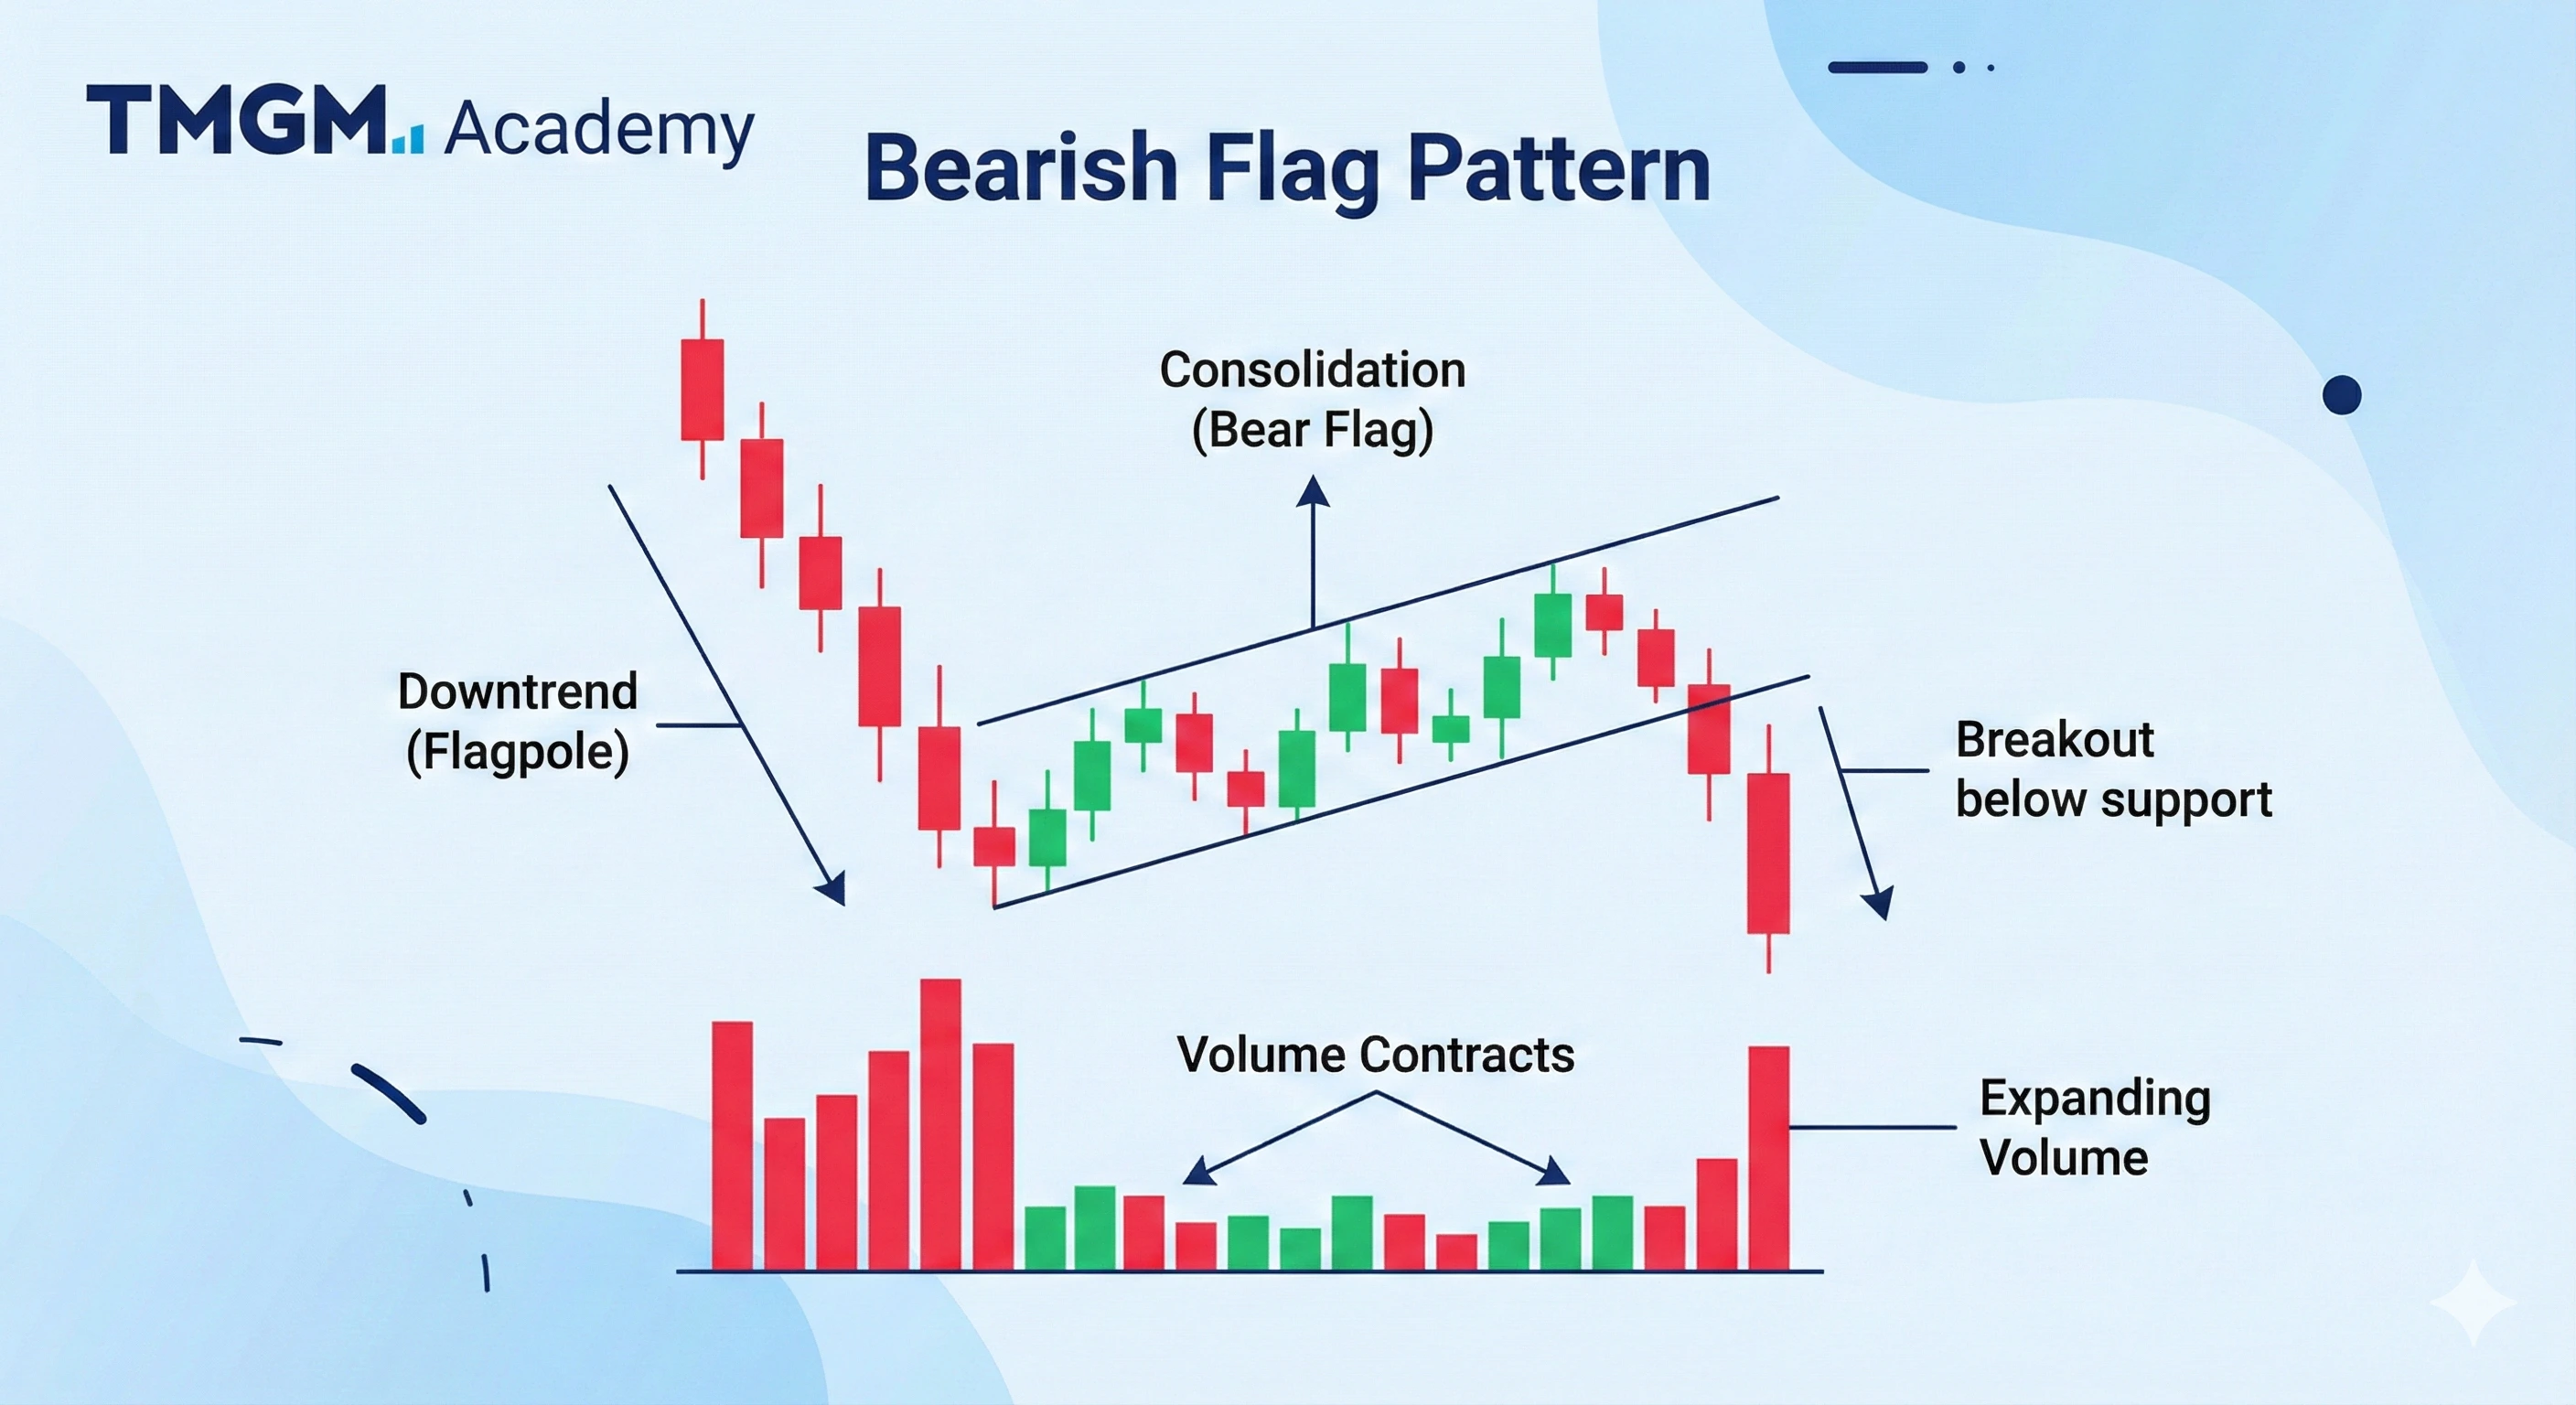
看跌旗形型態(Bear Flag Pattern)
看跌旗形型態因強勁賣壓動能而形成下降趨勢(旗桿)。接著 空頭旗形部分 會在受控通道中向上回抽,且旗面期間成交量收縮。當價格在成交量擴大的情況下跌破下方阻力時,該型態即告完成。
看跌旗形型態有時也被稱為倒旗形型態(Inverted Flag Pattern),這暗示看漲旗形型態較為常見,而看跌旗形型態則可視為其倒置版本。
如何交易旗形型態?旗形型態交易策略
旗形型態交易 包含三項關鍵決策:進場方式、止損設置,以及透過量度漲幅/跌幅(measured move)設定獲利目標。每一個有效型態都必須在下單前先明確定義這三者。
進場方式
回調進場(積極型): 當旗面部分建立明確支撐位時進場,
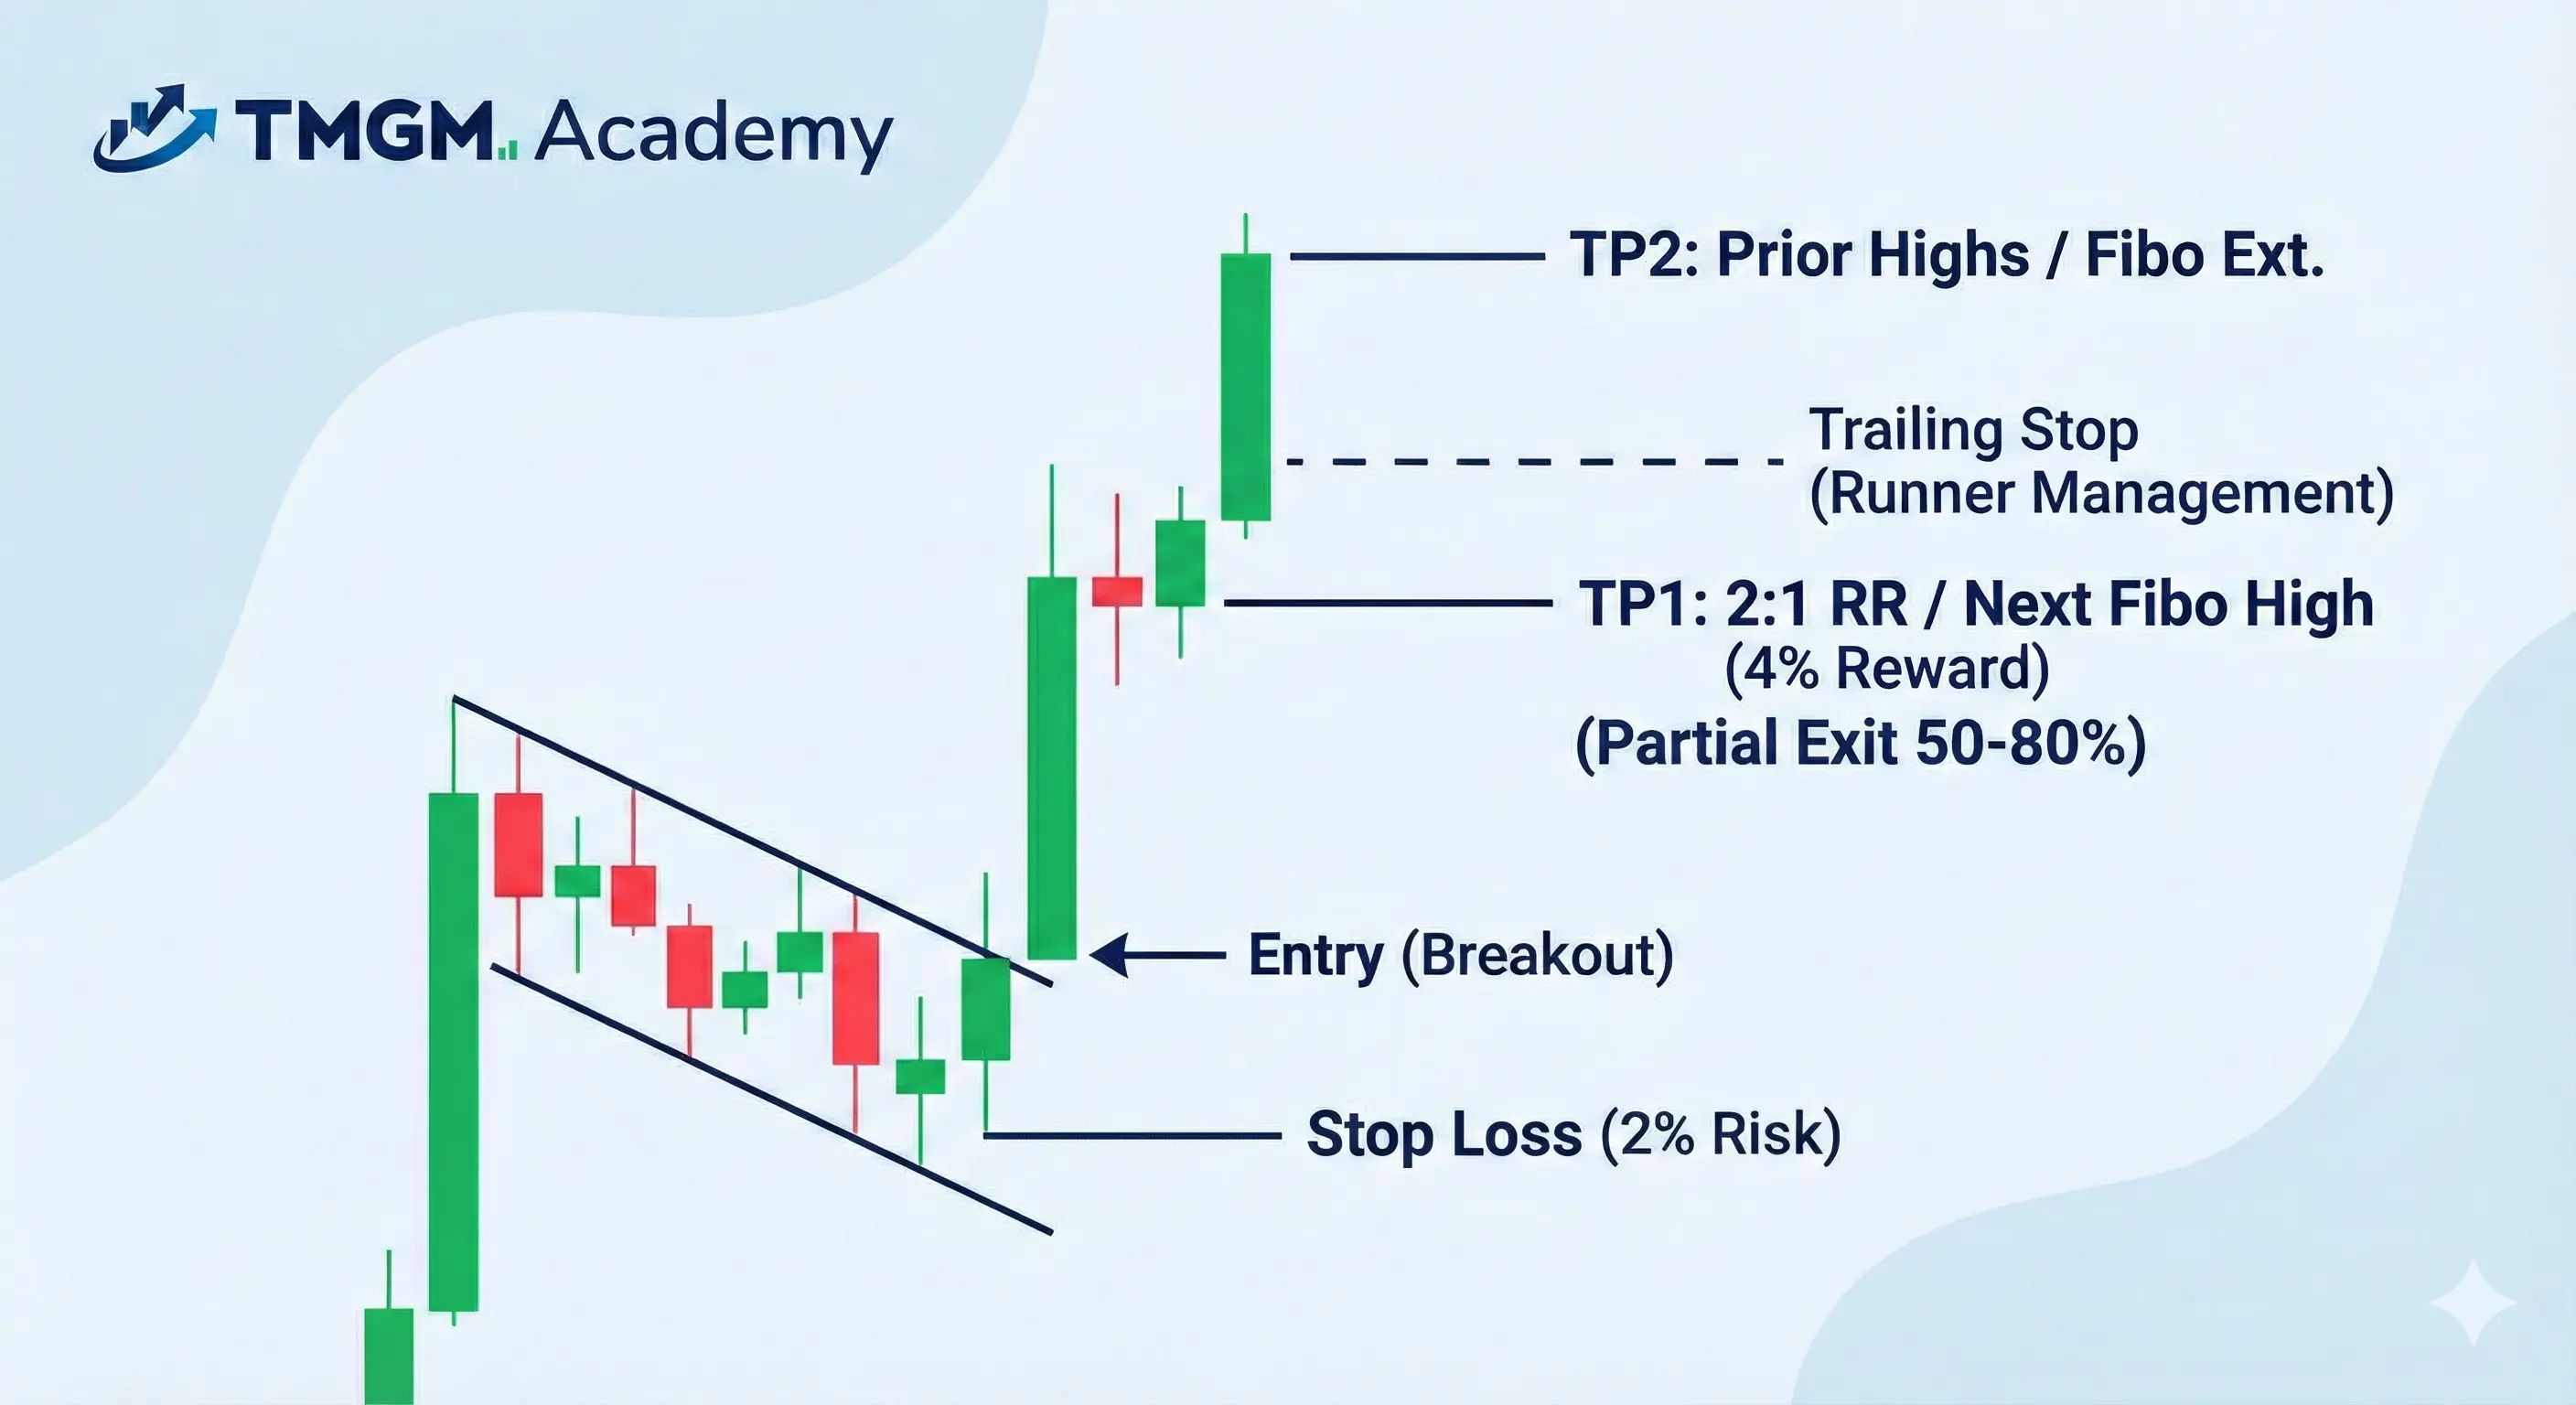
突破進場(經典型): 當價格突破並收於上方通道阻力位之上(若交易看漲旗形型態),或跌破下方支撐位(若交易看跌旗形型態)時進場。
回測進場(保守型): 等待突破K線收盤後,再於新建立支撐位的首次回測時進場。此策略以較低報酬換取更強確認,但多數交易者認為這樣的代價是值得的,因為確認訊號更強。
止損設置
結構性止損: 設於旗形最低點下方(看漲旗形型態)或最高點上方(看跌旗形型態)。
基於 ATR 的止損: 在波動較大的市場中,有些交易者會使用 1 ATR 作為止損距離,以涵蓋點差與滑點,避免過早被止損出場。
獲利目標
2:1 風險報酬比: 最經典的方式是依照你的風險報酬比(RRR)設定。若你的止損約為 2% 虧損,則報酬至少應達 4% 利潤,這筆交易才值得進行。2:1 RRR(風險報酬比)是經典、低風險且報酬適中的比例。
前高:另一種經典的止盈目標設定方式是以前高為基準。若你的資產並非處於價格發現階段,那麼以前高作為目標是合理的,因為那通常是自然的賣壓區。
斐波那契工具: 許多專業交易者常用的工具是斐波那契延伸(Fibonacci Extension)。斐波那契延伸可衡量下一個阻力位可能所在,你可以將止盈(TP)設在這些水準附近。
資深交易者的旗形止盈分批策略
TP1 基礎目標:將第一個止盈設在 2:1 風險報酬比或斐波那契止盈位
部分出場:在 TP1 平倉 50% 至 80%
TP2 延伸目標:將第二個止盈設在前高或斐波那契延伸位
剩餘倉位管理:保留其餘部位,並使用追蹤止損來捕捉動能延伸行情
旗形型態交易的風險管理
即使是結構上有效的型態,若缺乏紀律性的風險管理,長期下來最終仍可能讓你的虧損超過獲利。
風險管理框架
交易者在旗形型態中常犯的錯誤
大多數旗形型態交易錯誤可歸納為六類:交易疲弱的旗桿、在突破確認前進場、忽視成交量、在超低時間週期過度交易微型旗形、設定含糊的目標,以及忽略如預設止損等基本風險控管。
疲弱的旗桿: 若初始趨勢走勢過於平緩,或缺乏動能與成交量支撐,就應略過。
未檢查成交量: 應將成交量視為確認條件,而非可有可無。
微型時間週期: 1 分鐘旗形大多只是雜訊,成交量訊號也不可靠。
出場不明確: 應在進場前規劃好止盈水準,而不是等價格移動後才決定。
沒有止損: 每一筆交易都需要預先設定出場水準。
結論—— 旗形型態可靠嗎?
若能在趨勢市場中正確運用,旗形型態是技術分析中勝率最高的延續型態之一 —。其結構客觀、風險明確,且目標可量化。
其可靠性取決於四項因素:動能強度、旗面期間的成交量收縮、突破時的成交量擴張,以及更高時間週期的一致性。符合這四項條件的 看漲旗形型態 或 看跌旗形型態 ,都屬於高品質交易機會。若缺少其中任何一項,風險都會顯著提高。
能夠培養紀律、略過不符合結構條件型態的交易者—,尤其是在低流動性或區間震盪環境中—,將會發現 旗形型態交易 是一種可持續、可重複運用,且適用於各類市場與時間週期的交易優勢。


