


What is the FTSE 100 Index?
Owned by the London Stock Exchange Group, the FTSE 100 index is the United Kingdom’s most well-known stock market index of the 100 biggest companies by market capitalization listed on the London Stock Exchange.
Managed by the FTSE Group, prices are updated every 15 seconds from 8 a.m. to 4:30 p.m. UK time. The UK FTSE 100 index operates similarly to US stock market indexes like the Dow Jones 30.
The index price is calculated by weighing all stocks listed on the London Stock Exchange by market capitalization. The top 100 companies with the highest market capitalization enter the index. Here are key things to keep in mind:
Stocks with higher market caps carry more weight in the index, significantly influencing price movements.
So, when the index rises, it means the total worth of companies is increasing.
When the index rises, it does not mean all companies have rising market capitalization.
How to Trade the FTSE 100 Index
Open an account with a credible trading platform. Platforms such as TMGM offer MetaTrader4 (MT4) and MetaTrader5 (MT5), where users can track the performance of the FTSE 100 index, invest in exchange-traded funds, or trade contracts for differences (CFDs) on the FTSE 100 index.
For those who feel hesitant, try a demo account for risk-free trading.
Choose your preferred instrument.
With CFDs, you can trade on the FTSE 100 index, global stock market indices, currencies and over 200 of the UK’s largest companies.
ETFs track the performance of the FTSE 100 index and allow you to invest in over 300 of the UK’s largest companies.
Begin trading. If you want to add the FTSE 100 index to your portfolio, click here to start an account.
FTSE 100 Companies
Established in 1984 by the Stock Exchange to replace the Financial Times’ own FT 30, the FTSE 100 index better reflects market activity. Over the years, the list of companies has changed with fluctuating market capitalization and mergers. Not all 100 companies are British, as the index is not required; however, many are foreign-based.
Here are some of the FTSE 100 companies on the index:
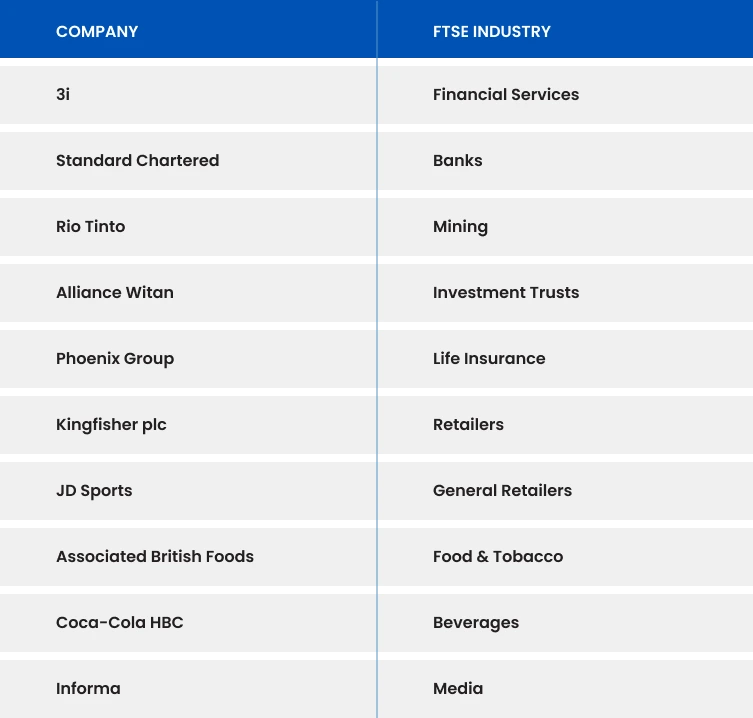
To check out the complete list, head on to the London Stock Exchange website.
Getting started with a FTSE 100 Trading Strategy
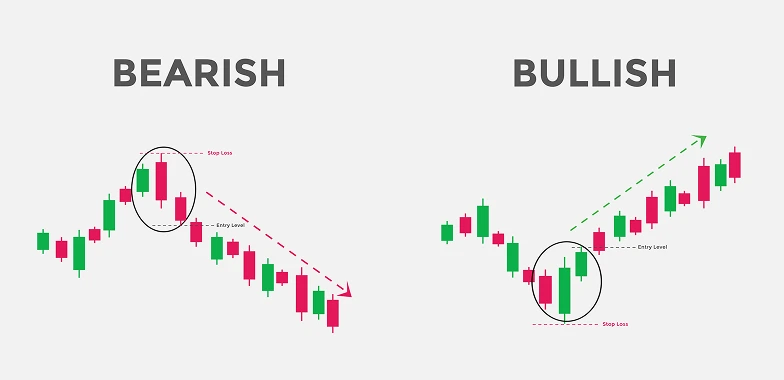
Often, traders use technical analysis price action patterns as a strategy for trading the FTSE 100. They identify areas to buy and sell. One of the more popular price action patterns is the engulfing candlestick pattern:
Bearish engulfing candlestick pattern
This is a candlestick formation in which the current candlestick's body completely buries the previous one's body. This chart pattern signals a reversal in an upward price trend. It also indicates that the prior ascending trend is losing momentum, and a reversal is looming.
Bullish engulfing candlestick pattern
This pattern is a white candlestick that closes higher than the previous day’s opening after opening lower than the previous day’s close. A reversal pattern signals a potential shift from a downtrend to an uptrend.
However, like any technical analysis, it does not guarantee results. Thus, traders should combine the analysis with other indicators and manage their risks.
What moves the FTSE 100 Index?
The economy and politics are the main factors that move the FTSE 100 Index. During periods of economic expansion, stock markets tend to rise. This leads to higher employment rates, consumer spending and more profit for companies. If a company makes more profits, it will attract more investors and boost the stock market. Investors pay attention to multiple factors:
Inflation rates
Employment rates
Interest rates
Consumer spending figures
Currency movement
Traders often stay updated on UK-related financial and breaking news. It can be challenging to trade unexpected news announcements, so it’s important to have the right trading tools. TMGM provides a transparent trading environment and access to hundreds of products across six asset classes. If you want to learn more, click here.


