


MACD 是什麼?
MACD 是 Moving Average Convergence Divergence,也就是平滑異同移動平均線,用來判斷趨勢方向、動能強弱與買賣時機。它的核心邏輯是比較兩條不同週期的指數移動平均線 EMA 的差距,再把差距平滑化後,轉成更容易判讀的快線、慢線與柱狀圖。
MACD 主要有三個用途:
看趨勢方向
看動能強弱
看交叉與背離訊號
MACD 屬於趨勢追蹤型指標,在趨勢明顯時通常比盤整行情更有參考性。
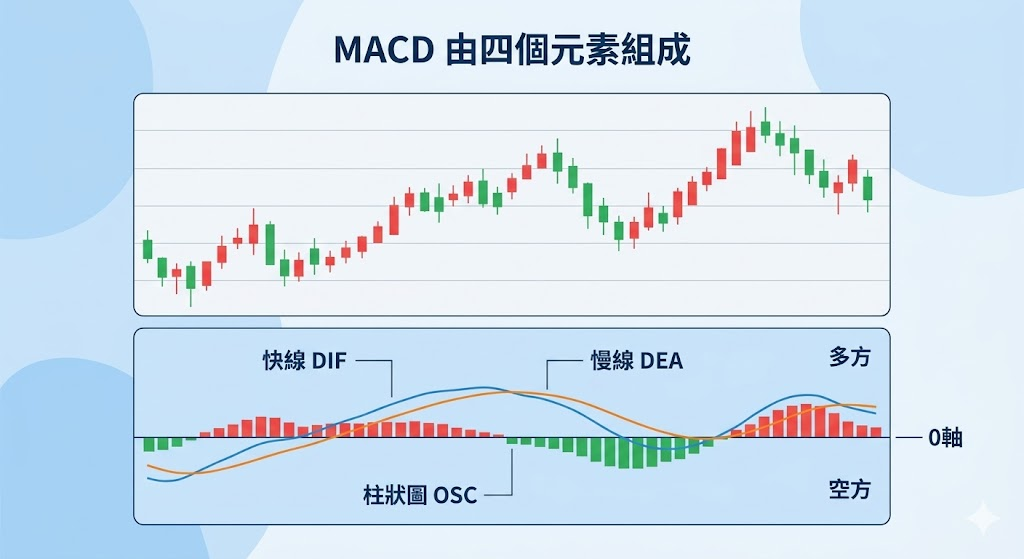
快線(DIF)
快線(DIF)是短期 EMA 與長期 EMA 的差值,反應速度較快。當短期 EMA 高於長期 EMA 時,DIF 會往上;當短期 EMA 低於長期 EMA 時,DIF 會往下。多數圖表軟體會把 DIF 顯示為紅線或白線,用來觀察短期動能是否正在轉強或轉弱。
慢線(DEA)
慢線(DEA)是 DIF 的平均線,反應速度較慢。因為 DEA 是把 DIF 再做一次平滑處理,所以它的波動通常比 DIF 小,主要作用是過濾雜訊,讓交叉訊號更清楚。多數圖表軟體會把 DEA 顯示為黃線或藍線。
柱狀圖(OSC)
柱狀圖(OSC)是 DIF 與 DEA 的差值,柱狀長短代表趨勢強度。柱體變長,代表快線與慢線的差距正在擴大,原本趨勢的動能正在增強;柱體縮短,代表兩線差距正在收斂,原本趨勢的動能正在減弱。若紅柱縮短,通常代表多方動能減弱;若綠柱縮短,通常代表空方動能減弱,買力可能開始回升。
零軸(0軸)
零軸(0軸)是 MACD 的多空分界線。快線與慢線位在 0 軸上方,通常代表市場偏多;快線與慢線位在 0 軸下方,通常代表市場偏空。0 軸的作用不是單獨給進出場點,而是先幫交易者判斷大方向。
MACD 怎麼看?
MACD 怎麼看,先看 DIF 快線、DEA 慢線、柱狀圖和 0 軸各代表什麼,再用黃金交叉、死亡交叉、0 軸位置和背離來判斷買點、賣點與趨勢轉折。判讀時不要只看單一交叉,還要一起看交叉發生的位置、柱狀圖的變化,以及價格與指標是否同步。
MACD 怎麼看買點和賣點?
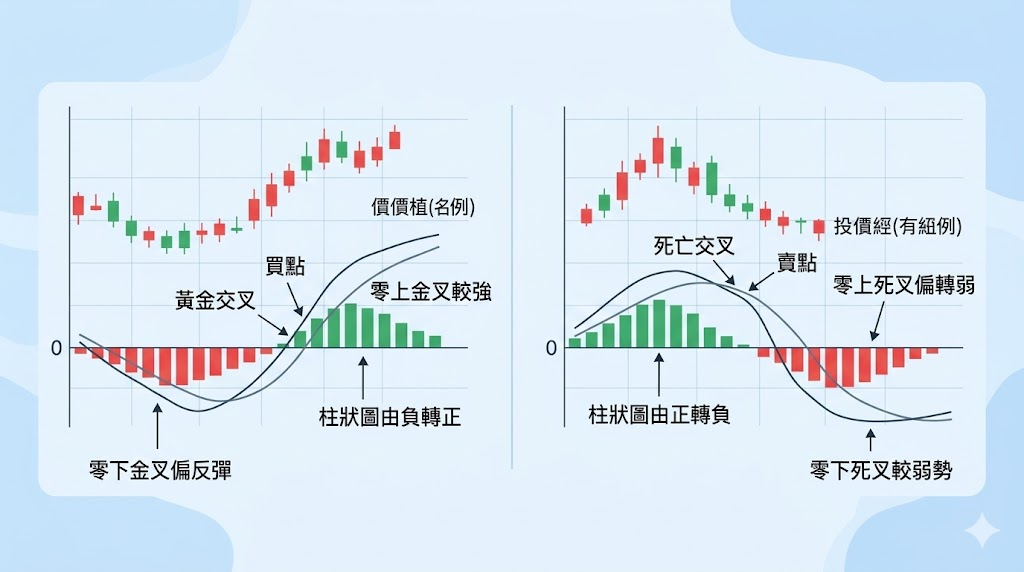
MACD 看買點和賣點,重點是先看交叉方向,再看交叉發生在 0 軸上方還是下方。0 軸上方的黃金交叉,通常比 0 軸下方的黃金交叉更強;0 軸下方的黃金交叉,常見於跌深反彈,不一定代表空頭已經結束。相反地,0 軸下方的死亡交叉通常比 0 軸上方的死亡交叉更弱勢,而 0 軸上方的死亡交叉常先視為多頭中的回檔警訊。
MACD 黃金交叉是什麼?
MACD 黃金交叉是 DIF 由下往上穿過 DEA,通常視為偏多訊號。當黃金交叉出現時,柱狀圖常會由負轉正,代表短期動能開始強於中期動能。若黃金交叉出現在 0 軸上方,通常屬於順勢偏多訊號;若黃金交叉出現在 0 軸下方,通常先視為反彈訊號,強度相對較弱。
MACD 死亡交叉是什麼?
MACD 死亡交叉是 DIF 由上往下跌破 DEA,通常視為偏空訊號。當死亡交叉出現時,柱狀圖常會由正轉負,代表短期動能開始弱於中期動能。若死亡交叉出現在 0 軸下方,通常屬於順勢偏空訊號;若死亡交叉出現在 0 軸上方,通常先視為轉弱警訊,不一定等於多頭已經完全結束。
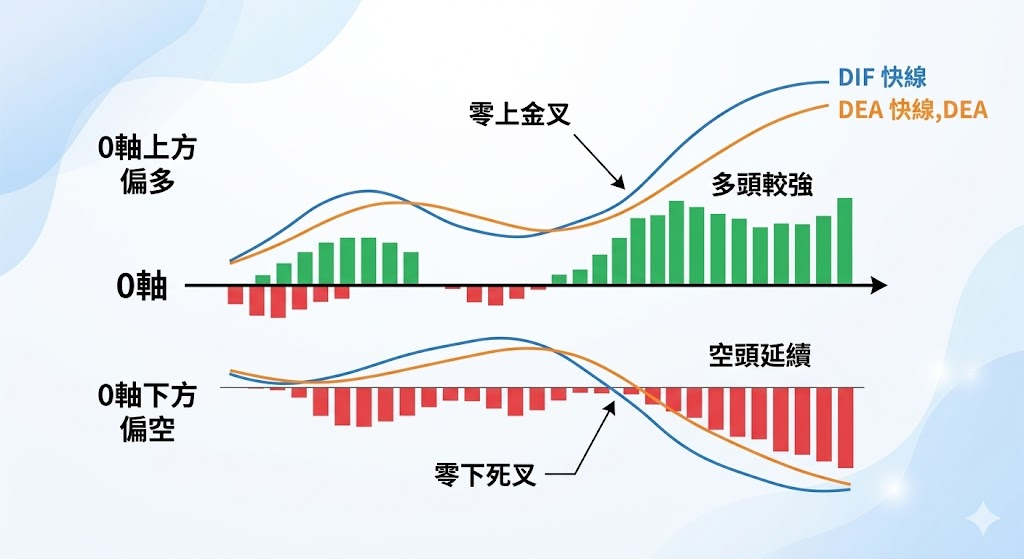
MACD 0軸怎麼看?
MACD 0 軸是多空分界線,快慢線在 0 軸上方通常代表偏多,在 0 軸下方通常代表偏空。當快線與慢線長時間都在 0 軸上方時,市場通常處於多頭結構;當兩線長時間都在 0 軸下方時,市場通常處於空頭結構。實戰上,零上金叉通常比零下金叉更強,零下死叉通常比零上死叉更弱勢。
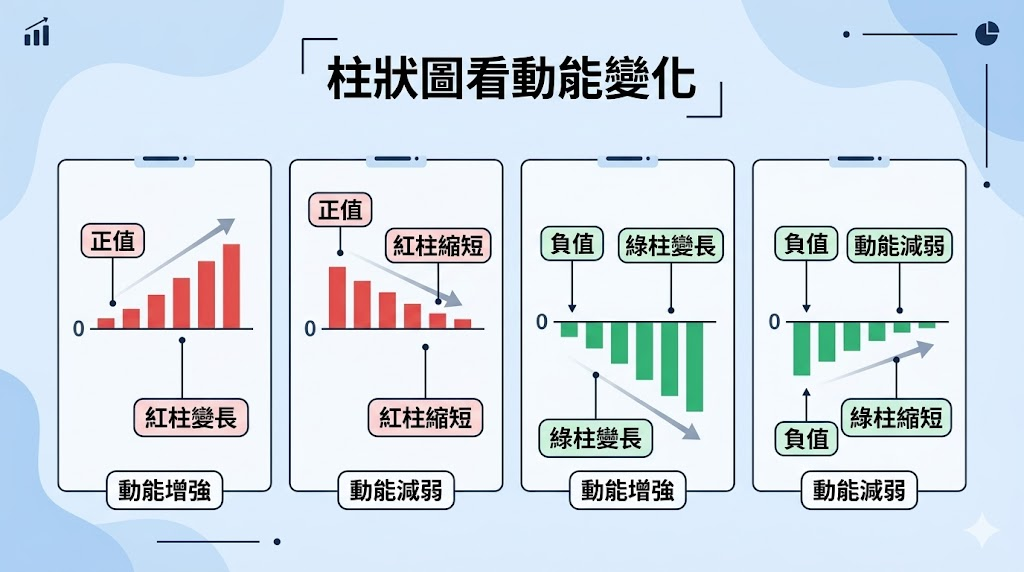
MACD 柱狀圖怎麼看?
MACD 柱狀圖變長代表動能增強,柱狀圖縮短代表原本的趨勢動能正在減弱。柱狀圖在 0 軸上方,代表 DIF 高於 DEA,市場偏多;柱狀圖在 0 軸下方,代表 DIF 低於 DEA,市場偏空。紅柱變長,通常代表多方動能增強;紅柱縮短,通常代表多方動能減弱。綠柱變長,通常代表空方動能增強;綠柱縮短,通常代表空方動能減弱,反彈機率提高。不同平台的紅綠顏色可能不同,所以判讀重點要放在正負與長短,不要只看顏色。
MACD 背離怎麼看?
MACD 背離是價格創新高或創新低,但 MACD 沒有同步創高或創低,代表原本趨勢的動能正在轉弱。背離的重點是動能變弱,不代表價格一定會立刻反轉,所以不能只靠一次背離就直接判斷頂部或底部。較穩的做法,是把背離和支撐阻力、K 線型態或成交量一起看。頂背離出現後,價格可能先橫盤再下跌;底背離出現後,價格可能先止跌再反彈。
MACD 高檔背離是什麼?
MACD 高檔背離是價格創新高,但 MACD 沒有同步創新高,通常代表上漲動能轉弱。這種情況表示價格還在往上,但指標已經沒有同步增強,多頭力道開始減弱。若後續再出現死亡交叉、壓力區轉弱或反轉 K 線,高檔背離的賣出警訊通常會更明確。
MACD 低檔背離是什麼?
MACD 低檔背離是價格創新低,但 MACD 沒有同步創新低,通常代表下跌動能轉弱。這種情況表示價格雖然還在下跌,但空方力道已經沒有前一波強。若後續再出現黃金交叉、支撐區止跌或反轉 K 線,低檔背離的反彈訊號通常會更完整。
MACD參數怎麼設定?
MACD 預設參數通常設定為 12、26、9。這三個數值分別代表短期 EMA 週期、長期 EMA 週期,以及 DEA 的平滑週期,也是多數交易平台的預設值。
12 代表短期 EMA 週期
26 代表長期 EMA 週期
9 代表 DEA 的平滑週期
預設參數 12、26、9 常見,因為它在不同市場與週期下都具備一定的通用性。參數越短,訊號通常越快,但雜訊也會更多;參數越長,訊號通常越慢,但走勢會較平滑。MACD 沒有一組適用所有市場的最強參數,較穩的做法是先用預設值,再依商品波動性與交易週期微調。
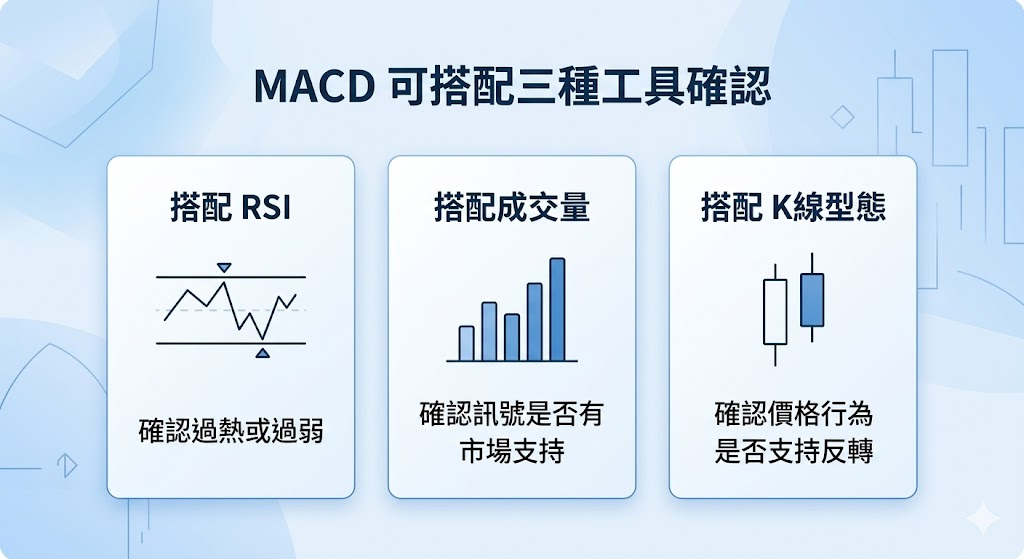
MACD 可以搭配哪些指標一起看?
MACD 可以搭配 RSI、成交量與 K 線型態一起看,因為這樣通常更容易確認訊號強弱並降低假訊號。MACD 本身擅長看趨勢與動能,但它屬於趨勢追蹤型指標,若只單看 MACD,在盤整行情中容易被反覆交叉洗掉。
MACD 和 RSI 有什麼差別?
MACD 主要看趨勢方向與動能變化,RSI 主要看相對強弱,以及是否接近超買或超賣。MACD 較適合判斷趨勢延續或轉弱,RSI 較適合判斷短期是否漲多或跌深。簡單說,MACD 比較適合看方向,RSI 比較適合看當下是否過熱或過弱。
MACD 和 RSI 可以怎麼搭配使用?
MACD 和 RSI 可以先用 MACD 判斷市場方向,再用 RSI 確認價格是否已經過熱或過弱。當 MACD 出現黃金交叉,且 RSI 尚未進入明顯超買區時,偏多訊號通常較完整;當 MACD 出現死亡交叉,且 RSI 回到弱勢區時,偏空訊號通常較明確。這種搭配方式的核心不是讓 RSI 取代 MACD,而是用 RSI 幫忙過濾追高或殺低的風險。
MACD 搭配成交量可以確認什麼?
成交量可以確認 MACD 訊號是否有市場支持。MACD 黃金交叉若伴隨成交量放大,訊號通常更可靠;MACD 死亡交叉若伴隨成交量放大,訊號通常更有說服力。相反地,若 MACD 出現訊號但成交量沒有明顯配合,代表市場參與度不足,訊號可信度通常較低。
MACD 搭配 K 線型態可以確認什麼?
K 線型態可以確認 MACD 訊號是否有價格行為支持。MACD 黃金交叉若搭配偏多 K 線型態,買點訊號通常更完整;MACD 死亡交叉若搭配偏空 K 線型態,賣點訊號通常更明確。MACD 背離若搭配反轉 K 線型態,趨勢轉折訊號通常也會更可靠。


