
Trade The World
Bitcoin Price Forecast: BTC drops below $90,000 as sell-off intensifies
作者 Manish Chhetri
發布日期: 18 Nov 2025 | 修改日期: 18 Nov 2025


POPULAR ARTICLES

Bitcoin (BTC) price slips below $90,000 at the time of writing on Tuesday, deepening its ongoing correction after last week’s sharp decline.
- Bitcoin price extends its correction, trading below $90,000 on Tuesday following last week’s steep decline.
- US-listed spot ETFs record an outflow of $254.54 million on Monday, extending last week's withdrawals.
- On-chain metrics point to further downside, with rising reserves on exchanges, increasing deposit volume, and higher net exchange flows signaling mounting sell pressure.
Bitcoin (BTC) price slips below $90,000 at the time of writing on Tuesday, deepening its ongoing correction after last week’s sharp decline. The institutional demand also supports a bearish outlook as US-listed spot Bitcoin Exchange Traded Funds (ETFs) recorded $254.54 million in outflows on Monday, extending the persistent wave of withdrawals. On-chain indicators further support the bearish view, with rising exchange reserves, growing deposit volumes, and higher net exchange flows suggesting increased sell-side pressure.
ETF flows show ongoing weakness for Bitcoin
Bitcoin institutional demand continued to weaken. SoSoValue data shows that spot Bitcoin ETFs recorded an outflow of $254.51 million on Monday, continuing the four-day streak of outflow since November 12, after a total outflow of $1.11 billion since last week. If these outflows continue and intensify, BTC could extend its ongoing price correction, suggesting declining institutional confidence.

On-chain data further supports a bearish
On-chain data for Bitcoin shows that BTC has not yet found the bottom and has more downside room.
The graph below shows that the Average BTC Deposit Volume has surpassed 0.9 on Tuesday, signaling rising selling pressure. Historically, when Binance’s average deposit volume increased, Bitcoin’s price tended to react negatively.

Adding to the bearish outlook, the Binance Exchange Reserves have exceeded 580,000 BTC. When Bitcoin builds up on exchanges, it generally signals growing sell pressure, especially when demand is too weak to absorb the supply, as reflected by ongoing ETF outflows. This dynamic has acted as a bearish force recently, as rising Binance reserves have coincided with continued price weakness.

Moreover, the Net Exchange Flows metric continues to reflect bearish sentiment, with inflows surpassing 5,000 BTC on Monday — the strongest single-day sell pressure since mid-August.

Bitcoin Price Forecast: BTC bears aiming for $85,000 mark
Bitcoin price faced rejection at the 38.20% Fibonacci retracement level at $106,453 (drawn from the April 7 low of $74,508 to the all-time high of $126,299 set on October 6) last week and declined nearly 10%. On Monday, BTC declined and closed below the key support at $94,253. At the time of writing on Tuesday, BTC extends its losses, trading below $90,000.
If BTC continues its correction, it could extend the decline toward the next key support at $85,000.
The Relative Strength Index (RSI) on the daily chart is at 26, reinforcing the strong bearish momentum and signaling that BTC remains in deeply oversold conditions.
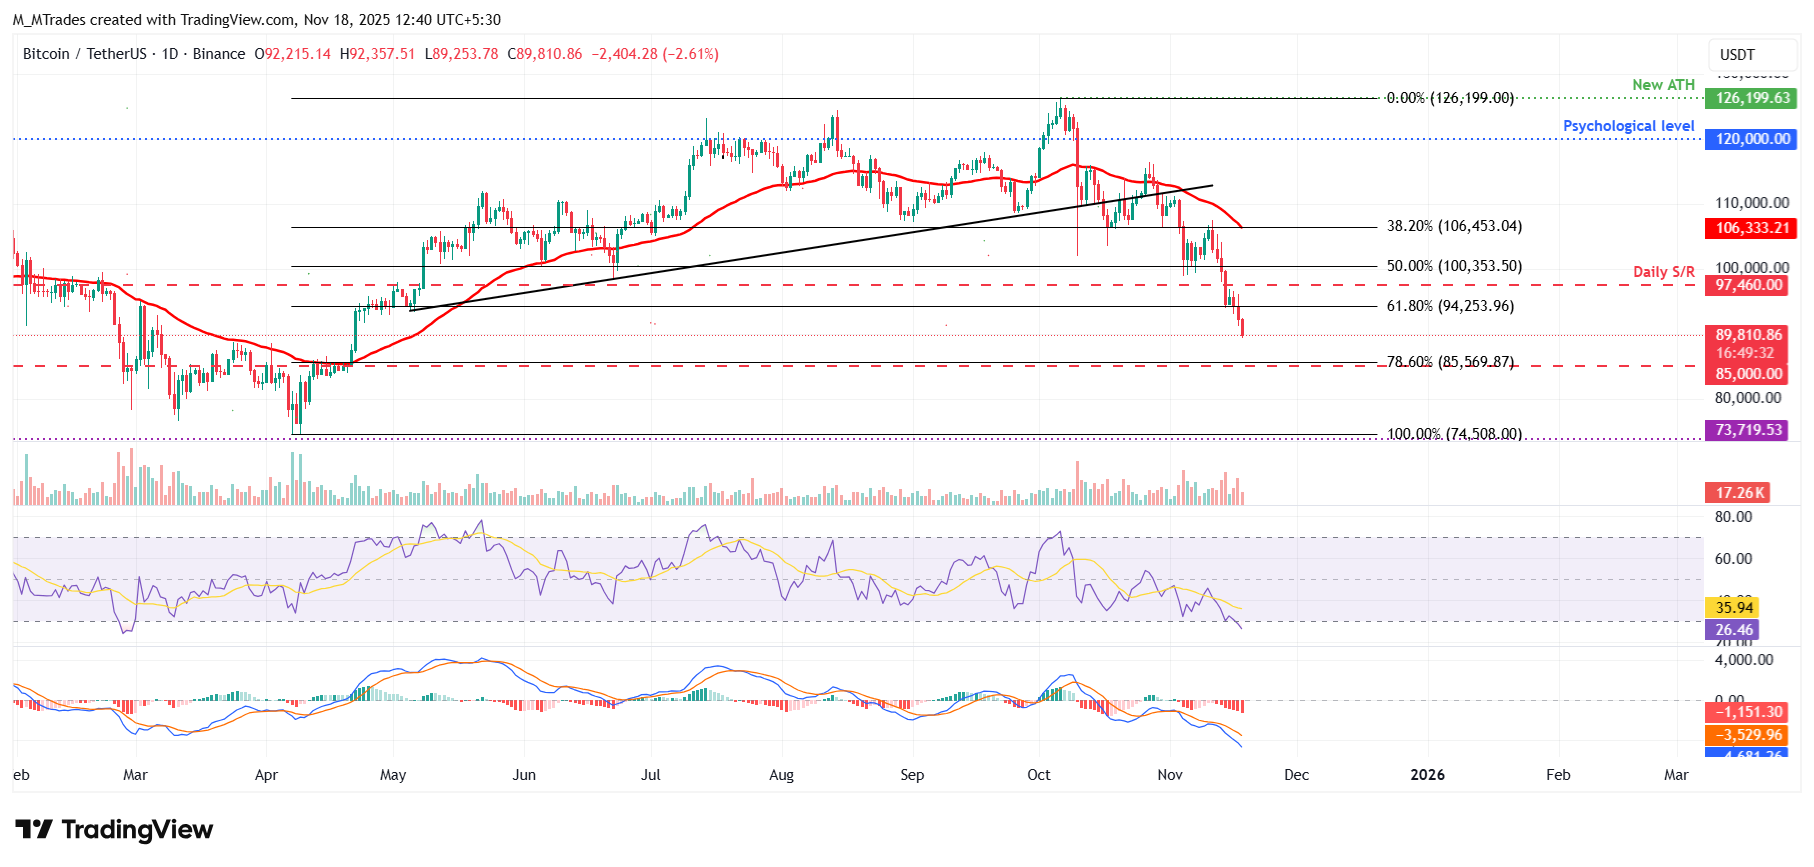
On the other hand, if BTC recovers, it could extend the recovery toward the 61.8% Fibonacci retracement level at $94,253.
Cryptocurrency metrics FAQs
The developer or creator of each cryptocurrency decides on the total number of tokens that can be minted or issued. Only a certain number of these assets can be minted by mining, staking or other mechanisms. This is defined by the algorithm of the underlying blockchain technology. On the other hand, circulating supply can also be decreased via actions such as burning tokens, or mistakenly sending assets to addresses of other incompatible blockchains.
Market capitalization is the result of multiplying the circulating supply of a certain asset by the asset’s current market value.
Trading volume refers to the total number of tokens for a specific asset that has been transacted or exchanged between buyers and sellers within set trading hours, for example, 24 hours. It is used to gauge market sentiment, this metric combines all volumes on centralized exchanges and decentralized exchanges. Increasing trading volume often denotes the demand for a certain asset as more people are buying and selling the cryptocurrency.
Funding rates are a concept designed to encourage traders to take positions and ensure perpetual contract prices match spot markets. It defines a mechanism by exchanges to ensure that future prices and index prices periodic payments regularly converge. When the funding rate is positive, the price of the perpetual contract is higher than the mark price. This means traders who are bullish and have opened long positions pay traders who are in short positions. On the other hand, a negative funding rate means perpetual prices are below the mark price, and hence traders with short positions pay traders who have opened long positions.

Acuity Trading
Acuity Trading 是一家成立於 2013 年、總部位於倫敦的金融科技公司,專注於 AI 驅動的另類數據與情緒分析,用於交易與投資。他們以可視化新聞與情緒工具革新線上交易體驗,並持續以最新 AI 研究與技術提供可產生阿爾法的另類數據與高度互動的交易工具。
Read More


