
Trade The World
Ripple Price Prediction: XRP eyes uptrend fresh rebound amid US inflation concerns
作者 John Isige
發布日期: 14 Aug 2025 | 修改日期: 14 Aug 2025


POPULAR ARTICLES

Ripple (XRP) is facing a spike in volatility on Thursday that is impacting most major cryptocurrencies. The international money transfer token is down nearly 5%, trading at $3.12 at the time of writing.
- XRP edges lower and tests support at $3.00 as liquidations surge.
- Crypto majors reverse part of the gains as the US PPI report signals a potential spike in inflation.
- Technical indicators lean bearish with the RSI near the midline and the MACD upholding a sell signal.
Ripple (XRP) is facing a spike in volatility on Thursday that is impacting most major cryptocurrencies. The international money transfer token is down nearly 5%, trading at $3.12 at the time of writing.
XRP offers bearish signals with support at $3.00, currently holding. However, the headwinds in the broader cryptocurrency market signal that the decline could accelerate below the immediate support, reflecting weak sentiment as concerns about United States (US) inflation mount.
XRP uptrend falters as US PPI rises in July
The US Producer Price Index (PPI) data released by the Bureau of Labor Statistics (BLS) on Thursday showed that wholesale prices of goods and services were up 0.9% on a monthly basis in July and 3.3% on an annual basis. Thursday’s PPI figures significantly exceeded economists’ expectations that wholesale prices would rise 0.2% in July and 2.5% annually.
Excluding food and energy, core PPI increased 0.9%, accelerating the annual rate to 3.7%, its highest level since March.
The uptick in the PPI index suggests that inflation is gradually escalating in the US, with consumers likely to feel the pinch in the coming months. PPI data is used as a potential bellwether for the prices consumers may face in the near future.
Investors in risk assets, including crypto, are on edge, concerned about the impact of higher prices of goods and services, which could drive inflation and further delay potential Federal Reserve (Fed) rate cuts, largely expected to begin in September.
Bitcoin (BTC) price led the correction after peaking at the new all-time high of $124,474 earlier in the day. Ethereum (ETH) has trimmed part of the gains and tested support at $4,500 before reversing the trend slightly above $4,600.
XRP offers bearish signals in the daily timeframe amid a significant increase in liquidations. According to CoinGlass data, a total of $62 million has been wiped out over the past 24 hours, with long position traders bearing the biggest brunt. Approximately $57 million worth of long positions have been liquidated compared to about $5 million in shorts.
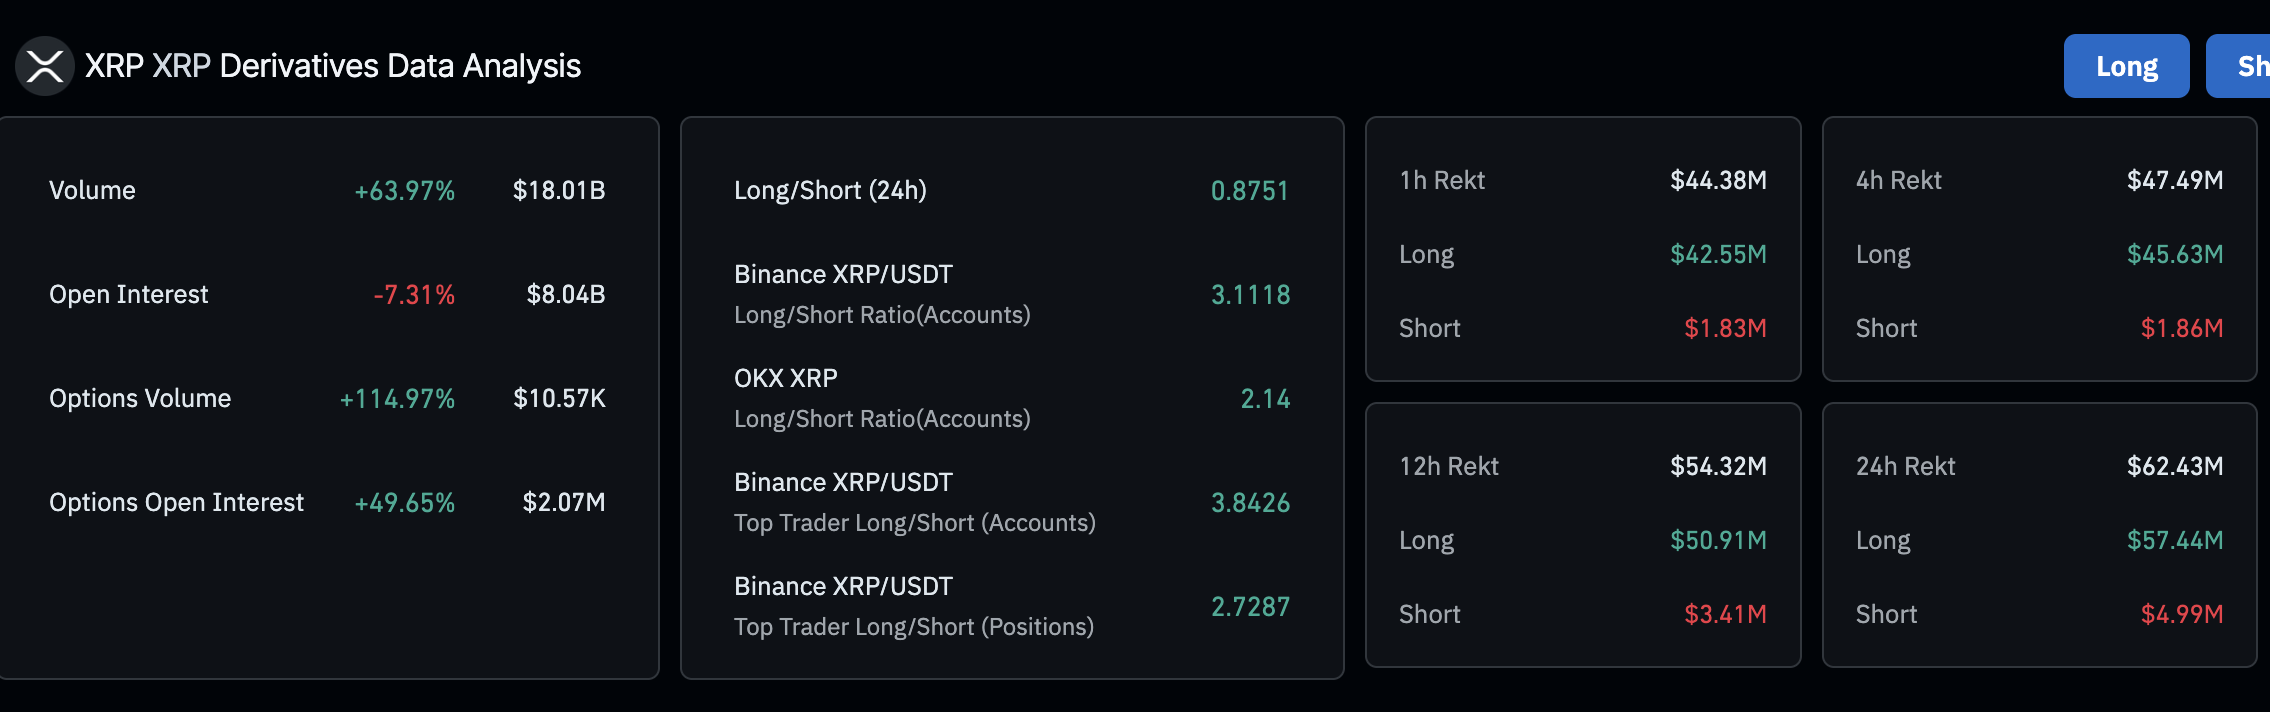
XRP derivatives market liquidations data | Source: CoinGlass
The surge in liquidations could lead to a short squeeze as traders buy XRP to cover long positions. Should the short-term support at $3.00 hold, interest in buying the dip may ramp up demand, driving the price of XRP higher.
Technical outlook: Can XRP bulls renew the uptrend?
XRP is trading above support $3.00 following the brief US economic data-driven sell-off. The downward-trending Relative Strength Index (RSI) underscores the slump in buying pressure. Suppose the RSI extends the decline below the midline. In that case, the path of least resistance will remain downward, increasing the chances of XRP sliding to test support provided by the 50-day Exponential Moving Average (EMA) at $2.92.
A sell signal maintained by the Moving Average Convergence Divergence (MACD) indicator since July 24 backs the bearish bias. Investors will consider reducing exposure as long as the MACD line in blue stays below the red signal line. The red histogram bars below the zero line indicate bearish momentum is building.
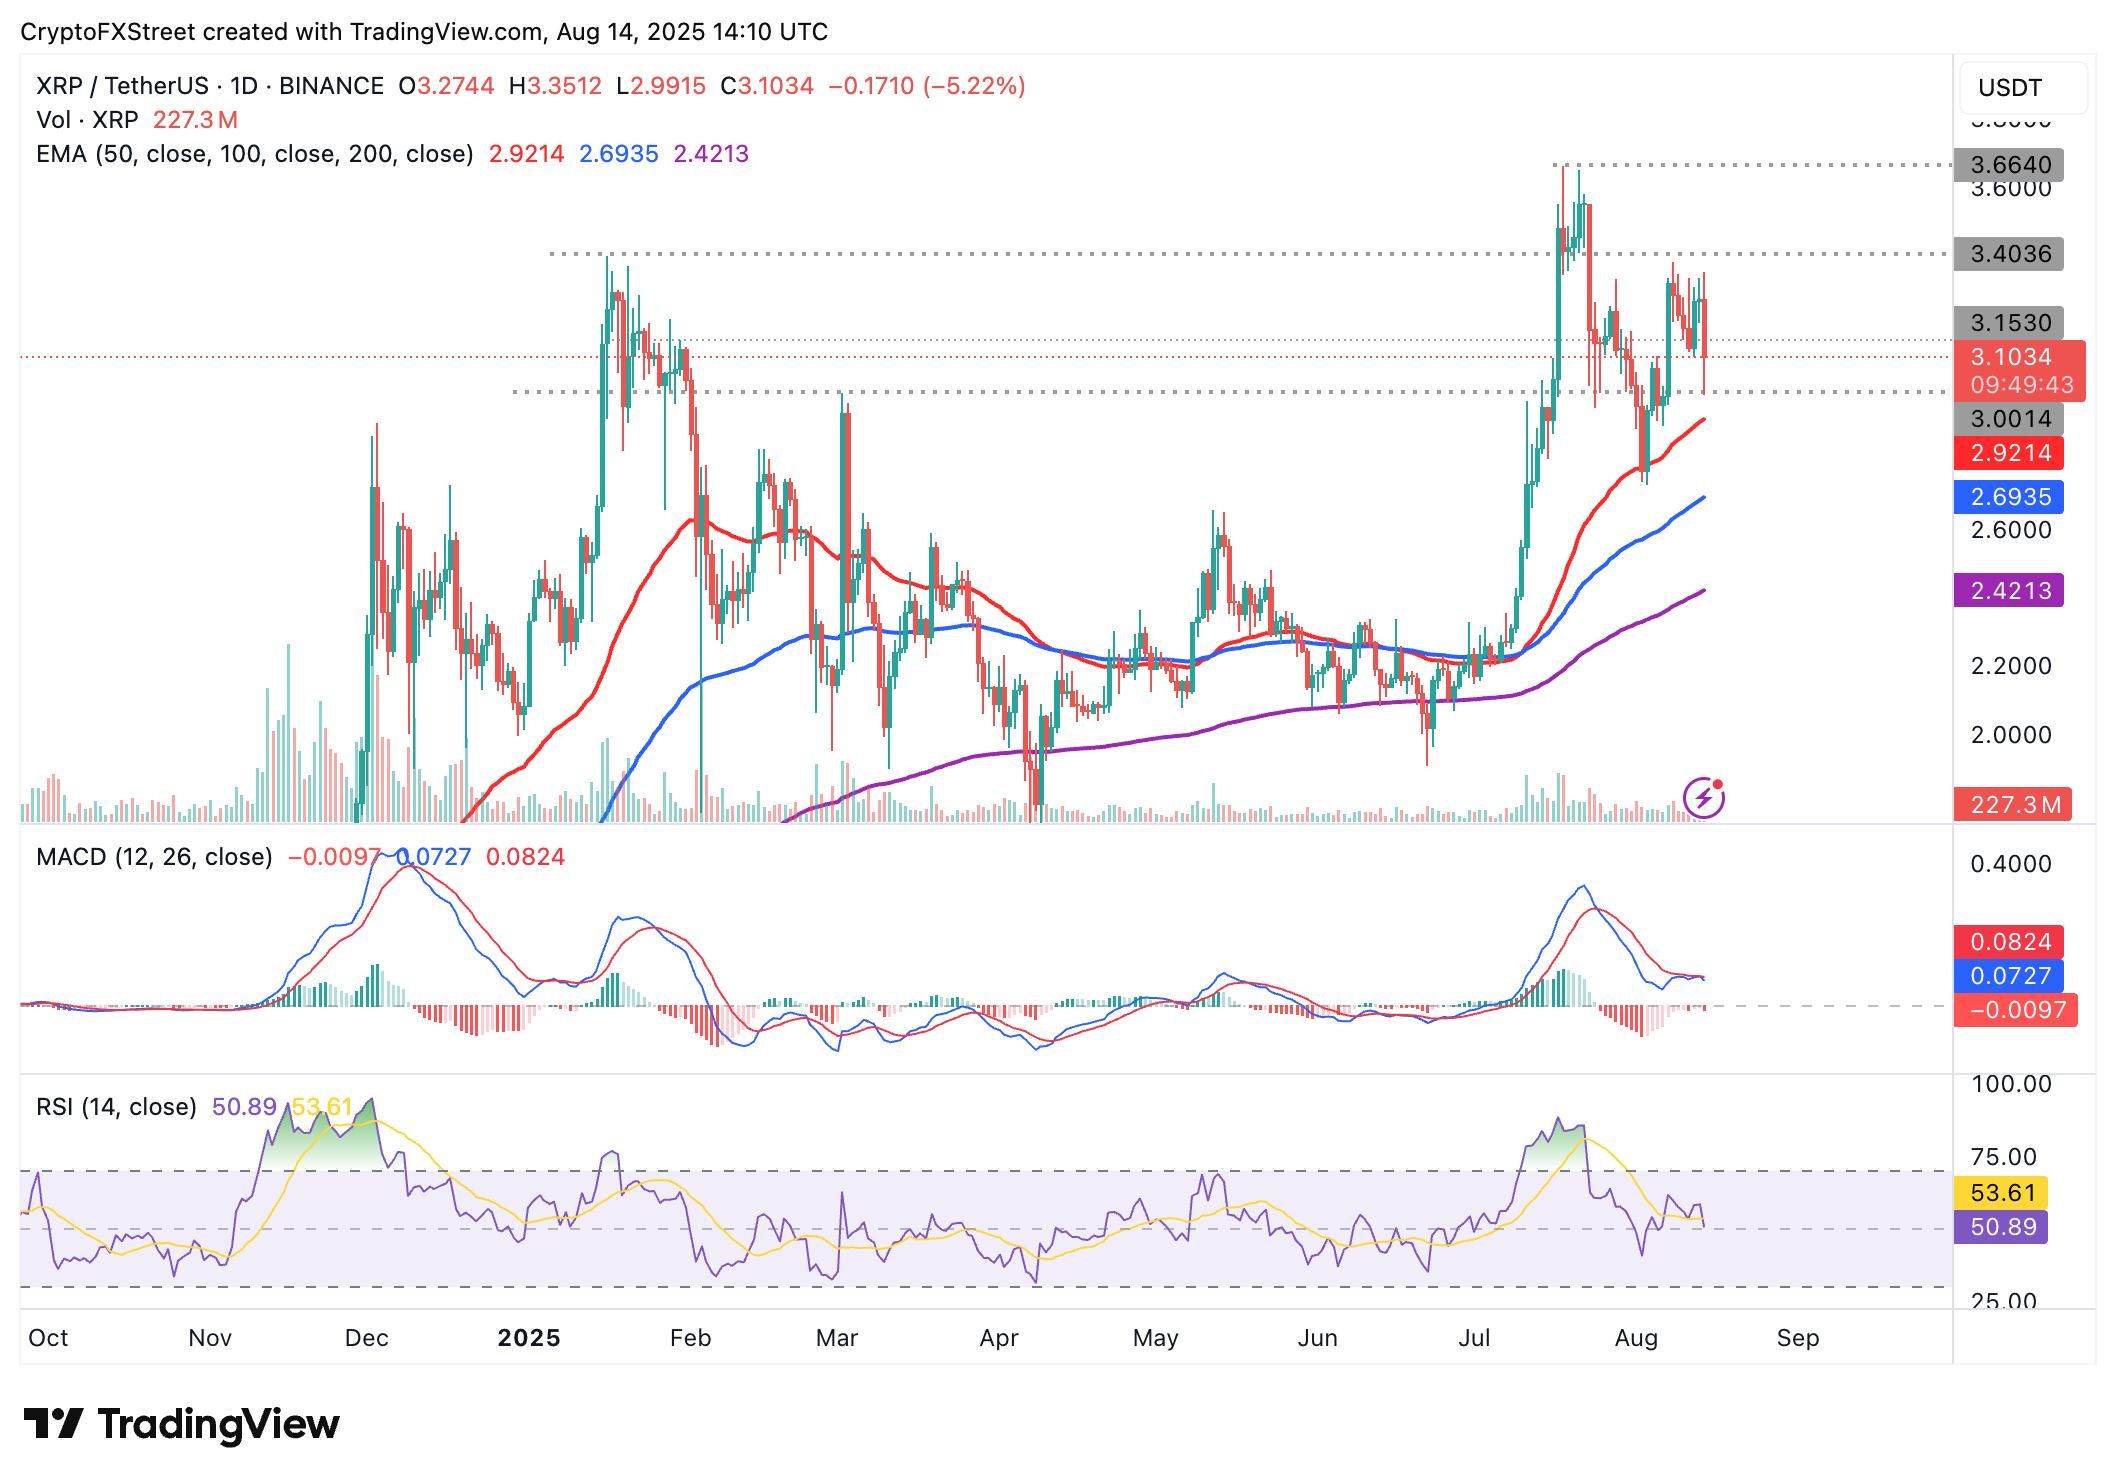
XRP/USDT daily chart
Still, key moving averages, including the 50-day EMA at $2.92, the 100-day EMA at $2.69 and the 200-day EMA at $2.42, are upward facing, which reinforces XRP’s bullish technical structure.
These levels will also serve as tentative support if the decline accelerates below $3.00. Other key areas of interest for traders are the seller congestion at around $3.40, tested on Friday and the record high of $3.66 reached on July 18.
Cryptocurrency metrics FAQs
The developer or creator of each cryptocurrency decides on the total number of tokens that can be minted or issued. Only a certain number of these assets can be minted by mining, staking or other mechanisms. This is defined by the algorithm of the underlying blockchain technology. On the other hand, circulating supply can also be decreased via actions such as burning tokens, or mistakenly sending assets to addresses of other incompatible blockchains.
Market capitalization is the result of multiplying the circulating supply of a certain asset by the asset’s current market value.
Trading volume refers to the total number of tokens for a specific asset that has been transacted or exchanged between buyers and sellers within set trading hours, for example, 24 hours. It is used to gauge market sentiment, this metric combines all volumes on centralized exchanges and decentralized exchanges. Increasing trading volume often denotes the demand for a certain asset as more people are buying and selling the cryptocurrency.
Funding rates are a concept designed to encourage traders to take positions and ensure perpetual contract prices match spot markets. It defines a mechanism by exchanges to ensure that future prices and index prices periodic payments regularly converge. When the funding rate is positive, the price of the perpetual contract is higher than the mark price. This means traders who are bullish and have opened long positions pay traders who are in short positions. On the other hand, a negative funding rate means perpetual prices are below the mark price, and hence traders with short positions pay traders who have opened long positions.

Acuity Trading
Acuity Trading 是一家成立於 2013 年、總部位於倫敦的金融科技公司,專注於 AI 驅動的另類數據與情緒分析,用於交易與投資。他們以可視化新聞與情緒工具革新線上交易體驗,並持續以最新 AI 研究與技術提供可產生阿爾法的另類數據與高度互動的交易工具。
Read More


