
Trade The World
Top 3 Price Prediction: Bitcoin, Ethereum, Ripple – BTC and ETH eye record highs, XRP breaks above bullish pattern
作者 Manish Chhetri
發布日期: 3 Oct 2025 | 修改日期: 3 Oct 2025


POPULAR ARTICLES

Bitcoin (BTC), Ethereum (ETH), and Ripple (XRP) are showing a bullish setup as of Friday. With BTC and ETH bulls aiming for their respective record highs, while XRP breaks above a bullish pattern, targeting a higher leg in the upcoming days.
- Bitcoin price closes above the $120,000 resistance, with bulls aiming for record highs.
- Ethereum price nears its daily resistance at $4,488, a firm close could trigger a rally toward all-time highs.
- XRP breaks above the falling wedge pattern, with the next bullish target set at $3.40.
Bitcoin (BTC), Ethereum (ETH), and Ripple (XRP) are showing a bullish setup as of Friday. With BTC and ETH bulls aiming for their respective record highs, while XRP breaks above a bullish pattern, targeting a higher leg in the upcoming days.
Bitcoin closes above the $120,000 psychological level
Bitcoin price started the week on a positive note, extending its recovery by 1.92% on Monday and closing above the 50-day Exponential Moving Average (EMA) at $114,076. However, on Tuesday, BTC declined slightly but found support around the 50-day EMA, continuing its rally for the next two days and closing above $120,000. At the time of writing on Friday, it hovers at around $119,800.
If BTC continues its upward momentum, it could extend the rally toward the all-time high of $124,474.
The Relative Strength Index (RSI) on the daily chart reads 64, above the neutral level of 50, indicating bullish momentum. Additionally, the Moving Average Convergence Divergence (MACD) showed a bullish crossover on Wednesday, providing a buy signal and suggesting the start of an upward trend ahead.
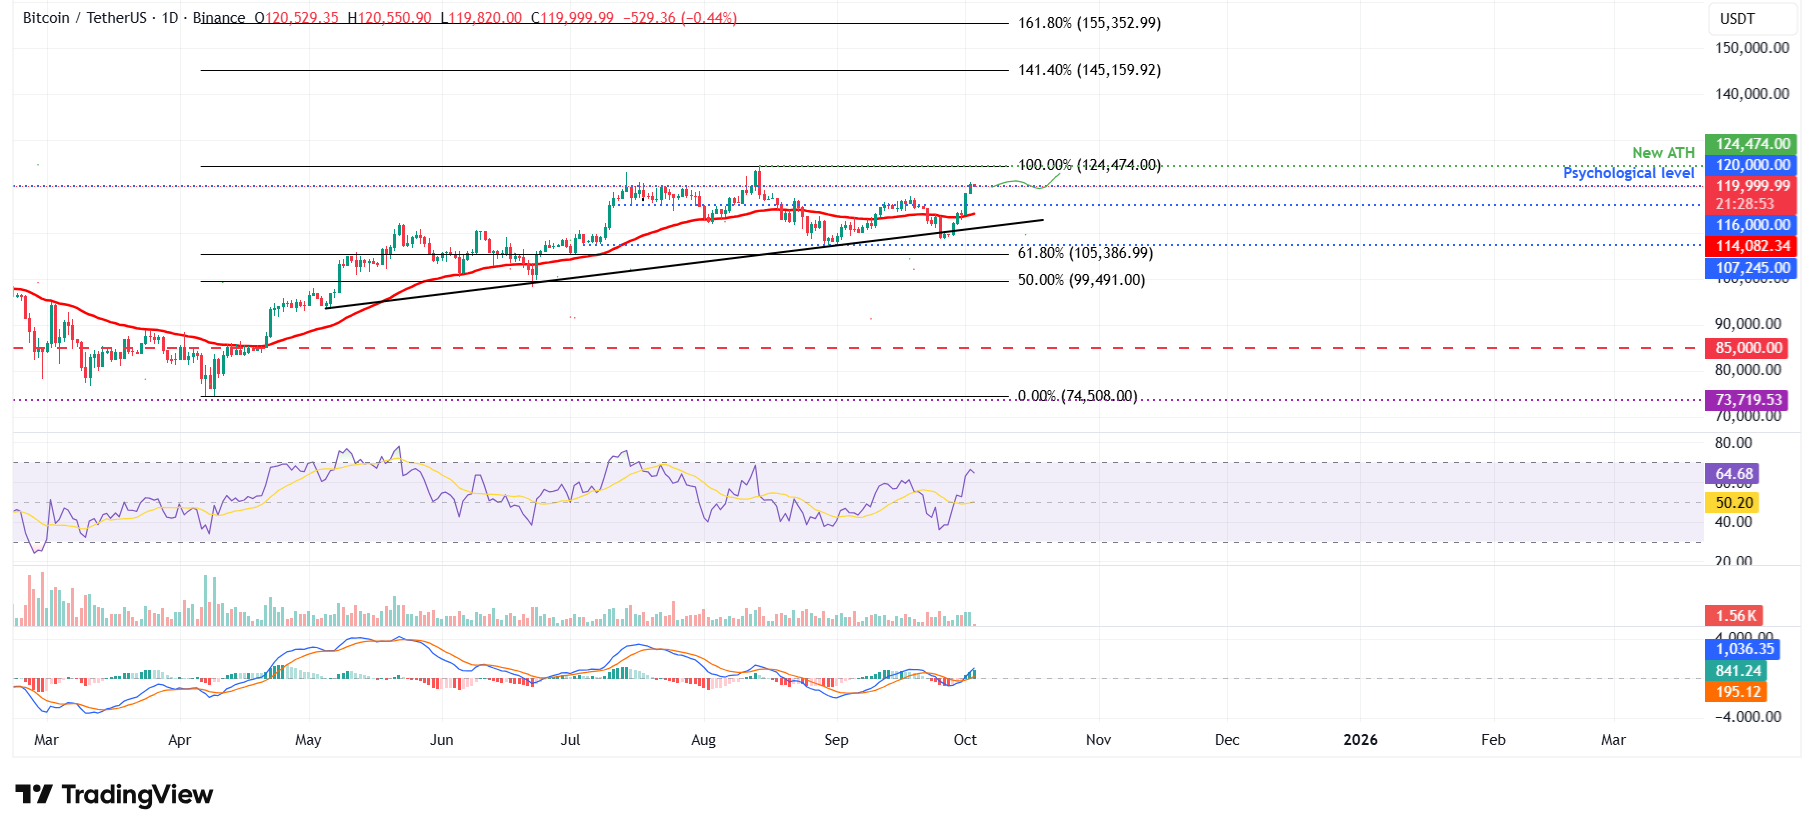
BTC/USDT daily chart
However, if BTC faces a correction, it could extend the decline toward the daily support at $116,000.
Ethereum could extend gains if it closes above $4,488 resistance
Ethereum price found support around the 200-day EMA at $3,905 on September 25 and recovered 7.10% by Sunday. As the week began, ETH continued its recovery, closing above the daily resistance at $4,232 on Wednesday and rising 3.14% the next day, nearing the next key resistance at $4,488. At the time of writing on Friday, ETH hovers around $4,500.
If ETH closes above the daily resistance at $4,488 on a daily basis, it could extend the rally toward the record highs at $4,956.
The RSI on the daily chart reads 57, which is above the neutral level of 50, indicating that bullish momentum is gaining traction. Like Bitcoin, ETH’s MACD indicator also showed a bullish crossover this week, supporting the bullish view.
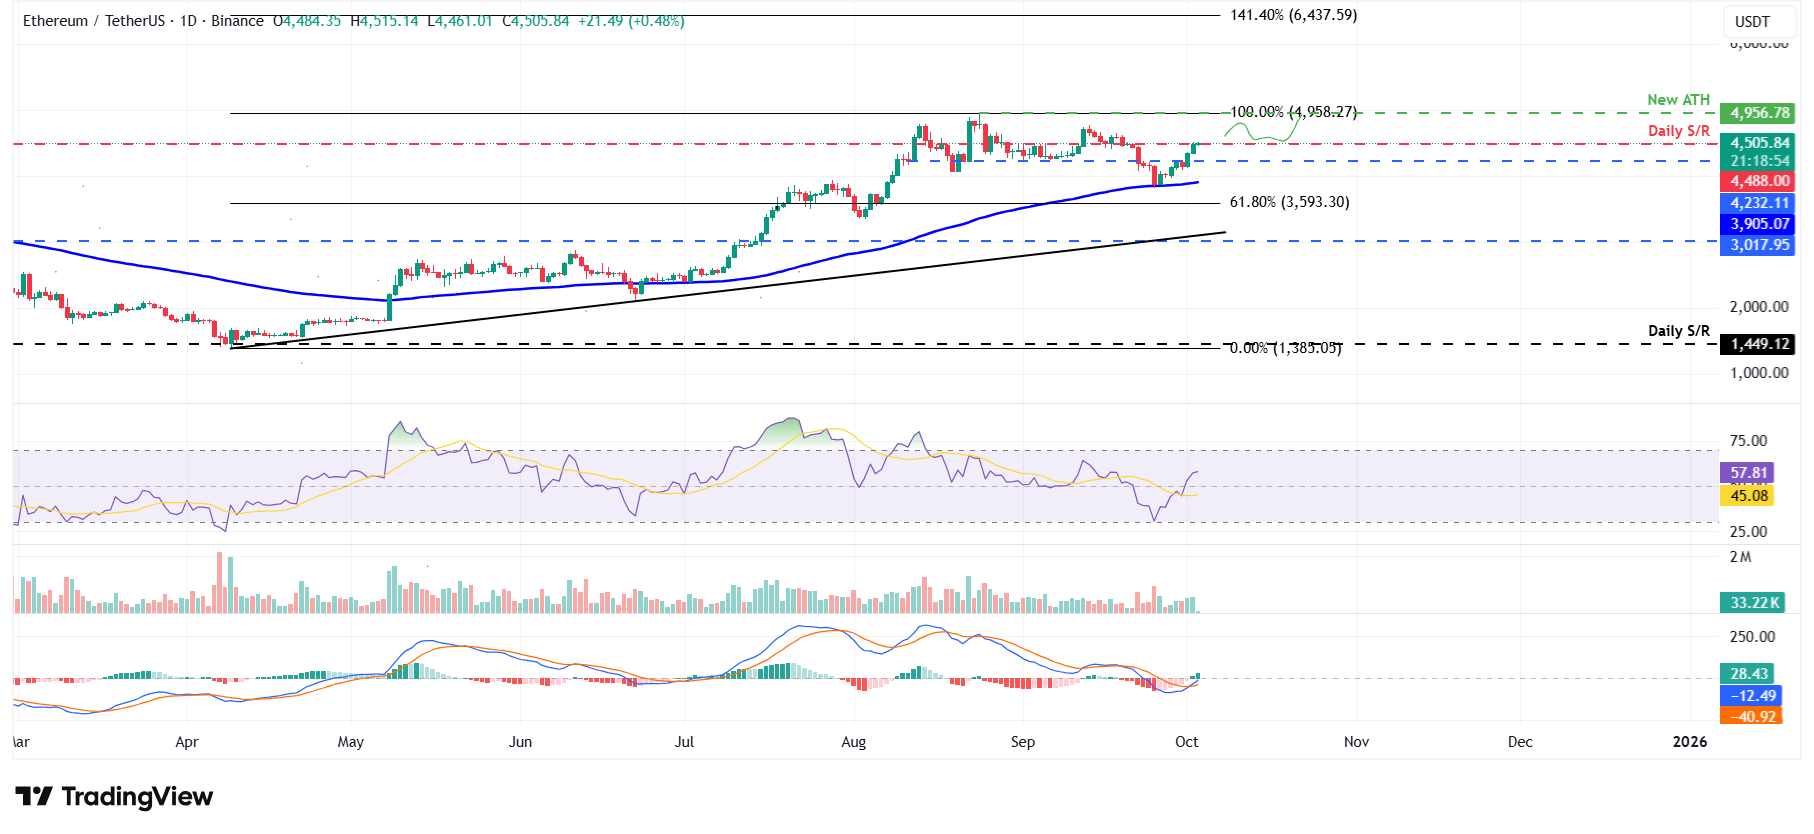
ETH/USDT daily chart
On the other hand, if ETH faces a correction, it could extend the decline toward the daily support level at $4,232.
XRP validates falling wedge pattern
Ripple price breaks above the falling wedge pattern (drawn by joining multiple lows and highs with two trendlines since mid-July) on Thursday. A breakout of this pattern generally favours the bulls. At the time of writing on Friday, it hovers around $3.01.
If XRP continues its upward trend, it could extend the rally toward the next daily resistance at $3.40.
Like Ethereum, XRP’s RSI and MACD indicators on the daily chart support a bullish outlook.
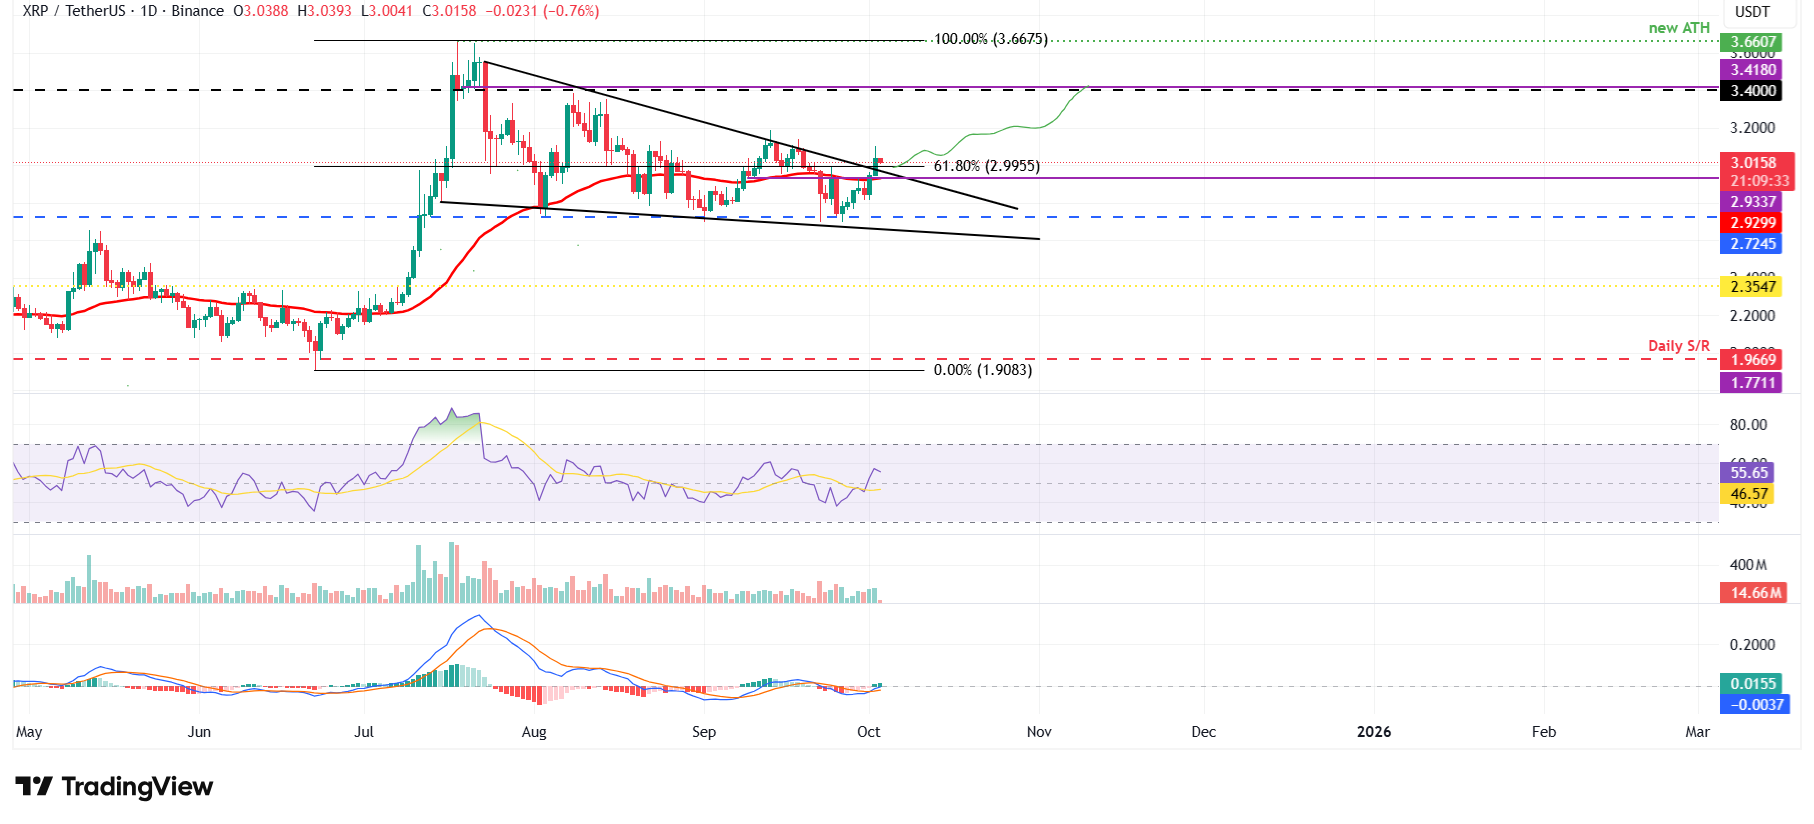
XRP/USDT daily chart
However, if XRP faces a correction, it could extend the decline toward the daily support at $2.72.
Cryptocurrency metrics FAQs
The developer or creator of each cryptocurrency decides on the total number of tokens that can be minted or issued. Only a certain number of these assets can be minted by mining, staking or other mechanisms. This is defined by the algorithm of the underlying blockchain technology. On the other hand, circulating supply can also be decreased via actions such as burning tokens, or mistakenly sending assets to addresses of other incompatible blockchains.
Market capitalization is the result of multiplying the circulating supply of a certain asset by the asset’s current market value.
Trading volume refers to the total number of tokens for a specific asset that has been transacted or exchanged between buyers and sellers within set trading hours, for example, 24 hours. It is used to gauge market sentiment, this metric combines all volumes on centralized exchanges and decentralized exchanges. Increasing trading volume often denotes the demand for a certain asset as more people are buying and selling the cryptocurrency.
Funding rates are a concept designed to encourage traders to take positions and ensure perpetual contract prices match spot markets. It defines a mechanism by exchanges to ensure that future prices and index prices periodic payments regularly converge. When the funding rate is positive, the price of the perpetual contract is higher than the mark price. This means traders who are bullish and have opened long positions pay traders who are in short positions. On the other hand, a negative funding rate means perpetual prices are below the mark price, and hence traders with short positions pay traders who have opened long positions.

Acuity Trading
Acuity Trading 是一家成立於 2013 年、總部位於倫敦的金融科技公司,專注於 AI 驅動的另類數據與情緒分析,用於交易與投資。他們以可視化新聞與情緒工具革新線上交易體驗,並持續以最新 AI 研究與技術提供可產生阿爾法的另類數據與高度互動的交易工具。
Read More


